|
October 2018 Trading & Investment Strategy
|
|
By:
|
September 27, 2018
|
|
|
|
|
Market at a Glance - 9/27/2018
|
|
By:
Christopher Mistal
|
September 27, 2018
|
|
|
|
9/26/2018: Dow 26385.28 | S&P 2905.97 | NASDAQ 7990.37 | Russell 2K 1691.61 | NYSE 13101.96 | Value Line Arith 6555.76
Psychological: Frothy. According to
Investor’s Intelligence Advisors Sentiment survey bulls are at 60.6%. Correction advisors are at 21.1% and Bearish advisors are just 18.3%. The difference between bulls and bears is at a worrisome level and has been for four of the last five weeks. The CBOE Volatility index, or VIX, is also rather subdued with readings on either side of 12 over the past week. Bullish sentiment can remain elevated and the market can continue to climb, but at some point both bullish sentiment and the market will retreat. Based upon current fundamental and technical readings any retreat is likely to be brief and could make a good buying opportunity ahead of the typically bullish fourth quarter.
Fundamental: Firm. Broadly speaking, economic data is solid. Atlanta Fed GDPNow model is currently forecasting Q3 growth of 3.8%. Employment statistics are robust with an unemployment rate of 3.9%. Housing may be in a soft patch as sales modestly dip, but prices are firm (and likely the cause of the decline). Trade and tariffs are a concern, but at current levels the impact appears manageable. Corporate earnings are robust now, but comparisons will be tougher next year.
Technical: Consolidating. DJIA was last to trade at a new all-time high last week. Since then, DJIA, S&P 500 and NASDAQ have all mildly retreated. Weakness near the end of Q3 is not uncommon. The rally is likely to resume once October arrives. The long-term bullish trend is still intact.
Monetary: 2.00-2.25%. At the conclusion of its September meeting, the Fed did exacting what everyone expected. It raised the Fed funds rate by 0.25%. During the post-meeting press conference Fed Chair Powell acknowledged the currently strong economy and indicated that further rate increases were more than just likely. Unfortunately, the Fed's own estimates for future growth and inflation remained rather tepid and the yield curve has only flattened further. The Fed is likely the biggest risk to the economy and the stock market at this time as too much monetary policy tightening could easily derail growth just as it has begun showing signs of accelerating.
Seasonal: Improving. October is the last month of the “Worst Six Months” for DJIA and S&P 500 and the last month of NASDAQ’s “Worst Four Months”. Frightful history of market crashes aside, October has been stellar in midterm years, number one month for DJIA, S&P 500, NASDAQ, Russell 1000 and Russell 2000. Keep an eye out for our Seasonal Buy Signal. It can trigger anytime on or after October 1.
|
October Outlook: Midterm October Launching Pad
|
|
By:
Jeffrey A. Hirsch & Christopher Mistal
|
September 27, 2018
|
|
|
|
Historically, the “Worst Six Months” (WSM) of the midterm year has been weaker than WSM in all other years of the 4-Year Presidential Election Cycle, with Q2-Q3 of the midterm year being the weakest consecutive two-quarter combo of the cycle. August and September have historically been the worst two months of the year, though they rank higher in midterm years, but have still posted average losses in midterm years since 1950.
This has not been the case this year. Despite a fast and furious, albeit not terribly deep, correction in the first quarter of 2018, ranging from 10.2% on the S&P 500 to 12.9% on NASDAQ, the U.S. stock markets have performed quite well this year. Fed Chairman Powell may have put it best yesterday in his news conference following the FOMC’s decision to raise the Fed Funds Target Rate a quarter of a point.
In his official statement Chairman Powell stated that, “Both household spending and business investment are expanding briskly, and the overall growth outlook remains favorable. Several factors support this assessment: Fiscal policy is boosting the economy, ongoing job gains are raising incomes and confidence, and overall financial conditions remain accommodative.”
With all these gains so far in 2018, there has been much talk on The Street that it will steal from the Q4 rally and the “Sweet Spot” of the 4-Year Cycle from Q4 in the midterm year through Q2 of the pre-election year. Two weeks ago in our Alert “
Q3 Update: Sweet Spot Still Looks Good” we illustrated that while gains have been slightly lower during the Sweet Spot after YTD gains as of midterm September, they are still rather robust.
Following YTD-September gains in the midterm year this three-quarter Sweet Spot has produced average gains of 16.8% for the S&P 500 vs. 21.1% in all midterm year Sweet Spot rallies since 1950. And most importantly, fundamental and technical readings are supportive of further gains.
The
Fed is forecasting a solid 3.1% GDP growth rate for this year and 2.5% for next year. Growth forecast don’t really begin to slow down until 2020 (2.0%), 2021 and beyond, with its long-run forecast at 1.8%.
According to FactSet, “the earnings growth rate for the S&P 500 for the second quarter has improved to 24.6% today from 20.0% on June 30.”
As Chairman Powell stated above, job growth remains strong. This is keeping the Unemployment Rate historically low at 3.9% as reported by the U.S. Bureau of Labor Statistics. Weekly Initial Jobless Claims, according to the U.S. Employment and Training Administration also remain in a continuing downtrend since March 2009, currently just above historic lows at 214,000 last week.
Technically speaking, market internals are constructive with room for improvement as you can see in the Pulse of the Market below. The Advance-Decline line is in an uptrend this year, though mixed as of late. New Highs and New Lows continue to battle it out as the market leaders are in rotation. The 50-day moving averages of the major averages remain in clear uptrends, which is supportive.
Market sentiment readings are high, but not at extremely exuberant levels that accompany market tops. As noted in the
Market at a Glance bullish advisors in the
Investor’s Intelligence Advisors Sentiment survey are at 60.6%, which is high, but well below the 66.7% level we were at last January just before the correction. And with bearish advisors at 18.3% the bull-bear spread is at 42.3%, well below January’s high reading of 54.0%. Moreover, this survey began to hit these levels last October and ran for four months before the market began to correct in late January.
Furthermore, the recent new all-time high on the Dow helps to confirm the market’s uptrend and the Dow Transports also reaching new highs gives us a little Dow Theory confirmation. Yes, the market still has work to do, and we have Octoberphobia to contend with yet. So be patient and watchful, but get ready for the Sweet Spot rally.
Pulse of the Market
DJIA’s streak of no new all-time highs finally came to an end on September 20, 2018 at 237 calendar days (1). DJIA has finally caught up with S&P 500, NASDAQ and Russell 2000; all have made new all-time highs recently. However, the momentum that supported DJIA’s rise to new all-time highs has begun to fade as the end of the third quarter nears. This shift in momentum can be seen in both the faster (2) and slower moving MACD indicators that are currently trending toward a bearish, sell crossover.
Over the last six weeks, DJIA logged two more Down Friday/Down Mondays (DF/DM) warnings in consecutive weeks (3). Those back-to-back DF/DM warnings were essentially completely ignored by DJIA, but S&P 500 and NASDAQ did suffer declines during the first week of September while DJIA declined 48.28 points or just 0.2%.
Since the beginning of July, DJIA and S&P 500 (4) have advanced ten times in twelve weeks. NASDAQ’s performance (5) has been more volatile with five weekly losses over the same time period. Absent any meaningful pullback or retreat and while economic data remains firm, the current bullish trend of the market is likely to continue.
Market breath measured by NYSE Weekly Advancers and NYSE Weekly Decliners (6) remains supportive of further additional market gains. Advancers are still holding onto the majority in positive weeks, but the margin over decliners is modest. A greater number of weekly Advancers could be a sign that gains could also begin to accelerate.
Weekly New Highs and New Lows (7) continue to fluctuate with no clear trend for any meaningful duration of time. For the final three weeks of August, New Highs were expanding and New Lows were shrinking, but that ended at the start of September when New Highs and New Lows both reversed direction. Current readings appear consistent with a market that is trading near its recent highs in search of leadership. Look for an expanding number of New Highs and shrinking number of New Lows for confirmation that the market may have found leadership.
30-year Treasury bond yields (8) are still hovering just above 3% while the 90-day Treasury rate continues to march steadily higher. A flattening yield curve is putting pressure on bank stocks while higher yields are also weighing on the housing sector.
Click image to view full size…
|
October Almanac: Best Month of Midterm Year
|
|
By:
Jeffrey A. Hirsch & Christopher Mistal
|
September 27, 2018
|
|
|
|
October often evokes fear on Wall Street as memories are stirred of crashes in 1929, 1987, the 554-point drop on October 27, 1997, back-to-back massacres in 1978 and 1979, Friday the 13th in 1989 and the 733-point drop on October 15, 2008. During the week ending October 10, 2008, Dow lost 1,874.19 points (18.2%), the worst weekly decline in our database going back to 1901, in point and percentage terms. The term “Octoberphobia” has been used to describe the phenomenon of major market drops occurring during the month. Market calamities can become a self-fulfilling prophecy, so stay on the lookout and don’t get whipsawed if it happens.
But October has become a turnaround month—a “bear killer” if you will. Twelve post-WWII bear markets have ended in October: 1946, 1957, 1960, 1962, 1966, 1974, 1987, 1990, 1998, 2001, 2002 and 2011 (S&P 500 declined 19.4%). However, eight were midterm bottoms. This year is a midterm year, but the market has been resilient thus far during the Worst Months which may temper full-month October results.
Midterm election year Octobers are downright stellar thanks to the major turnarounds mentioned above; ranking number one on the Dow, S&P 500, NASDAQ, Russell 1000 and Russell 2000. This is also the beginning of the
sweet spot of the four-year-presidential-election-cycle. The fourth quarter of the midterm years combines with the first and second quarters of the pre-election years for the best three consecutive quarter span for the market, averaging 20.4% for the Dow and 21.1% for the S&P 500 (since 1949), and an amazing 32.0% for NASDAQ (since 1971).
Options expiration week in October provides plenty of opportunity. On the Monday before expiration the Dow has only been down eight times since 1980 and the Russell 2000 is up twenty-one of the last twenty-eight years, seventeen straight from 1990 to 2006. Expiration day has a spotty record as does the week as a whole. After a market bottom in October, the week after is most bullish, otherwise it is susceptible to downdrafts.
October is also the end of the Dow and S&P 500 “Worst 6 Months” and NASDAQ “Worst 4 Months”. Remain attentive for our Seasonal Buy Signal that can occur anytime beginning October 1. An email Alert will be sent when it triggers.
| October (1950-2017) |
| |
DJI |
SP500 |
NASDAQ |
Russell
1K |
Russell 2K |
| Rank |
|
7 |
|
7 |
|
7 |
|
5 |
|
10 |
| #
Up |
|
41 |
|
41 |
|
26 |
|
25 |
|
22 |
| #
Down |
|
27 |
|
27 |
|
21 |
|
14 |
|
17 |
| Average
% |
|
0.7 |
|
0.9 |
|
0.8 |
|
1.0 |
|
-0.3 |
| 4-Year Presidential Election Cycle Performance
by % |
| Post-Election |
|
0.9 |
|
1.0 |
|
1.4 |
|
0.9 |
|
0.3 |
| Mid-Term |
|
3.1 |
|
3.3 |
|
4.2 |
|
4.7 |
|
3.9 |
| Pre-Election |
|
-0.5 |
|
0.1 |
|
0.05 |
|
0.2 |
|
-1.9 |
| Election |
|
-0.8 |
|
-0.7 |
|
-2.1 |
|
-1.5 |
|
-2.8 |
| Best & Worst October by % |
| Best |
1982 |
10.7 |
1974 |
16.3 |
1974 |
17.2 |
1982 |
11.3 |
2011 |
15.0 |
| Worst |
1987 |
-23.2 |
1987 |
-21.8 |
1987 |
-27.2 |
1987 |
-21.9 |
1987 |
-30.8 |
| October Weeks by % |
| Best |
10/11/74 |
12.6 |
10/11/74 |
14.1 |
10/31/08 |
10.9 |
10/31/08 |
10.8 |
10/31/08 |
14.1 |
| Worst |
10/10/08 |
-18.2 |
10/10/08 |
-18.2 |
10/23/87 |
-19.2 |
10/10/08 |
-18.2 |
10/23/87 |
-20.4 |
| October Days by % |
| Best |
10/13/08 |
11.1 |
10/13/08 |
11.6 |
10/13/08 |
11.8 |
10/13/08 |
11.7 |
10/13/08 |
9.3 |
| Worst |
10/19/87 |
-22.6 |
10/19/87 |
-20.5 |
10/19/87 |
-11.4 |
10/19/87 |
-19.0 |
10/19/87 |
-12.5 |
| First Trading Day of Expiration Week: 1990-2017 |
| #Up-#Down |
|
22-6 |
|
20-8 |
|
19-9 |
|
21-7 |
|
21-7 |
| Streak |
|
U1 |
|
U1 |
|
U1 |
|
U1 |
|
U1 |
| Avg
% |
|
0.6 |
|
0.6 |
|
0.7 |
|
0.6 |
|
0.5 |
| Options Expiration Day: 1990-2017 |
| #Up-#Down |
|
14-14 |
|
18-10 |
|
19-9 |
|
18-10 |
|
13-15 |
| Streak |
|
U1 |
|
U1 |
|
U5 |
|
U1 |
|
U1 |
| Avg
% |
|
0.03 |
|
0.02 |
|
0.04 |
|
0.02 |
|
-0.04 |
| Options Expiration Week: 1990-2017 |
| #Up-#Down |
|
20-8 |
|
20-8 |
|
16-12 |
|
20-8 |
|
16-12 |
| Streak |
|
U3 |
|
U3 |
|
U3 |
|
U3 |
|
U2 |
| Avg
% |
|
0.8 |
|
0.8 |
|
1.0 |
|
0.8 |
|
0.7 |
| Week After Options Expiration: 1990-2017 |
| #Up-#Down |
|
18-10 |
|
15-13 |
|
16-12 |
|
15-13 |
|
14-14 |
| Streak |
|
U5 |
|
U1 |
|
U1 |
|
U1 |
|
D2 |
| Avg
% |
|
0.4 |
|
0.2 |
|
0.4 |
|
0.2 |
|
0.04 |
| October 2018 Bullish Days: Data 1997-2017 |
| |
3,
4, 12, 18 |
3,
4, 12, 16-19 |
2,
3, 12, 18 |
2,
3, 12, 16-19 |
18, 31 |
| |
26,
29 |
23,
24, 31 |
23,
31 |
23,
31 |
|
| October 2018 Bearish Days: Data 1997-2017 |
| |
5,
11, 25 |
5,
25 |
None |
5,
25 |
5, 8, 10, 25 |
| |
|
|
|
|
|
|
October 2018 Strategy Calendar
|
|
By:
Christopher Mistal
|
September 27, 2018
|
|
|
|
|
Seasonal MACD and Stock Portfolio Updates: Too Early & Still Holding
|
|
By:
Christopher Mistal
|
September 20, 2018
|
|
|
|
DJIA’s record-less streak finally ended today at 237 calendar days and a new all-time closing high of 26657.18. S&P 500, NASDAQ and Russell 2000 all enjoyed solid gains of just under 1%. S&P 500 also closed at a new all-time high. NASDAQ and Russell 2000 did not. Recent market strength has turned MACD positive for DJIA and S&P 500, but not NASDAQ (blue arrows in charts below point to current MACD status).
Although today’s broad based strength is an encouraging sign, it is just a single day and only DJIA and S&P 500 closed at new all-time highs. NASDAQ and Russell 2000, which lead for the bulk of the summer, need to catch up. All four indexes closing at new all-time highs would be decisively bullish especially if it lasted for multiple trading sessions.
As a reminder for all subscribers, new and veteran alike, the earliest date that we can issue our Seasonal MACD Buy signal is October 1, 2018. The criteria to issue our Seasonal MACD Buy Signal is a new buy signal using our 8-17-9 MACD indicator on or after the first trading day of October and DJIA, S&P 500 and NASDAQ must be in agreement. When the criteria are satisfied, we will send an email Alert to all active subscribers detailing what trades could be made.
Stock Portfolio Updates
Over the past six weeks since last update, S&P 500 climbed 1.8% through yesterday’s close. Russell 2000 advanced 1.0% over the same time period. Overall, the entire Stock Portfolio slipped 0.7% excluding any dividends or trading fees. Mid-caps performed the best climbing 0.1%. Large-caps were lower by 0.4% while our four Small-caps declined 1.0%. Compared to the S&P 500, the overall portfolio’s performance lagged due to a still sizable cash position and sizable declines from semiconductor related positions held throughout the portfolio.
June’s basket of Defensive Stocks is performing reasonable well even after the carnage the semiconductor sector suffered recently. Of the original 21 stocks selected eighteen are still held. Fifteen are positive with an average gain of 10.5%, three are negative and three were stopped out. Including the stopped positions, the basket’s average performance is 4.9% compared to a gain of 4.5% by S&P 500 over the same time period excluding any dividends.
Lam Research (LRCX) was stopped out of the portfolio on September 6 for a loss of 10.8%. In the last update it was trading just above $190 and had a 6% gain. This nearly 20% decline was not limited to just LRCX, but numerous other semiconductor related stocks. Yet another cryptocurrency rout in early September was at least one catalyst for the selloff. Cohu (COHU), Rudolph Tech (RTEC), Kla-Tencor Corp (KLAC) and Te Connectivity (TEL) all suffered similar declines to LRCX. The selloff does appear to be rather excessive and some names are beginning to show signs of recovery. KLAC was up 1.4% today, RTEC gained nearly 1.9% and COHU advanced a little more than 2%.
Of the remaining defensive positions, seven are up double digits. The best performing position is still McCormick & Company (MKC), now up 22.6% as of yesterday’s close. Second best is Church & Dwight (CHD) up 18.6%. Utilities NJR, OGS, AEE and CMS are also enjoying double-digit gains. Southern Company (SO) has not been as successful.
Officially the “Worst Months” for the market do not end until November begins. Thus far the “Worst Months” this year have not been bad at all, but midterm elections are quickly approaching, trade tensions are rising with new tariffs being added, bullish sentiment is at lofty levels and the Fed is in a tightening cycle. Any one of these headwinds alone could trigger a pullback or correction of magnitude and duration matching the January/February correction earlier this year. All positions in the portfolio are on Hold.
Cash and defensive positions held in the portfolio could provide some level of protection should a pullback or correction transpire in the later stages of the “Worst Months.” Please see portfolio table below for updated stop loss suggestions.
|
Q3 Update: Sweet Spot Still Looks Good
|
|
By:
Jeffrey A. Hirsch & Christopher Mistal
|
September 13, 2018
|
|
|
|
Contrary to popular opinion of the moment, seasonality is not dead. Yes, the bad months were not bad; in fact they have been quite good, so far. The S&P 500 is up 8.6% year-to-date (YTD) as of today’s close and the “Worst Six Months” (WSM) have gained 9.6% to date versus 2.8% for the “Best Six Months” (BSM) that ended on April 30, 2018.
But if you remember our
2018 Annual Forecast made last December we were anything but bearish. And then after our January Barometer reading came in firmly in the plus column, creating a
positive January Indicator Trifecta with the “Santa Claus Rally” and the “First Five Days” also up, we reaffirmed our bullish stance.
Then in March as the market recovered and the impact of the tax cuts and deregulation began to materialize we posted on our blog that the
worst of the midterm year may be behind us and that best is yet to come. We still employed our seasonal defensive stance as we moved into the WSM, and our positions in Healthcare, Utilities and Consumer Staples have been doing quite well.
Before we get into the constructive prospects for the Sweet Spot of the 4-Year Cycle, let’s remember that the WSM are not over yet and the turn of the third quarter has been known to be treacherous. There are still six weeks left in the WSM and we suffered a 10% drop in less than two weeks back in January/February.
Now for the good news. In the table below you can see the Sweet Spot of the 4-Year Cycle highlighted from Q4 in the midterm year to Q2 in the pre-election year. That’s what’s coming around the corner from October 2018 through June 2019. This three-quarter span has posted gains of 20.4%, 21.1% and 32.0% respectively for DJIA, S&P 500 and NASDAQ since 1949.
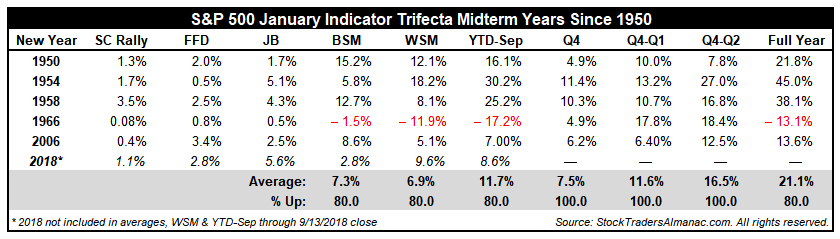
In addition, as you can see in the graph below when we have had a positive January Indicator Trifecta in the midterm year, as we have had this year, gains for the year are well-above average – and the sweet has begun in September. This is represented in the red line. Despite the early year pullback this year you can see in the thick purple line that 2018 is on track with this Midterm Year January Trifecta pattern.
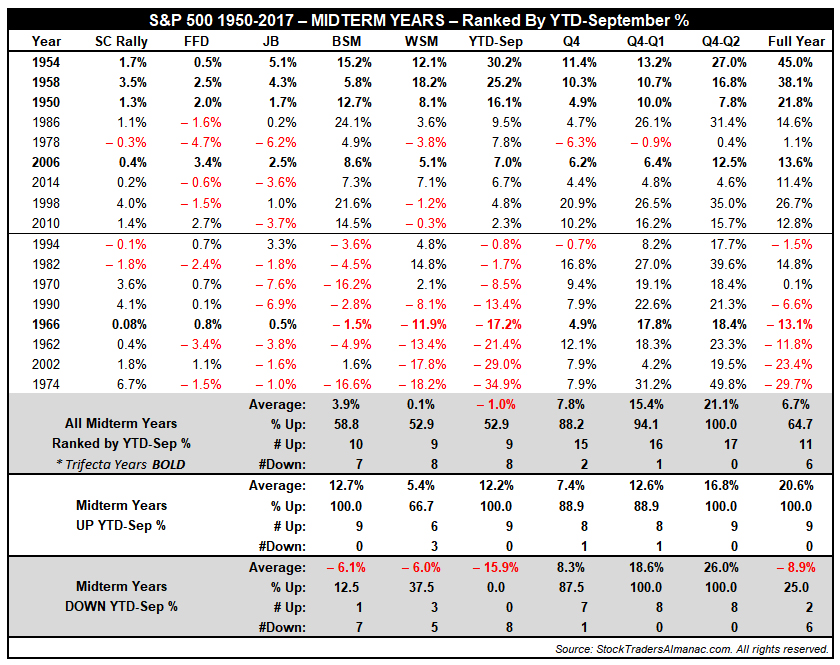
But, you may ask, “What happens when the midterm year is positive or above average at this juncture in contrast to the typical midterm year pattern?” Well, in short, the Sweet Spot has still performed quite well. As you would imagine, though, the Sweet Spot has been stronger on average and overall after a deeper midterm year correction, but it is still strong in positive midterm years.
In the two tables below we have presented all the midterm years since 1950 with their Trifecta readings for the Santa Claus Rally, the First Five Days and the January Barometer; as well as the results for the BSM, WSM, YTD-September, Q4,Q4-Q1 (pre-election), Q4-Q2 (pre-election) and the full midterm year. Amazingly, the market performance for the Sweet Spot is still quite good after solid gains earlier in the year with only 1978 showing weakness.
So it is time to begin preparations for our next Best Six Months Seasonal MACD Buy Signal, which will confirm the 4-Year Cycle Sweet Spot rally has commenced. The earliest date that we can issue our Seasonal MACD Buy signal is October 1, 2018. The criteria to issue our Seasonal MACD Buy Signal is a new buy signal using our 8-17-9 MACD indicator on or after the first trading day of October and DJIA, S&P 500 and NASDAQ must be in agreement. When the criteria are satisfied, we will send an email Alert to all active subscribers detailing what trades to make in the ETF and Stock portfolios. Stay tuned.
|
Seasonal Sector Trades & ETF Portfolio Update: Crude’s Run Stalls & Keeping Defense on the Field
|
|
By:
Christopher Mistal
|
September 06, 2018
|
|
|
|
Thus far solid market gains in August have not exactly carried over into September. DJIA is a slightly higher, but S&P 500 and NASDAQ are not. Looking back at past strong August performance there is a pattern of below average performance in September. The dividing line for “strong” August performance was drawn at each index’s respective performance this August. For example, any August since 1950 in which DJIA gained 2.2% or more was included. The same dividing line was used for S&P 500 going back to 1950 and NASDAQ since 1971.
![[September Market Performance After Strong August Table]](/UploadedImage/AIN_1018_20180906_Sept-After-Strong-August_Table.jpg)
Looking at the above table, September’s weaker performance following a “strong” August is quite visible. Compared to all Septembers since 1950, DJIA average performance following a “strong” August falls to a 1.2% loss compared to a 0.7% average decline in all Septembers. The frequency of positive Septembers also declines significantly from 39.7% in all Septembers to just 22.2% in Septembers after a “strong” August. S&P 500 and NASDAQ exhibit similar declines in September’s average performance. In the case of a “strong” August, strength does not equal continued strength all that often.
Crude Oil’s Autumn Decline
Seasonally speaking, crude oil tends to make significant price gains in the summer, as vacationers and the annual trek of students returning to college in August creates increased demand for unleaded gasoline. The market can also price in a premium for supply disruptions due to threats of hurricanes in the Gulf of Mexico. However, towards mid-September, we often see a seasonal tendency for prices to peak out, as the driving and hurricane seasons begin to wind down. Crude oil’s seasonal decline is highlighted in yellow in the above chart.
Shorting the February crude oil futures contract in mid-September and holding until on or about December 10 has produced 22 winning trades in the last 35 years. This gives the trade a 62.9% success rate and theoretical total gains of $94,400 per futures contract over the history of this trade. Following four consecutive years of gains, this trade failed to materialize the past two years.
Over the last year, crude oil has enjoyed a solid run beginning just under $50 per barrel early in September 2017 to over $75 per barrel in July of this year. The rise in price has caused an increase in domestic production which is likely to put a cap on further price appreciation. A stronger U.S. dollar could also hinder further gains. Tariffs could also result in lower crude oil prices as growth could be hit. Easing demand and ample supply would suggest lower prices for crude in the near future could be likely.
ProShares UltraShort Bloomberg Crude Oil (SCO) is one vehicle to take advantage of seasonal weakness. SCO’s benchmark is the Bloomberg WTI Crude Oil Sub index which is comprised entirely of crude oil futures contracts. SCO is designed to return 200% of the inverse of the daily move of this index and has nearly $160 million in assets. Its expense ratio of 0.95% is about average for a leveraged, inverse ETF.
Crude oil’s recent weakness has caused a corresponding increase in SCO. As a result, stochastic, relative strength and MACD Buy indicators are all positive. SCO could be bought on dips below $15.55. SCO will be tracked in the Almanac Investor ETF Portfolio. If purchased, an initial stop loss at $14.00 is suggested.
ETF Portfolio Updates
A mild case of end-of-summer/back-to-school blues has cast a shadow over the market this first week of September following an unseasonably strong full-month of August. Technology shares in particular have been hit the hardest. Social media firms like Facebook and Twitter along with the semiconductor sector are amongst the hardest hit. The prospect of another round of tariffs, $200 billion more on China is also looming large over the market. Due to these recent market jitters, defensive bond positions held in the portfolio are again positive. Excluding dividends and any fees, iShares 20+ Year Bond (TLT) was up 0.8% at yesterday’s close. iShares US Aggregate Bond (AGG) was up 0.2%. TLT and AGG are currently on Hold.
Other defensive sector positions are performing even better. SPDR Utilities (XLU) is now up 10.7% and SPDR Consumer Staples (XLP) is up 9.3%. SPDR Healthcare (XLV) and iShares NASDAQ Biotech (IBB) are also performing well. XLV is up an additional 3.9% since last update in early August while IBB added 2.9%. With the exception of IBB, all of these defensive positions are also on Hold.
Short trade positions in SPDR Materials (XLB) and iShares Transports (IYT) are also on Hold. Neither position has been a smashing success yet. XLB is modestly lower than where it was when first shorted for a gain of 1.9% while IYT is higher than when shorted for a loss of 4.0%. Both of these short trades typically last until the middle of October which leaves plenty of time for improvement. Additional tariffs are one possibility that could lead to weakness in the materials and transport sectors.
Last month’s new long trade idea from the High-Tech sector, iShares US Technology (IYW) has not traded below its buy limit. IYW’s buy limit at $179.95 appears to be well below its current price, but IYW has declined as much as $6.25 over the last two trading sessions. A few more days of similar declines is all it would take to reach the buy limit.
Please see table below for current advice and stop losses.