|
Market at a Glance - 9/29/2022
|
|
By:
Christopher Mistal
|
September 29, 2022
|
|
|
|
9/29/2022: Dow 29225.61 | S&P 3640.47 | NASDAQ 10737.51 | Russell 2K 1674.93 | NYSE 13607.72 | Value Line Arith 7755.82
Seasonal: Improving. October is the last month of DJIA and S&P 500 “Worst Six Months” and NASDAQ’s “Worst Four Months.” Twelve post-WWII bear markets have ended in October and seven were in midterm years. October is the #1 DJIA and S&P 500 month in midterm years, #3 for NASDAQ. Our Seasonal MACD Buy signal can trigger any time after the close on October 3 this year.
Fundamental: Recession? One bright spot is the labor market where official metrics remain reasonably firm. GDP was negative in Q1 and Q2 and the Atlanta Fed GDPNow estimate for Q3 is just 0.3% as of its September 27 update. Surging mortgage rates are cooling the housing market and price declines are popping up. Consumer sentiment remains depressed as inflation and Fed rate hikes eat away at spending power. Energy prices have retreated but remain elevated while corporate earnings are slipping with several notable warnings from FedEx, GE, and Ford.
Technical: New Lows. DJIA and S&P 500 have closed below their respective June lows. NASDAQ and Russell 2000 have not. The bear market is not over yet. 50- and 200-day moving averages are all in decline and remain distant. The market’s next move will likely depend on where NASDAQ goes. If its June closing low holds, that would be a positive and encouraging. However, if the opposite occurs then further declines are increasingly likely.
Monetary: 3.00 – 3.25%. Persistent inflation has pushed the Fed to take aggressive action. A blunt speech by Chairman Powell at Jackson Hole was the first warning to the market and last week’s meeting solidified their intentions. The Fed increased its key rate by 0.75% and indicated similar sized increases are likely at its next two meetings. Their apparent objective, based upon projection materials, is to have the fed funds rate between 4% and 4.5% by the end of this year. The brisk pace of rate increases compared to other major central banks has the U.S. dollar at multi-year highs and Forex market volatility climbing. The Fed may soon need to intervene in Forex markets.
Sentiment: Slipping. According to
Investor’s Intelligence Advisors Sentiment survey Bullish advisors stand at 25.4%. Correction advisors are at 40.3% while Bearish advisors numbered 34.3% as of their September 28 release. Sentiment has been mixed and largely responding to the markets moves. Bullish advisors peaked in mid-August just as the market was topping out. When they bailed on the bullish camp then went to join correction advisors. More bearish advisors would be a welcome sign as historically the best broad opportunities for new long positions have been at higher levels.
|
October Outlook: Bear-Killer and Bargain Month
|
|
By:
Jeffrey A. Hirsch & Christopher Mistal
|
September 29, 2022
|
|
|
|
We coined the term “bear-killer” for October way back in 1968 in the 1969 Stock Trader’s Almanac, the second edition. The original theory from the 1969 Almanac still holds water.
October has been the big bargain month of the post-World War II era. Its chief asset is its enviable position in the calendar. It falls in front of the most bullish three-month span of the year (November, December and January). At this time, volume picks up considerably and there is a great seasonal demand for stocks.
The annual surge of investment funds into the market has helped stem the tide of major bear markets enabling October to become the “bear-killer.” In addition, so many stalled bull markets seem to get moving again during this month. Twelve post-WWII bear markets have ended in October: 1946, 1957, 1960, 1962, 1966, 1974, 1987, 1990, 1998, 2001, 2002 and 2011 (S&P 500 declined 19.4%). Seven of these years were midterm bottoms.
Amazing how little this has changed in 54 years despite the many systemic changes to the market, technological advances and shifts in collective human behavior and behavioral advance. The negative seasonality in September and volatility in October that creates “Octoberphobia” and turned October into a “bear-killer” comes from fund tax selling, end of Q3 window dressing and portfolio restructuring.
Down YTD Q3
S&P 500 is down -23.9% year-to-date at the close of the market today. With one day left in September S&P 500 is on the brink of the 4th worst YTD Q3 performance since 1930. In the table here we show the record of the previous 23 years since WWII (1946) when S&P 500 was down for the year at the end of Q3.
In all 23 years the following Q4 was up 69.6 % of the time for an average gain of 3.1%. Subsequent Q1s were up only 52.2% of the time for an average gain of 2.7%. The following Q2s gained ground 65.2% of the time for an average gain of 2.9% and then next years were up 73.9% of the time for an average gain of 11.9%.
But the record for midterm years down at the end of Q3 is better. Of those nine midterm years highlighted in blue in the table only 1946 into 1947 had no bounce with 1947 closing exactly at the same price as 1946 for S&P. Overall, Q4s were up 88.9% of the time, average gain 7.6%, Q1s up 77.8% of the time, average gain 6.7%, Q2 up 77.8% of the time, average gain 4.6% and next years up 88.9% of the time, average gain 19.2%.
So, while things look grim out there on Wall Street, economically and globally, odds are we are nearing a bottom and the prospects for Q4 and next year are encouraging, at least historically, seasonally and 4-year cycle-wise. But there is still a lot that needs to go right, and the market likely has further downside left.
We have shared several analog charts to 2022 this year, but the one that stands out to us now after taking out the June lows on DJIA and S&P 500 is the New Democratic President Midterm Year analog. The chart suggests that after a bit of a rebound in mid-October the market will make a lower low at the midterm bear market bottom toward the end of October.
While we are all anxious for this bear to run its course and for our next Best Months Seasonal MACD Buy Signal, patience and prudence is in order. As September delivered on its historic weakness October promises to present its usual volatility. Our MACD Buy Signal has come as early as October 1, though that does not appear likely this year, and as late as mid-December.
So, we stick to the plan, sit tight, adhere to the strategies and analysis that have helped us avoid most of the carnage this year and wait for the indicators to signal when we re-enter the market during the Sweet Spot and do our best to capitalize on the best time to buy stocks in the 4-year cycle.
Pulse of the Market
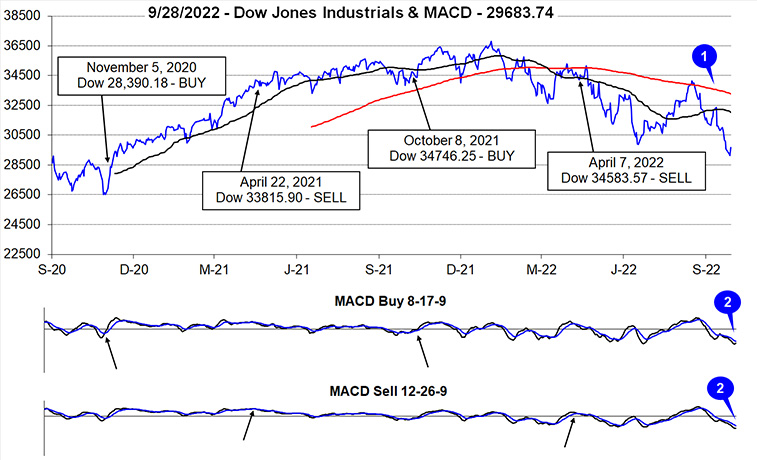
Following an above average summer rally, DJIA slipped into the usual fall slump in mid-August. From DJIA’s closing high on August 16 through yesterday’s close (September 28), it declined 13.1%. This year’s fall slump is already worse than the average going back to 1964 of –8.8%. DJIA has fallen back below its 50-day moving average (1) and closed below its June closing low. Recent weakness has kept both the faster and slower MACD indicators applied to DJIA negative and trending lower (2). Historically, the further below the zero-line MACD goes, the more reliable the subsequent signals have been. This suggests MACD is potentially setting up for a solid, seasonal signal.
This week’s trading kicked off with DJIA’s thirteenth Down Friday/Down Monday (DF/DM) of the year (3). For the most part, DF/DM occurrences this year have proceeded further declines and higher levels of volatility. Timing has varied throughout the year with little wait this time. Prior to this week’s DF/DM, DJIA registered three in a row beginning in August. Clusters like this and the high number (13) registered so far in 2022 are emblematic of bear markets (2022 Stock Trader’s Almanac page 78) while the recent one serves as a good reminder that the bear is not over with yet.
DJIA, S&P 500 (4) and NASDAQ (5) have all been down in five of the last six weeks. Barring a late day/week reversal all three are currently on track to add yet another losing week to the current streak. Like DJIA, S&P 500 has closed below its June closing low which confirms the bear market has not come to an end yet. NASDAQ (and Russell 2000) is on the cusp of closing below it June closing low.
NYSE Weekly Advancers and Weekly Decliners (6) have been consistent with the market’s overall move lower and suggest there has been relatively broad participation in the sell off with Decliners solidly outnumbering Advancers in negative weeks. Last week’s nearly 8 to 1 ratio of Weekly Decliners to Weekly Advancers was only slightly less than what occurred during the week ending June 17. Unlike back in June, the market has not responded with a bullish jump higher this week.
Weekly New Highs (7) have remained minuscule over the last five weeks while Weekly New Lows rapidly expanded. This is yet another confirming sign of the market’s troubles and lingering recession/Fed concerns. Even after jumping to 1241, last week New Weekly Lows remain well below levels observed at or near past significant market lows.
Treasury yields (8) continued to climber higher throughout the month. The 90-day Treasury rate has gone from essentially zero at the start of the year to 3.21%, as a result mortgage demand is falling, and signs of housing market weakness continue to accrue. Higher Treasury rates are also pushing the U.S. dollar to multi-decade highs. Historically, a stronger dollar has been a headwind to earnings for large, multi-national corporations that make up the majority of the market indexes.
|
October 2022 Almanac & Vital Stats: Top Month in Midterm Years
|
|
By:
Jeffrey A. Hirsch & Christopher Mistal
|
September 22, 2022
|
|
|
|
October can evoke fear on Wall Street as memories are stirred of crashes in 1929, 1987, the 554-point DJIA drop on October 27, 1997, back-to-back massacres in 1978 and 1979, Friday the 13th in 1989 and the 733-point DJIA drop on October 15, 2008. During the week ending October 10, 2008, DJIA lost 1,874.19 points (18.2%), the worst weekly decline, in percentage terms, in our database going back to 1901. March 2020 now holds the dubious honor of producing the largest and third largest DJIA weekly point declines. The term “Octoberphobia” has been used to describe the phenomenon of major market drops occurring during the month. Market calamities can become a self-fulfilling prophecy, so stay on the lookout and don’t get whipsawed if it happens.
October has been a turnaround month—a “bear killer” if you will. Twelve post-WWII bear markets have ended in October: 1946, 1957, 1960, 1962, 1966, 1974, 1987, 1990, 1998, 2001, 2002 and 2011 (S&P 500 declined 19.4%). Seven of these years were midterm bottoms.
Over the last twenty-one years, the full month of October has been a solid month for the market, ranking #3 for DJIA, S&P 500 and NASDAQ. DJIA, S&P 500, NASDAQ, Russell 1000 and Russell 2000 have all recorded gains ranging from 1.0% by Russell 2000 to 2.7% by NASDAQ. But these gains have come with volatile trading, most notably during the early days of the month. October has opened softly with modest average gains on its first trading day by DJIA, S&P 500, NASDAQ and Russell 1000. On the second day, all five indexes have been weak followed by a rebound on the third trading day before additional weakness pulls the market lower through the seventh trading day. At which point, the market has historically found support and begins to rally through mid-month and beyond.
![[October 21-Yr Seasonal Patterns Chart]](/UploadedImage/AIN_1022_20220922_October_21yr_seasonal.jpg)
Midterm-election-year Octobers are downright stellar thanks to the major turnarounds mentioned above; ranking number one on the DJIA, S&P 500 and Russell 1000. Midterm October is NASDAQ’s second-best month and Russell 2000’s third best. This is usually where the
“Sweet Spot” of the four-year-presidential-election-cycle begins. The fourth quarter of the midterm years combines with the first and second quarters of the pre-election years for the best three consecutive quarter span for the market, averaging 19.3% for the DJIA and 20.0% for the S&P 500 (since 1949), and an amazing 29.3% for NASDAQ (since 1971).
![[Midterm October Performance Mini Table]](/UploadedImage/AIN_1022_20220922_October_2022_midterm_stats_mini_table.jpg)
Options expiration week in October provides plenty of opportunity. On the Monday before monthly expiration DJIA has only been down 10 times since 1982 and the Russell 2000 is up twenty-three of the last thirty-two years, seventeen straight from 1990 to 2006. Expiration day has a mixed record while the week as a whole has been improving with S&P 500 recording seven straight weekly advances coming into this year. After a market bottom in October, the week after is most bullish, otherwise it is susceptible to downdrafts.
October is also the end of the Dow and S&P 500 “Worst 6 Months” and NASDAQ “Worst 4 Months”. Remain attentive for our Seasonal MACD Buy Signal which can occur anytime beginning October 3 (the first trading day of the month this year). An email Alert will be sent when it triggers.
|
October 2022 Strategy Calendar
|
|
By:
Christopher Mistal
|
September 22, 2022
|
|
|
|
|
Mid-September Update: Prepping for Best Six Months & Looking for Bottom
|
|
By:
Jeffrey A. Hirsch & Christopher Mistal
|
September 15, 2022
|
|
|
|
Before jumping into today’s update, please take a moment and register for our member’s only webinar, 2022 Q3 Outlook: Profits, Politics, Prices, Powell, and Putin on Wednesday September 21, 2022, at 1:00 PM EDT here:
Heading into the end of Q3 2022 several issues remain paramount on investors’ minds as we all adjust our portfolios along with fund managers for yearend and 2023. Join us for this Almanac Investor Member’s Only discussion with plenty of time for Q & A. After we share our outlook, we will open the room up to questions from you our most loyal members and conduct our usual open dialogue on whatever you want to know more about. We will address the prospects for earnings, recession, midterm elections, the Sweet Spot of the 4-Year Cycle, the Best Six Months, sectors, our upcoming seasonal stock basket, inflation, interest rates and the war in Ukraine.
If you are unable to attend the live event, please still register. Within a day of completion we will send out an email with links to access the recording and the slides to everyone that registers.
After registering, you will receive a confirmation email containing information about joining the webinar and a reminder message.
Mid-September Update
As the market struggles during this prototypical seasonal and 4-year cycle weak period fueled by news, data and fear, it is the perfect time to prepare for the Best Six Months and the next bull market we expect to commence in Q4 at the outset of the Sweet Spot of the 4-year cycle. We are reminded of Warren Buffet’s salient words: “Be greedy when others are fearful” – but not so fast.
We included a chart of several midterm year seasonal patterns compared to 2022. In the updated chart here, we stripped out all but one: midterm years under newly elected Democratic Presidents. While 2022 has declined more than the average midterm year under new Democratic Presidents, it has tracked the trend quite closely with an initial June low followed by a summer rally, a mid-August interim high before a late-Q3 selloff. Should this pattern continue, it would culminate in a classic late-October midterm bottom.
This Is Not 2008
There has been quite a bit of chatter lately about 2022’s analog to 2008. As you can see in the chart below 2022 is tracking the course of 2008 rather closely. But it is hard for us to fathom a complete meltdown here in 2022 like we had in 2008 for several reasons. Sure, crypto got whacked and some big tech high-fliers plunged, and we reached official bear market levels, but there have been no major bankruptcies or systemic failures.
By September 2008 Bear Sterns and Lehman Brothers had already gone belly up, the Feds took over Fannie Mae and Freddie Mac, Bank America acquired Merrill Lynch, the Fed took over AIG, the list goes on. The market plummeted as credit markets seized up until the Fed, Treasury and Congress coordinated an infusion of hundreds of billions of dollars to shore up the credit markets in the Emergency Economic Stabilization Act of 2008, which created TARP (Troubled Asset Relief Program) and others.
We have had no major bankruptcies in 2022 and despite a late start with their transition to a tightening policy to quell inflation due to the pandemic, the Fed is finally on top of things. From recent policy actions and commentary it appears they have learned some lessons from Volker, the 2007-2009 Financial Crisis and their 2018 missteps.
But make no mistake about it, the first whiff of real trouble and the Fed probably taps the brakes on rates and QT (quantitative tightening). Case in point the brief window they opened to allow folks to settle Russian bond exposure despite the sanctions. It may have only been $1 billion worth, but there was likely 10x that in liabilities and derivatives. And in reality, the decline has been rather orderly so far.
Put the hyperbole aside. The Fed is not driving a stake through economy — it’s driving a stake through inflation. Yes, volatility is likely to pick up. There will be more big down days before we reach the bottom. It is the most bearish time of the year and the 4-year cycle, and the news flow, incoming data and continuing rate hikes are definitely adding fuel to the fire. We will likely have some sort of recession, considering GDP has already fallen for two straight quarters. Prices are up. Wages prices up. Mortgages rates up, but the job market is still firm.
Midterm Year Bottom Picker’s Paradise
As 2022 unfolds in typical seasonal manner as well as in line with the Weak Spot of the 4-year cycle (Q2-Q3 midterm year), the market is on pace to put in a classic midterm October bottom that ends the bear and begins a new bull market at the outset of the Sweet Spot of the 4-year cycle. Our portfolios have been in mostly cash for months as we honored our stops throughout the early days of the bear market and stuck to our strategies and systems.
With the Fed funds rate set to overcome the previous peak in 2018 when markets were briefly stunned, we must expect or at least be prepared for lower lows. But that should set up a near perfect Best Six Months Seasonal MACD Buy Signal and bull market rally that runs into 2023. But please be patient and wait for the seasonality to come around on the calendar and for our buy signal and other indicators to turn positive.
Sticking to Our Seasonal Trading Playbook
Over the long-term, since 1950, our Best Months Switching Strategy with MACD timing has outperformed the major indexes (pages 56 and 62 of 2022 Almanac). Throughout those 72 years for DJIA and S&P 500 and 51 years for NASDAQ there were periods where the strategy outperformed and periods where it underperformed. The roaring bull market of the nineties was one period were our Switching Strategy lagged as the market generally roared higher all year long. But when that period came to an end, the Switching Strategy reclaimed lost ground as DJIA suffered “Worst Months” declines in seven out of eight years from 1998 to 2005.
Shortly thereafter the credit and housing market bubbles burst triggering the financial crisis of 2008-09 along with the worst bear market and recession since the Great Depression. In response, the Federal government and Fed took then unprecedented actions to support the economy and the market. TARP and massive fiscal stimulus were provided by the government while the Fed cut interest rates to nearly zero and the market and economy began to recover. Quantitative easing by the Fed provided further support and liquidity to the financial system. As a result the market and the economy began to recover, and the market enjoyed well above average gains during the “Worst Months” of 2009.
![[BSM Table]](/UploadedImage/AIN_1022_20220915_Best-Worst_Table_since-2009.jpg)
Since the March 2009 market bottom, the market has enjoyed five periods of outsized gains during the “Worst Months.” The first was 2009; then again in 2010, 2013, 2017 and 2020. ZIRP (zero interest policy) and the recovery from the 2007-2009 Financial Crisis enhanced the Worst Months of 2010, a third round of QE boosted 2013, corporate tax cut anticipation lifted 2017 and the 2020 recovery from the Covid-19 shutdown and massive fiscal spending pumped up 2020. It is primarily these five years and the corresponding one-off events that have resulted in the market outperforming our Seasonal Switching Strategy over the last thirteen years. We are of the opinion that this is an exception, not some kind of new normal where black swan events and major disruptions occur every few years.
Some gains have been left on the table by the Seasonal Switching Strategy; however, this is only part of the bigger picture. The potential benefits of reduced risk have not been fully taken into consideration. Up until this year, NASDAQ has not suffered a single decline during its “Best Months” since 2007 (page 62 2022 STA) and its average gain during its Best Eight Months remains a solid 9.3% after this year’s double-digit loss. 2020’s “Best Months” declines by DJIA and S&P 500 were their first since 2008. While this year’s Seasonal Sell signal for DJIA and S&P 500 in April was essentially a wash, it did sidestep a portion of this year’s declines.
Looking back at the history of the Seasonal Switching Strategy in the 2022 Almanac, we see numerous years of success during the elevated inflation periods in the 1970s through the early 1980s. The record is not perfect, but the majority of market declines then were during the “Worst Months” and the majority of gains were in the “Best Months.” As we head toward the Sweet Spot of the four-year cycle, our Seasonal Switching Strategy does appear well positioned to deliver once again.
Seasonal MACD Buy Signal Update & Methodology
We are not issuing a signal now. On October 3, the first trading day of the month this year, the window for issuing our Seasonal MACD Buy signal will open. Using our pre-defined MACD parameters for our Seasonal Buy Signal of 8-17-9 we can see in the above charts that MACD has been trending lower since mid-August other than a quick blip positive last week. Generally, the deeper below the zero-line MACD is the more reliable the subsequent crossover signal tends to be.
As a reminder, the criteria to issue our Seasonal MACD Buy Signal is a new MACD crossover on or after October 3 from DJIA, S&P 500 and NASDAQ and all three indexes must agree. When all criteria have been met, we will send an email Alert.
In addition to our Seasonal Switching Strategy, we will also look to send our Seasonal Sector ETF basket in early October targeting the sectors with the highest frequency and gain magnitude during the upcoming “Best Months” period. We also anticipate putting cash in the stock portfolio back to work with a basket of undervalued and off-the-radar stocks that we believe could deliver above average price appreciation.
|
Market & Stock Portfolio Updates: DF/DM Cluster Jitters
|
|
By:
Christopher Mistal
|
September 08, 2022
|
|
|
|
Earlier this week, DJIA recorded its twelfth Down Friday/Down Monday (DF/DM) occurrence of the year. In the case of DF/DM’s Monday always refers to the first trading day of the week and Friday refers to the last trading day of the week when ever Monday or Friday is a holiday. Historically, DF/DM’s have occurred at market inflection points and have been a reliable indicator of a shift in market sentiment. When traders are reluctant and they close out long positions before the weekend and then fail to buy at the start of the next week, the market’s current trend is usually being closely evaluated. As noted on page 78 of the 2022 Almanac, DF/DM’s tend to be most prevalent and damaging in bear market years.
The recent DF/DM was rather unique in it was also the third consecutive occurrence. Going back to 1953, the first full year that did not have Saturday trading, there have only been 40 other times where there were three or more DF/DM’s in a row. The longest streak was six beginning January 4 through February 11, 1957, in which DJIA declined 8.2% from the first Friday’s close to the last Monday’s close. For the full year, DJIA was down a modest 12.8%. A mild bear began in April of 1956 and ended in October 1957 and a recession occurred from August 1957 to April 1958.
![[DJIA Performance Before & After 3 or More DF/DM’s]](/UploadedImage/AIN_1022_20220908_DFDM-3_b4&after_Chart.jpg)
In the above chart we have plotted the 30 trading days before and 60 trading days after all 40 previous three in a row or more DF/DM’s since 1953. On average the majority of DJIA’s declines have transpired as the DF/DM’s were taking place. Differences emerge once the streak has come to an end. The most bearish scenario was when Monday’s close was never recovered during the next seven calendar days. This occurred nine times and is represented by the red line labeled “No Bounce.” The most bullish scenario happened eight times and is represented by the green line called “Monday Holds.” In this situation, DJIA quickly reversed course and continued to climb higher over the next week. However, there were also 23 times where DJIA moved higher initially only to eventually lose momentum and turn lower again (purple line, “Bounce & Monday Broken”).
![[DF/DM Cluster Table]](/UploadedImage/AIN_1022_20220908_DFDM-3_performance_table.jpg)
Here in this table we have compiled DJIA’s performance at various fixed time points after the last DF/DM Monday. On average, 1-, 3-, and 6-month after performance was meager and generally disappointing, but by 1-year later it did improve. One month after, DJIA was higher on average by 0.94%, but advanced only 47.5% of the time. At three months, the frequency of gains improves to 60.0%, but average performance was 1.66%. At six months, DJIA was higher 50.0% of the time and at the 1-year mark it was up 75.0% of the time with a respectable 10.47% average gain.
A definitive conclusion based solely upon DJIA’s recent cluster of three DF/DM’s is challenging based upon the broad historical results. However, when it is factored into the overall picture it does appear to be indicative of the elevated levels of uncertainty that the market is currently contending with. Historically, DF/DM’s have a bearish bias sometime during the next 90 calendar days. This is consistent with our current outlook. We continue to anticipate the market to continue to trade choppily through the balance of September and possibly into early Q4. Once Q4 begins we will look to our Seasonal MACD indicator to aid in signaling when the “Sweet Spot” of the four-year-cycle has begun.
Stock Portfolio Updates
Over the last four weeks since last update through today’s close, S&P 500 retreated 4.8% while Russell 2000 fell 6.2%. Over the same time period the entire stock portfolio slipped 0.3% lower, excluding dividends and any fees. The portfolio’s cash balance remains high at a little over 86% of the total hypothetical value. As it has done for much of this year, the cash has mitigated the impacts of broad market declines.
Outside of the Large-cap portion of the portfolio, positions actually performed well. MGP Ingredients (MGPI) had another solid four-week period and lifted Small-cap positions 2.4% since last update. With today’s gains, MGPI is a mere $0.28 from its 52-week high reached on August 17. MGPI is on Hold.
Our single remaining position in the Mid-cap portfolio, Black Hills (BKH) did not participate in today’s gains, but it did advance 0.7% over the last four weeks as the market weakened again. BKH may be just a dull Utility-sector stock, but it is positive year-to-date and continues to pay a respectable dividend. BKH is on Hold.
Three of four Large-cap positions declined since last update. Southern Company (SO) was the only position to advance. The biggest loser was AT&T (T). Challenges persist for T, but it continues to pay a solid dividend and it will likely find support and climb higher when broader market sentiment begins to improve.
All positions are on Hold. Please see the table below for updated stop losses and current advice for positions not covered above.
|
ETF Trades & Updates: Crude’s Seasonal Slump
|
|
By:
Christopher Mistal
|
September 01, 2022
|
|
|
|
In a typical year, crude oil tends to make significant price gains in the summer, as vacationers and the annual trek of students returning to college in August creates increased demand for unleaded gasoline. The market can also price in a premium for supply disruptions due to threats of hurricanes in the Gulf of Mexico. However, towards mid-September, we often see a seasonal tendency for prices to soften, as the driving and hurricane seasons begin to wind down. Crude oil’s seasonal decline is highlighted by the black arrow in the following chart.
![[Crude Oil (CL) Weekly Bars and Seasonal Trend Chart (Weekly Data Aug 2021 – September 1, 2022)]](/UploadedImage/AIN_1022_20220901_CL_Seasonal_Chart.jpg)
Last year this trade did not work out all that well as seasonal weakness did not materialize until late-October and only briefly lasted through November and into the beginning of December. From its December low, crude oil went essentially straight up through winter and spiked higher when western sanctions began impacting Russian supplies in March. Crude did however reach a typical seasonal peak in early July this year and has been steadily retreating since then. Higher prices have caused demand to ease. Seemingly never ending Covid lockdowns in China are also weighing on demand.
Potential profit on this trade appears to be limited as global supplies remain tight, but higher prices have eroded demand and global economic growth is slowing. Fresh new Covid-19 lockdowns in China could also further depress demand in the near-term. Should the U.S. labor market begin to show signs of weakening, crude oil could slip even lower as recession concerns would likely expand.
ProShares UltraShort Bloomberg Crude Oil (SCO) is one vehicle to take advantage of crude’s historical seasonal weakness. SCO’s benchmark is the Bloomberg Commodity Balanced WTI Crude Oil index which is comprised of crude oil futures contracts. SCO is designed to return 200% of the inverse of the daily move of this index and has around $500 million in assets. Its expense ratio of 0.95% is about average for a leveraged, inverse ETF.
Crude oil’s retreat since its July peak has caused a corresponding increase in SCO. Currently crude oil has weakened modestly and stochastic, relative strength and MACD Buy indicators applied to SCO have begun to improve. SCO could be considered on dips below a buy limit of $24.00. SCO will be tracked in the Almanac Investor Sector Rotation ETF Portfolio. If purchased, an initial stop loss at $21.40 is suggested.
Sector Rotation ETF Portfolio Updates
Broad market strength in the first half of August was trouble for short positions in iShares Transportation (IYT) and SPDR Industrials (XLI). IYT and XLI both managed to breakout above projected resistance and both positions closed above their respective stop losses on August 10. As a result, IYT and XLI short positions have been covered and closed out of the portfolio for a loss. Recent declines by IYT and XLI have returned both to approximately the same level that they were initially shorted at. Even though historical seasonal weakness does last until October, we will move on.
Two out of three of last month’s new trade ideas have been added to the portfolio. iShares US Technology (IYW) was added on August 29 when it first traded below its buy limit. iShares Semiconductor (SOXX) was shorted on August 9 as it broke down through support at $400. As of yesterday’s close, IYW was modestly lower, off 2.3% while the short position in SOXX was up by 7.6%. Today’s newly announced semiconductor sales restrictions to China has pushed SOXX even lower. IYW and SOXX are on Hold.
The third new trade idea from last month, iShares Biotech (IBB) has yet to trade below its buy limit. SPDR S&P Biotech (XBI) also did not dip below its buy limit over the past four weeks. IBB and XBI can still be considered on dips below their respective buy limits.
Tactical Seasonal Switching ETF Portfolio Update
The second month of the worst two-month span (August-September) has arrived. September had gotten off to a rather typical mixed start. After spending much of today in the red, DJIA and S&P 500 managed to rally and close with modest gains today. NASDAQ’s rebound was insufficient as it still booked a mild loss today. As a reminder, September has historically been the worst month of the year for the market since 1950 and midterm-election-year forces have only had limited effect on past Septembers. Even though the market has enjoyed a solid summer rally this year, it is not impervious to renewed weakness, correction or even another sizable one-day selloff.
Defensive, “Worst Months” positions in the portfolio have taken some punishment in recent weeks. All three bond ETFs are lower as the bond market continues to price in the Fed’s rate tightening pace and magnitude. iShares 20+ year Treasury bond is the worst performing of the group, off 10.6%. AGG and BND are also modestly lower excluding dividends and trading costs. Continue to Hold TLT, AGG and BND. As a reminder these bond positions are partial positions as we were anticipating some bond weakness during the current “Worst Months” period due to the Fed tightening that is currently underway. Cash continues to be the lowest risk position.