|
Market at a Glance - 10/31/2019
|
|
By:
Christopher Mistal
|
October 31, 2019
|
|
|
|
10/31/2019: Dow 27046.23 | S&P 3037.56 | NASDAQ 8292.36 | Russell 2K 1562.45 | NYSE 13171.81 | Value Line Arith 6252.32
Fundamental: Soft. Q3 U.S. GDP came in at 1.9% which was better than expected. This confirms that the pace of growth has slowed, and it confirms that the economy is still growing. Broadly, corporate earnings for Q3 have been better than forecast even though they could still show a year-over-year decline once earnings season ends. Employment remains firm with continued gains, but the pace of gains has slowed.
Technical: New Highs. S&P 500 logged two new all-time closing highs this week. DJIA and NASDAQ are lagging. Positive cumulative advance/decline lines and a series of higher lows support the case for a possible breakout in the near future.
Monetary: 1.50-1.75%. The Fed cut rates by 0.25% at its October meeting and signaled that this may be the last cut unless there is a material change in their outlook. As a result, the odds of a December cut have fallen over the past week. The Fed does appear ready, willing and able to respond should conditions weaken further.
Seasonal: Bullish. November is the first month of the “Best Months.” November is also the first month of the best three consecutive month span, November through January. Since 1950, November is the best month of the year for S&P 500 and second best for DJIA and NASDAQ. However, November has been weaker in pre-election years.
Psychological: Optimistic. According to
Investor’s Intelligence Advisors Sentiment survey, bulls are at 54.2%. Correction advisors are now at 28.0% and Bearish advisors are just 17.8%. Overall sentiment has improved for three weeks in a row after a brief retreat in response to market weakness in late September. With the holiday season rapidly approaching, it is not uncommon for sentiment to rise and remain elevated as expectations for a yearend rally and a new year build. If sentiment begins to retreat, it would be worrisome.
|
November Outlook: Best Six Months Underway
|
|
By:
Jeffrey A. Hirsch & Christopher Mistal
|
October 31, 2019
|
|
|
|
Despite a scary trading day today spooked by the latest trade and impeachment fears, the market has been rising steadily since our October 11 Seasonal Best Six Months MACD Buy Signal. Our defensive positions did well while the market gained little ground from our May 1st Sell Signal until our October 11 Buy Signal. We have now fully deployed for the Best Six Month with new positions in the
major market ETFs, Sector ETFs and a
brand new stock basket rich in undervalued growth stocks under Wall Street’s radar.
Now that we’ve survived Octoberphobia and the market has begun to strengthen again, breaking out above support and logging new highs on the S&P 500, we are likely to experience a bit of consolidation in November. Normally the top S&P month of the year and #2 for DJIA, NASDAQ and the Russell 2000, November is considerably weaker in Pre-Election Years.
As you can see in the updated chart of Pre-Election Year Seasonal Patterns overlaid with 2019 we have been tracking all year November tends to be flat in the Pre-Election Year with a pop around Thanksgiving. Then after the usual first half of December softness the market tends to push toward additional new highs near yearend. Considering the banner performance so far this year and the uncanny tracking of this historical seasonal pattern, we expect the stock to consolidate over the next few weeks and then resume the march to new highs.
Technically, the market has a little work to do here to convert the old highs and resistance levels we
discussed two weeks ago into support before we can comfortably move to new higher highs. Fundamentals are also encouraging with Q3 GDP and earnings numbers coming in better than expected, jobs data remaining strong and an accommodative Fed that appears to have effectively lowered rates in a mid-cycle adjustment.
Market internals have also improved and most encouraging is the rising Advance-Decline Lines. Broad market participation is apparent in this chart of the S&P 500 in black, DJIA in green, NASDAQ in blue and the Russell 2000 in pink with their respective A/D Lines in the lower panes. For better perspective we’ve included the NYSE Composite A/D line in green instead of DJIA. S&P’s A/D Line leaves a little to be desired as it is not rising as steeply as the others.
So we have the Fed Put firmly underneath the market now after their relatively successful mid-cycle adjustment, seasonals and the 4-year election cycle at our backs, better than expected fundamentals, positive technicals and rising sentiment. The news on the impeachment proceedings and logistical snafus with phase one of the China trade deal are hanging over the market right now.
Expect the market to mark time as it often does in November of the Pre-Election as it digests the latest geopolitical machinations, before it makes a move at more new highs toward yearend.
Pulse of the Market
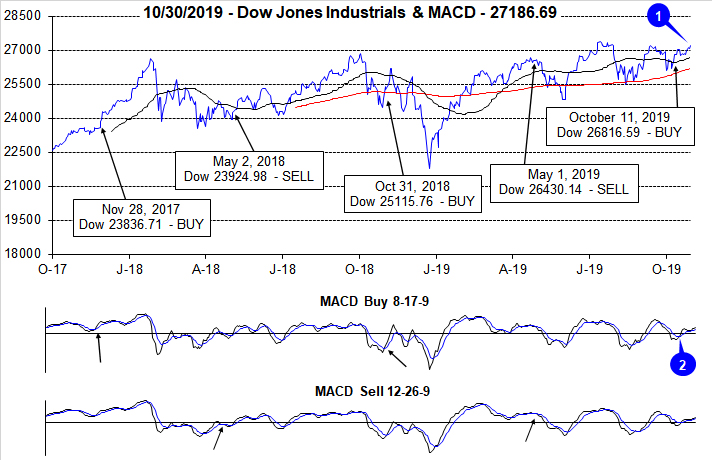
On October 11, faster moving MACD indicators applied to DJIA (2), S&P 500 and NASDAQ all turned positive and our Seasonal MACD Buy Signal was triggered. This marked an early beginning to the “Best Six Months” for DJIA and S&P 500 and the “Best Eight Months” for NASDAQ. DJIA logged just a 1.5% gain during this year’s “Worst Months.” At yesterday’s close, DJIA was back above 27,000 and with 172.47 points of its previous all-time closing high (1). S&P 500 did close at new all-time highs twice, earlier this week. NASDAQ was also closing in on its previous record close.
The markets path back towards its old highs has been choppy. After four straight weeks of declines beginning in late July through most of August, DJIA has been up five of the last nine weeks (3). S&P 500 (4) has accumulated six advancing weeks over the same period while NASDAQ has logged seven weekly advances (5). Fresh trade and impeachment concerns are pressuring the market today and could end NASDAQ’s weekly winning streak.
Market breadth measured by NYSE Weekly Advancers and NYSE Weekly Decliners (6) was positive for three weeks straight with Advancers enjoying the largest margin last week. This trend did produce new S&P 500 highs this week but is currently in danger of being broken. Another brief period of consolidation may be needed before the market can mount its next assault at new highs.
Weekly New Highs and Lows (7) exhibited positive and bullish behavior throughout most of October. New Highs slowly expanded over the last four weeks while New Lows shrunk modestly. This week’s choppy trading could also end this trend.
Fed rate cuts have succeeded in pulling down the 90-day Treasury rate while the 30-year Treasury rate (8) appears to be settling around 2.25% Both rates are significantly lower now than they were last December. Low rates have been a positive for stocks and consumers alike. Interest rates may not be at historic lows, they are still very low.
|
November Almanac: A Top Month in Most Years
|
|
By:
Jeffrey A. Hirsch & Christopher Mistal
|
October 24, 2019
|
|
|
|
November maintains its status among the top performing months as fourth-quarter cash inflows from institutions drive November to lead the best consecutive three-month span November-January. However, the month has taken hits during bear markets and November 2000, down –22.9% (undecided election and a nascent bear), was NASDAQ’s second worst month on record—only October 1987 was worse.
November begins the “Best Six Months” for the DJIA and S&P 500, and the “Best Eight Months” for NASDAQ. Small caps come into favor during November, but don’t really take off until the last two weeks of the year. November is the number-two DJIA (since 1950), NASDAQ (since 1971) and Russell 2000 (since 1979) month. November is best for S&P 500 (since 1950) and Russell 1000’s (since 1979).
In pre-election years, November’s performance is noticeably weaker. DJIA has advanced in nine of the last 17 pre-election years since 1950 with an average gain of 0.3%. S&P 500 has been up in 10 of the past 17 pre-election years, also gaining on average a rather paltry 0.3%. Small-caps and techs perform better with Russell 2000 climbing in 6 of the past 10 pre-election years, averaging 1.2%. NASDAQ has been up in 7 of the last 12 pre-election year Novembers with an average 0.9% gain. Contributing to pre-election year November’s weaker performance are nasty declines in 1987, 1991 and 2007
![[Pre-Election Year November Performance Table]](/UploadedImage/AIN_1119_20191024_Pre-elec_November_mini_table.jpg)
Options expiration often coincides with the week before Thanksgiving. 2019 is an infrequent exception as November begins on Friday this year. DJIA posted ten straight gains 1993-2002 and has been up 19 of the last 26 weeks before Thanksgiving. The Monday of expiration week has been streaky, but the net result since 1994 is 15 DJIA gains in 25 years with 10 advances occurring in the last 15 years. Options expiration day has a clearly bullish bias, up 13 of the last 17. The week after expiration has been a mixed bag recently. DJIA has been up five of the last seven after being down five of six from 2006 to 2011.
Being a bullish month November has five bullish days, though it does have weak points. NASDAQ and Russell 2000 exhibit the greatest strength at the beginning and end of November. Russell 2000 is notably bearish on the 12th trading day of the month, the small-cap benchmark has risen just eight times in the last 35 years (since 1984). The Russell 2000’s average decline is 0.40% on the day. Recent weakness around Thanksgiving has shifted DJIA and S&P 500 strength to mirror that of NASDAQ and Russell 2000 with the majority of bullish days at the beginning and end of the month. The best way to trade Thanksgiving is to go long into weakness the week before the holiday and exit into strength just before or after.
| November (1950-2018) |
| |
DJI |
SP500 |
NASDAQ |
Russell
1K |
Russell 2K |
| Rank |
|
2 |
|
1 |
|
2 |
|
1 |
|
2 |
| #
Up |
|
47 |
|
47 |
|
33 |
|
30 |
|
27 |
| #
Down |
|
22 |
|
22 |
|
15 |
|
10 |
|
13 |
| Average
% |
|
1.6 |
|
1.6 |
|
1.6 |
|
1.7 |
|
2.0 |
| 4-Year Presidential Election Cycle Performance
by % |
| Post-Election |
|
1.9 |
|
1.8 |
|
2.4 |
|
3.7 |
|
2.8 |
| Mid-Term |
|
2.5 |
|
2.6 |
|
3.5 |
|
2.6 |
|
3.3 |
| Pre-Election |
|
0.3 |
|
0.3 |
|
0.9 |
|
-0.2 |
|
1.2 |
| Election |
|
1.7 |
|
1.5 |
|
-0.3 |
|
0.8 |
|
1.0 |
| Best & Worst November by % |
| Best |
1962 |
10.1 |
1980 |
10.2 |
2001 |
14.2 |
1980 |
10.1 |
2016 |
11.0 |
| Worst |
1973 |
-14.0 |
1973 |
-11.4 |
2000 |
-22.9 |
2000 |
-9.3 |
2008 |
-12.0 |
| November Weeks by % |
| Best |
11/28/08 |
9.7 |
11/28/08 |
12.0 |
11/28/08 |
10.9 |
11/28/08 |
12.5 |
11/28/08 |
16.4 |
| Worst |
11/21/08 |
-5.3 |
12/21/08 |
-8.4 |
11/10/00 |
-12.2 |
11/21/08 |
-8.8 |
11/21/08 |
-11.0 |
| November Days by % |
| Best |
11/13/08 |
6.7 |
11/13/08 |
6.9 |
11/13/08 |
6.5 |
11/13/08 |
7.0 |
11/13/08 |
8.5 |
| Worst |
11/20/08 |
-5.6 |
11/20/08 |
-6.7 |
11/19/08 |
-6.5 |
11/20/08 |
-6.9 |
11/19/08 |
-7.9 |
| First Trading Day of Expiration Week: 1990-2018 |
| #Up-#Down |
|
16-13 |
|
13-16 |
|
13-16 |
|
15-14 |
|
15-14 |
| Streak |
|
D1 |
|
D1 |
|
D1 |
|
D1 |
|
D2 |
| Avg
% |
|
-0.05 |
|
-0.1 |
|
-0.2 |
|
-0.1 |
|
-0.03 |
| Options Expiration Day: 1990-2018 |
| #Up-#Down |
|
20-9 |
|
18-11 |
|
13-16 |
|
18-11 |
|
16-13 |
| Streak |
|
U1 |
|
U1 |
|
D3 |
|
U1 |
|
U9 |
| Avg
% |
|
0.3 |
|
0.2 |
|
0.001 |
|
0.2 |
|
0.2 |
| Options Expiration Week: 1990-2018 |
| #Up-#Down |
|
20-9 |
|
18-11 |
|
17-12 |
|
17-12 |
|
16-13 |
| Streak |
|
D2 |
|
D2 |
|
D1 |
|
D2 |
|
D1 |
| Avg
% |
|
0.4 |
|
0.2 |
|
0.2 |
|
0.1 |
|
-0.02 |
| Week After Options Expiration: 1990-2018 |
| #Up-#Down |
|
15-14 |
|
17-12 |
|
19-10 |
|
17-12 |
|
18-11 |
| Streak |
|
D1 |
|
D1 |
|
D1 |
|
D1 |
|
D1 |
| Avg
% |
|
0.4 |
|
0.5 |
|
0.7 |
|
0.5 |
|
0.8 |
| November 2019 Bullish Days: Data 1998-2018 |
| |
5-7,
13, 15, 21 |
4-6,
25, 27 |
1,
5-7, 13, 21 |
1,
5, 6, 15, 22 |
4, 6, 7, 12, 21 |
| |
22,
25-27 |
|
22,
25, 27 |
25-27 |
22, 26, 27 |
| November 2019 Bearish Days: Data 1998-2018 |
| |
11,
12 |
11,
29 |
11 |
11 |
11, 14, 18 |
| |
|
|
|
|
|
|
November 2019 Strategy Calendar
|
|
By:
Christopher Mistal
|
October 24, 2019
|
|
|
|
|
Mid-Month Update & Outlook: October Strikes Again
|
|
By:
Jeffrey A. Hirsch
|
October 17, 2019
|
|
|
|
Our Best Six Months MACD Buy Signal that triggered last Friday, October 11th, initially appears to be timely.
Friday’s Alert detailed several trades that were deployed Monday and updated in a
follow up Alert on Monday. In addition to the Seasonal Sector ETF trades and the Tactical Seasonal Switching Strategy Portfolio trades in DIA, SPY, QQQ and IWM we are releasing a
New October Stock Basket today!
As you can see in the chart below of the S&P 500 the MACD “Buy” indicator trigger in the lower pane, highlighted in the yellow box with the black arrow, came in strong below the zero line. In the upper pane resistance at 3010 still persists. Aside from this resistance technically things look encouraging. We held support last August above 2815 and have been making higher lows since then, riding the 200-day moving average higher. The 50-day moving average has also constructively turned higher.
I have also updated the Pulse of the Market below. Monday’s DJIA gain (1) on top of Friday’s 1.2% gain shows continuing market support after the trade-news driven gain Friday. Tech-stock support was also prevalent in NASDAQ’s 0.9% gain last week (2).
Market breadth picked up a tad last week (3) with NYSE Advancers outpacing Decliners by a slim 369. New Highs raised just a hair as did New Lows (4). Market internals currently leave something to be desired. Further gains in Advancers and Highs and a reduction in Decliners and Lows are needed to confirm broad market support and further gains.
Weekly CBOE Equity Only Put/Call Ratio of 0.73 (5) matched some of the recent spikes at the lows in May and August, which is encouraging. Finally, the yield curve continues to steepen with the current spread between the 90-Day and 30-Year Treasury now at 44 basis points, its widest margin since August.
As we have been monitoring all year, seasonal patterns for the Pre-Election remain on track, though the October dip came early. Save some truly negative news, the low for the year is likely in. With the market tracking this seasonal pattern so closely all year that suggests the pattern is likely to continue, which means some backing and filing around S&P 3000 through late November before additional new highs toward yearend.
|
October Stock Basket: Open Season for Stocks
|
|
By:
Jeffrey A. Hirsch & Christopher Mistal
|
October 17, 2019
|
|
|
|
This basket is being presented in order to take advantage of the “Best Months” of the year (November through April/June) for stocks. We will look to add these 20 stocks, in the table below, near current levels or on minor dips. We will allocate a hypothetical $2000 from the cash position in the portfolio to each position. For each stock we have provided the ticker, name, sector, general business description, plus annual sales growth, PE, price-to-sales ratio, market value, a dividend yield and a suggested buy limit and stop loss.
These 20 stocks all have reasonably solid valuations, revenue and earnings growth. Most also exhibit positive price and volume action as well as other constructive technical and chart pattern indications. Oil and gas explorers and producers do not have great technicals at this time but appear to be in the process of finding a typical seasonal low. The group of 20 covers a broad array of sectors and industries. It also runs the gamut of market capitalization with a mix of large caps with more than $5 billion in market value, midcaps in the $1-5 billion range, and small caps under $1 billion.
We first sifted through the universe of nearly 8,000 U.S. traded stocks for those with a market cap of at least $50 million and average daily volume of 50,000 shares or more on average over the past twenty trading sessions. Then we winnowed the list down to only those stocks with relatively low price-to-sales and price-to-earnings ratios. From there we searched for stocks that were exhibiting revenue and earnings growth.
We then dug into numerous individual company charts before settling on these final 20 stocks. Our underlying theme was to find reasonably priced stocks quietly growing sales and earnings that are flying somewhat under the radar with only a few on The Street paying close attention to them. As market cap goes higher, this becomes increasingly challenging and a history of earnings surprises becomes even more important.
At the end of the screening process we were left with a reasonably diverse basket. Oil & gas are well represented with five stocks, but the remainder of the basket includes medical, semiconductors, construction, transportation/aerospace and consumer stocks. We did not search specifically for top-performing stocks within any specific sector, this just happens to be where relative value and growth currently exist.
|
ETF Portfolios Updates: New Buy Limits & Stop Losses
|
|
By:
Christopher Mistal
|
October 14, 2019
|
|
|
|
This special, unscheduled Alert is an update to the Sector Rotation and Tactical Seasonal Switching Strategy ETF Portfolios in accordance with the trades detailed in
Friday’s Alert.
Unlike many of the market’s recent trading sessions, today’s trading was relatively subdued. Today’s narrow trading range and lower activity may have been due to the observance of Columbus Day or it may have been due to a lack of headlines. Nonetheless, the market provided ample opportunity today to add all outstanding Sector Rotation ETF and Tactical Seasonal Switching ETF positions at prices below Friday’s close and our initial buy limits.
Per Friday’s Alert, all open positions in the Sector Rotation Portfolio were added today using each ETFs average price for today. Updated Buy Limits, Stop Losses and Auto-Sell prices appear in the table below.
With the exception of SPDR Gold (GLD), all positions in the Sector Rotation Portfolio can be considered at current levels up to their respective buy limits.
Tactical Seasonal Switching Strategy ETF Portfolio
Per Friday’s Alert, all open positions in the Tactical Seasonal Switching Portfolio were added today using each ETFs average price for today. Updated Buy Limits appear in the table below.
DIA, IWM, QQQ and SPY will be held without a Stop Loss and can be considered at current levels up to their respective buy limits.
|
Tactical Seasonal Switching Strategy Update
|
|
By:
Jeffrey A. Hirsch & Christopher Mistal
|
October 11, 2019
|
|
|
|
Faster moving MACD “Buy” indicators applied to DJIA, S&P 500 and NASDAQ are all positive as of today’s close. With all three indices confirming, we are now issuing our Seasonal MACD Buy Signal.
Buy SPDR DJIA (DIA), SPDR S&P 500 (SPY), Invesco QQQ (QQQ), and iShares Russell 2000 (IWM) in the Almanac Investor Tactical Seasonal Switching Strategy Portfolio. Buy limits for DIA, SPY, QQQ and IWM are initially today’s closing price plus 1%. For example if today’s closing price was $270, then the buy limit would be $272.70 (closing price * 1.01 = buy limit). For tracking purposes, these ETFs will be added to the portfolio using their respective average prices on October 14. This price will be calculated by summing the high and low prices and dividing by two.
Defensive bond positions in AGG, BND and TLT, were officially stopped out in mid-September and closed.
In the Almanac Investor Sector Rotation Portfolio, Buy XLV, XLP, IBB, IYW, IYT, IYZ, SOXX, XLY, XLF, XLI, XLB, XLK and VNQ. Use a 1% Buy Limit for these positions as detailed above. For tracking purposes, these ETFs will be added to the portfolio using their respective average prices on October 14.
“Worst Months” trades in XLU and IYT short position have been stopped out. XLU was closed at $64.12 on October 9 after closing below its stop on the previous day. IYT was stopped out today and will be closed out on Monday.
A special email Alert will be sent on Monday, October 14 after the close updating the Tactical Seasonal Switching ETF Portfolio and the Sector Rotation ETF Portfolio.
|
Seasonal MACD & Stock Portfolio Updates: Waiting for All Clear
|
|
By:
Christopher Mistal
|
October 10, 2019
|
|
|
|
Seasonal MACD Buy Signal Update
As of today’s close, our Seasonal MACD Buy Signal is still on Hold. Our 8-17-9 MACD “Buy” indicator applied to DJIA, S&P 500 and NASDAQ are all negative (blue arrows in charts below). Currently, single day gains of 197.27 DJIA points (0.74%) and 14.80 S&P 500 points (0.50%) are needed to turn the MACD indicators positive for DJIA and S&P 500. NASDAQ’s MACD will turn positive if it does not decline more than 36.33 points (0.46%).
As a reminder, the criteria to issue our Seasonal MACD Buy Signal is a new buy signal using our 8-17-9 MACD indicator on or after the first trading day of October and DJIA, S&P 500 and NASDAQ must be in agreement. These criteria are not yet satisfied.
Stock Portfolio Update
In the time since last update through yesterday’s close the Almanac Investor Stock Portfolio slipped 0.1% lower compared to a 2.7% loss by S&P 500 and a 6.1% decline from the Russell 2000. The portfolio’s sizable cash position played a part in capping losses as did the high concentration of defensive stocks held. Mid-cap positions in the portfolio actually advanced 0.2% due to solid gains by Algonquin Power (AQN) and One Gas Inc (OGS). Large-caps slipped 0.3% lower as Abbott Labs (ABT) and Expeditors International (EXPD) suffered notable losses.
This year’s defensive stock basket,
presented on June 20 has performed reasonably well. The entire basket has an average gain of 5.1% (includes stopped out positions, excludes dividends and trading fees) compared to a loss of 1.2% by S&P 500 over the same time period. Of the original 19 positions, fifteen were added to the portfolio. Four positions ran away and were cancelled. Of the fifteen added, three were stopped out and twelve remain active holdings. Five of these positions are up double digits lead by a 18.6% gain by
Pattern Energy (PEGI). Dull yet familiar
AT&T (T) is second best with a 17.2% gain.
Currently two positions from the defensive basket are negative, Centerpoint Energy (CNP) and Keurig Dr. Pepper (KDP). The declines are currently modest and not overly troublesome. CNP has a 4.1% dividend yield and KDP is 2.2% which was one of the primary reasons for purchasing them. Continue to Hold CNP and KDP.
All positions held in the portfolio are on Hold. The “Worst Months” are still in progress. Continue to limit new buying. Please see table below for updated stop losses. Later this month we anticipate preparing a new basket on stock ideas to trade during the upcoming “Best Months” period.
|
Seasonal MACD Update: No Go, Still Negative
|
|
By:
Christopher Mistal
|
October 03, 2019
|
|
|
|
As of today’s close, our Seasonal MACD Buy Signal is on Hold. Our 8-17-9 MACD “Buy” indicator applied to DJIA, S&P 500 and NASDAQ are all negative (blue arrows in charts below). Currently, single day gains of 1534.34 DJIA points (5.86%), 150.70 S&P 500 points (5.18%) and 363.34 NASDAQ points (4.62%) are needed to turn our MACD indicators positive on all three indexes.
The criteria to issue our Seasonal MACD Buy Signal is a new buy signal using our 8-17-9 MACD indicator on or after the first trading day of October and DJIA, S&P 500 and NASDAQ must be in agreement. These criteria are not satisfied.
Tactical Seasonal Switching Strategy ETF Portfolio Updates
In preparation for our Seasonal MACD Buy Signal, DIA, IWM, QQQ and SPY appear in the table below. These are the four ETFs that will be utilized to trade the upcoming “Best Months.” Prices will be updated when we issue our Seasonal MACD Buy Signal.
Defensive bond positions were all stopped out on September 13. The average gain on AGG, BND and TLT was 6% excluding dividends and trading costs. This compares favorably to DJIA and S&P 500 gains of 3% and 2.9% from our Seasonal MACD Sell Signal on May 1 through September 13. From May 1 close through today, the result is even better as DJIA and S&P 500 are negative.
|
ETF Trades: Get Ready for Seasonal Buying Binge
|
|
By:
Christopher Mistal
|
October 03, 2019
|
|
|
|
For the past eighteen years we have been preparing Almanac Investor readers for the annual October ETF buying spree. This year is no exception, but before delving into October’s seasonalities, let’s do a quick review for new and seasoned followers alike.
Every year while preparing the annual Almanac, we revisit and analyze our sector seasonalities (STA 2020 pages 92, 94 and 96) in depth in order to make adjustments for any new or developing trends. There have been a few minor revisions made to our Sector Seasonalities table in recent years, but for the most part, sector seasonality has been reasonably on track with many sectors producing the bulk of their annual gains during their traditionally favorable periods. Years of sector research allows us to specify whether the seasonality starts or finishes in the beginning third (B), middle third (M) or last third (E) of the month based upon the number of trading days in the month.
The 2020 Almanac table follows. Both long and short trade opportunities are researched and the most statistically viable appear below. Because indexes are not directly tradable, highly correlated exchange-traded funds (ETFs) are chosen to execute trades. Performance over the last 5-, 10- and 15-year time periods is included. We prefer to focus on the 15-year average performance as this period has sufficient data to be seasonally significant.
These entry and exit points will be the basis for our seasonal trades over the coming year. They are guidelines, as we generally look to enter new positions before the start of the favorable period and exit before its end. Occasionally a trade is closed out well in advance of the seasonality’s end. An outsized advance may trigger a trade at the suggested auto-sell price (a price target based upon past historical performance of the specific seasonality) or should strength fail to materialize, a stop loss could be reached.
There are thirteen sector seasonalities that enter their favorable periods in October. The following trade ideas are made based upon these seasonalities. Currently, all buy limits are below current market levels. Should the market continue to struggle prior to our Seasonal MACD Buy Signal, we want to take advantage of any weakness or pullback to begin accumulating the following new positions. Any positions left open, will be considered when we issue our Seasonal MACD Buy Signal for DJIA, S&P 500 and NASDAQ.
Trades for October Sector Seasonalities
Transports enter their historically favorable season at the beginning of October and it runs until May. iShares DJ Transports (IYT) is attractive below current levels with a buy limit of $173.75. The stop loss is $156.38 and auto sell is $252.15. Top 5 holdings are: Norfolk Southern, Union Pacific, FedEx, Kansas City Southern and United Parcel Service. With nearly 70% of U.S GDP coming from consumers, seasonal strength in the consumer sector overlaps nicely with the transportation sector. Ongoing trade conflict is a risk, but negotiations are proceeding.
![[iShares DJ Transports (IYT) Chart]](/UploadedImage/AIN_1119_20191003_IYT.jpg)
Over the last 15 years, Telecom has generated an average return of 4.0%, but for the last 5 years the average has slipped to 0.7% during its bullish seasonality from the middle of October through yearend. The top ETF within this sector is iShares DJ US Telecom (IYZ). Use a buy limit of $27.25 and stop loss of $24.53. If above average gains materialize, take profits at the auto sell of $35.43. Top 5 holdings are: Verizon, AT&T, Motorola, T-Mobile and Cisco Systems. Aggressive competition has not been kind to growth, but IYZ does boast a 12-month trailing yield of 1.83%. In the near-term, 5G rollout is likely to be costly, but in the longer-term 5G could replace traditional “wired” high-speed internet connections.
![[iShares DJ US Telecom (IYZ) Chart]](/UploadedImage/AIN_1119_20191003_IYZ.jpg)
Semiconductors come into favor near October’s end and remain so until the beginning of December. This trade has averaged 8.6% and 9.1% gains over the last 15- and 5-year periods, respectively. iShares PHLX Semiconductor (SOXX) is the top selection. Establish new positions with a buy limit of $191.55 and utilize a stop loss of $172.40. Take profits at the auto sell of $260.03. Top 5 holdings are: Intel, Texas Instruments NVidia, Broadcom and QUALCOMM. These are the companies that design and supply the brains for the bulk of our favorite electronic devices; smart watches, smart phones, PCs, tablets, actions cameras, drones, refrigerators, basically you name it.
![[iShares PHLX Semiconductor (SOXX) Chart]](/UploadedImage/AIN_1119_20191003_SOXX.jpg)
Although consumer spending is spilt into two distinct sectors, Discretionary and Staples, their favorable seasons run concurrently from the beginning of October to the beginning of June in the following year. Over the past 15-years Discretionary has an average gain of 14.1% and Staples 8.7%. SPDR Consumer Discretionary (XLY) and SPDR Consumer Staples (XLP) are the preferred vehicles to execute these trades. XLY can be considered on dips below $112.37. An initial stop loss of $101.13 and an auto-sell at $160.27 are suggested. XLY Top 5 holdings are: Amazon.com, Home Depot, McDonald’s, NIKE, and Starbucks. XLP could be purchased on dips below $60.00. Maintain the existing stop loss at $55.46 and use an auto-sell of $71.61. XLP Top 5 holdings are: Procter & Gamble, Coca-Cola, Pepsi, Walmart and Philip Morris. XLP is an existing holding in the ETF Portfolio. If you already own, continue to hold the existing position, if you do not currently hold XLP, a new position can be considered.
![[SPDR Consumer Discretionary (XLY) Chart]](/UploadedImage/AIN_1119_20191003_XLY.jpg)
![[SPDR Consumer Staples (XLP) Chart]](/UploadedImage/AIN_1119_20191003_XLP.jpg)
The line between Broker/Dealer and Banking sectors is somewhat blurry with each sector averaging gains of 13.0% and 12.5% over the last 5 years, respectively. Instead of trading two smaller, somewhat less liquid ETFs, SPDR Financial (XLF) is the better choice. Use a buy limit of $25.65 and a stop loss of $23.09 once a position has been entered. The auto sell is $35.62. Its holdings cover all things financial from insurance companies to stock exchanges. Top 5 holdings are: Berkshire Hathaway, JPMorgan Chase, Bank of America, Wells Fargo and Citigroup.
![[SPDR Financial (XLF) Chart]](/UploadedImage/AIN_1119_20191003_XLF.jpg)
Another area exhibiting a reasonable amount of overlap is the Healthcare and Pharmaceutical sectors, at least as far as many ETFs are concerned. Healthcare has racked up a 9.2% average return over the past five years while Pharmaceutical alone has been just 3.3%. SPDR Health Care (XLV) does an excellent job of representing both sectors and comes with the added bonus of holding several well-established biotechnology companies as well. XLV is attractive below current levels with a buy limit of $86.15. The stop loss is $81.12 and auto sell is $119.71. Top five holdings are: Johnson & Johnson, Merck, UnitedHealth Group, Pfizer and Medtronic. XLV is also an existing position in the portfolio. If you already own, continue to hold the existing position, if you do not currently hold XLV, a new position can be considered.
![[SPDR Health Care (XLV) Chart]](/UploadedImage/AIN_1119_20191003_XLV.jpg)
Industrials have a favorable period that runs from the end of October through the middle of May with historical returns averaging 11.3% over the last 15- year period. Buy SPDR Industrials (XLI) with a buy limit of $71.97. Once purchased, set a stop loss of $64.77 and an auto sell of $100.13. Top 5 holdings are: Boeing, Honeywell, Union Pacific, United Technologies and Lockheed Martin. Despite all the headwinds, trade, slowing growth and in the case of Boeing the 737 Max, the sector has proven resilient. The smallest of positive news or improvement in growth could unleash this sector.
![[SPDR Industrials (XLI) Chart]](/UploadedImage/AIN_1119_20191003_XLI.jpg)
Materials have a favorable period that runs from the beginning of October through the beginning of May with historical returns of 15.2% over the last 15- year period. Buy SPDR Materials (XLB) with a buy limit of $53.67. Once purchased, set a stop loss of $48.30 and an auto sell of $77.28. Top 5 holdings are: Linde, Du Pont, Ecolab, Air Products & Chemicals and Sherman-Williams. Similar to the Industrials sector, Materials have also held up well and could begin to rise at the first sign of improving growth.
Computer Tech comes into favor in early October and remains so until the beginning of January. This trade has averaged 7.4% and 3.7% gains over the last 15- and 5-year periods, respectively. SPDR Technology (XLK) is the top selection. Enter this trade with a buy limit of $72.22 and employ a stop loss of $65.00. Take profits at the auto sell of $96.96. Top 5 holdings are: Microsoft, Apple, Visa, Mastercard and Intel. Microsoft is the largest current holding, at 19.48% of total assets.
Real Estate has seen returns of 10.2% and 4.2% over the last 15 and 5 years respectively from the end of October to the beginning of May. Vanguard REIT (VNQ) is our choice. Use a buy limit of $91.15 and a stop loss of $82.04 once a position has been entered. The auto sell is $125.56. Top 5 holdings are: Vanguard Real Estate II Index fund, American Tower, Crown Castle Intl., Prologis and Equinix.
Sector Rotation ETF Portfolio Updates
Defensive positions in the portfolio did weaken in the first half of September as the broad market rallied to recover August declines. As Treasury bond yields rose in September, interest rate sensitive holdings like XLU, GDX, GLD and SLV, declined. GDX was stopped out on September 9 and SLV was stopped out on September 13. At yesterday’s close both were still lower than when stopped out.
Recent weakness has helped GLD recover some of its September losses. Continue to Hold GLD. The short position in iShares Transportation (IYT) has also benefited from recent market declines. Continue to hold the IYT short position for now. Should IYT decline to $173.75 or lower, cover the short position.
SPDR Utilities (XLU) is also on Hold. Its favorable season ends in October. A 1% trailing stop loss updated daily using the closing price of XLU is suggested.
Last month’s short energy trade using ProShares UltraShort Bloomberg Crude (SCO) came to an abrupt end on September 16 as crude oil spiked higher due to an attack on Saudi oil assets that took approximately 5 million barrels of daily production of the market. Per standard trading guidelines SCO was closed out because it closed below its stop loss. On that day it was unknown how long it would take to recover the lost production and the loss could have easily grown much bigger.