|
December 2019 Trading & Investment Strategy
|
|
By:
|
November 21, 2019
|
|
|
|
|
Market at a Glance - 11/21/2019
|
|
By:
Christopher Mistal
|
November 21, 2019
|
|
|
|
11/21/2019: Dow 27766.29 | S&P 3103.54 | NASDAQ 8506.21 | Russell 2K 1583.96 | NYSE 13406.42 | Value Line Arith 6338.05
Fundamental: Mixed. U.S. labor market remains quite firm with unemployment at just 3.6% and 128,000 net new jobs added in October. A firm labor market should continue to support consumers. Q4 U.S. GDP is not currently looking great. Atlanta Fed’s GDPNow model is forecasting a mere 0.4%. Trade remains unresolved and impeachment hearings are in progress. Q3 corporate earnings and revenue were better than expected suggesting Q4 could still be better than currently anticipated.
Technical: Consolidating. After breaking out to new all-time highs earlier this month, DJIA, S&P 500 and NASDAQ have paused to digest gains and evaluate the latest trade-related headlines. Technical indicators that were at or near overbought levels have begun to ease confirming the pause. The pause/retreat is likely to be brief in duration and magnitude and good be an opportunity to add to existing long positions or to establish new long positions.
Monetary: 1.50-1.75%. The Fed signaled they were most likely done cutting rates (for now). Although they are expanding their balance sheet again (QE4) and stand ready to act further, if needed, to support the economy. According to CME Group FedWatch Tool, there is a 0% probability of a cut at the Fed’s next meeting in December. Nonetheless, rates are low here, even lower elsewhere which has historically been positive for stocks.
Seasonal: Bullish. December is now the number two S&P 500 month and the third best month for DJIA since 1950, averaging gains of 1.5% on each index. It’s the top Russell 2000 (1979) month and third best for NASDAQ (1971) and Russell 1000 (1979). The “January Effect” of small-cap outperformance starts in mid-December. Wall Street’s only “Free Lunch” of distressed small- and micro-cap stocks making new 52-week lows on December Triple-Witching Friday will be served before the opening bell on December 23. Santa’s Rally begins on Tuesday December 24 and lasts until the second trading day of the New Year. In years when Santa Claus did not come to Wall Street, bear markets or sizable corrections have often materialized in the coming year.
Psychological: Holiday cheer. According to
Investor’s Intelligence Advisors Sentiment survey bulls are at 57.2%. Correction advisors are at 25.7% and Bearish advisors are 17.1%. Bullish % has actually receded ever so slightly from prior readings but is still elevated. New all-time highs, bullish yearend seasonality and upcoming holidays typically cause high levels of bullish sentiment now and often well into the New Year. Only a major change, sharply higher or lower, would be concerning.
|
December Outlook: Santa Claus Rally & Yearend Highs
|
|
By:
Jeffrey A. Hirsch & Christopher Mistal
|
November 21, 2019
|
|
|
|
The beat rolls on. In the face of ongoing geopolitical and U.S. political volatility, machinations and all the noise, equity markets continue to march higher. While economic growth has slowed underlying strength remains evident. Market internals still have room for improvement with the Advance/Decline positive but not on the same trajectory as the indices and dearth of new 52-week highs.
If election-cycle politics come into play, we will either get a deal in principle before the December 15 date when new tariffs are supposed to kick in or the White House will kick the can into next year and delay the new tariffs some more so they can settle on an initial agreement with the Chinese well ahead of the 2020 Presidential Election.
In any event, seasonal strength is firing on all pistons as it has been all year, pushing the market to new highs and the Dow over 28000. As is often the case we’ve had a little pull back this week before Thanksgiving after hitting the 28000 milestone, likely triggered by comments related to delays in completing “Phase One” of the trade deal with China.
Going back to 1949 we are on pace for the 10th biggest year-to-date through November gains for the S&P 500 – and it’s a healthy sign for the rest of the year and next. We crunched the numbers for the S&P 500 YTD gains as of the end of November. Average YTD November gains are 7.4%. The list below shows the Top 21 YTD November that are all twice the average, which we felt best represents the current situation.
Following Decembers and following years have had solid performance and average to slightly better than average results. After big YTD gains December is up 71.4% of the time with an average gain of 1.7% and the next year is up 81.0% of the time with an average gain of 9.9%. The reinforces our positive outlook for the rest of 2019 and 2020.
Fourth quarter seasonal strength is rather apparent in the updated accompanying chart of Pre-Election Year Seasonal Patterns overlaid with 2019. November has been stronger than usual, especially for a pre-election year, with DJIA up 2.7% for the month as of today’s close, S&P 500 up 2.2% and NASDAQ up 2.6%.
We may yet suffer a little more contraction before Thanksgiving considering how far we’ve come as the market digests the psychological threshold of the Dow’s big round number new high of 28000. This sets up the Thanksgiving Trade (Stock Trader’s Almanac, page 104) of buying into weakness the week before the holiday and selling into holiday strength. We should also get a boost from end-of-November seasonal strength.
Tax-loss selling often kicks in the first half of December, creating a soft patch for the market early in December. This is also evident in the chart here. The old “January Effect” of small caps outperforming large caps in January begins in mid-December. Then the Santa Claus Rally comes to town.
As soon as Thanksgiving comes around on the calendar – or even Halloween – all the talk on The Street is: “Will we or won’t we have a Santa Claus Rally?” But they all refer to it as the 4th Quarter Rally or the November-December Rally or the December Rally or the Halloween-New Year’s Rally or the Thanksgiving-Christmas Rally.
Yes, the market has a strong tendency to rally smartly in Q4, but that is not the Santa Claus Rally. The Santa Claus Rally was discovered and named by Yale Hirsch in 1972 and published in our 1973 Stock Trader’s Almanac. As defined by Yale and detailed on page 116 of the newly released 53rd Annual 2020 Edition:
“Santa Claus tends to come to Wall Street nearly every year, bringing a short, sweet, respectable rally within the last five days of the year and the first two in January. This has been good for an average 1.3% gain since 1969 (1.3% since 1950 as well). Santa’s failure to show tends to precede bear markets, or times stocks could be purchased later in the year at much lower prices. We discovered this phenomenon in 1972.”
To Wit, Yale’s witty rhyme which has become the headline of our “Santa Claus Rally” page and the battle cry of market pundits during the holiday season: “If Santa Claus Should Fail To Call, Bears May Come To Broad And Wall.” After last year’s debacle and Christmas Eve Crumble for the market, the SCR was our first confirming bullish indicator that we had reached a bottom on December 24, 2018 and that the prospects for 2019 were quite positive.
We capitalize on the Small Cap Effect and the Santa Claus Rally with our Bargain Stock Strategy we call “The Only Free Lunch on Wall Street.”
Last year’s basket of “Free Lunch” stocks making new 52-week lows on December Triple Witching Friday was a boon. This year we will make our selections from stocks making new 52-week lows on Friday, December 20, 2019. Subscribers will be emailed the list before the open on Monday, December, 23, 2019 – likely over the weekend.
Finally Pre-election Years tend to make their highs around yearend and 2019 has been tracking this pattern to a T this year. So after a little chop between now and mid-December we expect further new highs.
Pulse of the Market
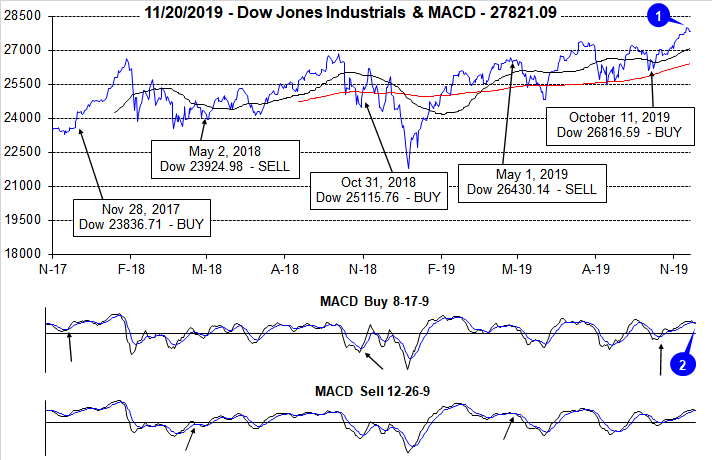
Fueled by better than expected corporate earnings and an improving trade outlook, DJIA surged above and closed above 28000 (1) for the first time ever on November 15. This was exactly five weeks after we issued our Seasonal MACD Buy Signal for DJIA, S&P 500, NASDAQ and Russell 2000. However, conflicting reports on trade have stalled DJIA’s progress this week. As a result, the faster and slower moving MACD indicators applied to DJIA have also begun to weaken (2). We have been looking for the market to weaken/pause around mid-November and that pause has arrived.
Bullishly, DJIA’s rise to new all-time highs was accompanied with corresponding new highs by S&P 500 and NASDAQ. DJIA has advanced four weeks straight (3) and five of the last six. S&P 500 has been up six weeks straight (4) while NASDAQ has logged seven straight weekly gains (5). Inevitably these winning streaks will end, but that does not mean the market’s rally will also be over. It’s been fourteen weeks (early August) since DJIA suffered back-to-back Down Friday/Down Monday warnings. This would suggest that trader and investor confidence remains firm.
Market breadth measured by NYSE Weekly Advancers and NYSE Weekly Decliners (6) has remained relatively positive over the last six weeks with Advancers outnumbering Decliners in five of the last six weeks. A wider margin, even more Weekly Advancers, would be a welcome and encouraging sign. At first blush the somewhat tepid number of Weekly Advancers could be an issue, but the more likely reason for the depressed number is rotation from defensive to growth positions. Utilities, energy and precious metals are all below their respective highs from earlier this year and are likely contributing to the number of Weekly Decliners.
Weekly New Highs and Lows (7) are also rather mixed. Previously mentioned rotation is also likely in play here as well. Another factor that could be weighing on readings is the fact that small caps, measured by the Russell 2000, are lagging. If the Russell 2000 was to catch up and trade at new all-times, weekly metrics would likely improve.
The 90-day Treasury rate and the 30-year Treasury rate (8) appear to be stabilizing around current levels. The Fed has signaled it is most likely done with rate cuts unless there is a material change to their outlook or the data. Historically, U.S. rates are low and other developed nation’s rates are even lower. Low rates have historically been a positive for stocks.
Click for larger graphic…
|
December Almanac: If Santa Claus Should Fail to Call, Bears May Come to Broad and Wall
|
|
By:
Jeffrey A. Hirsch & Christopher Mistal
|
November 21, 2019
|
|
|
|
December is now the number two S&P 500 month and the third best month on the Dow Jones Industrials since 1950, averaging gains of 1.5% on each index. It’s the top Russell 2000 (1979) month and third best for NASDAQ (1971) and Russell 1000 (1979). Last year DJIA suffered its worst December performance since 1931 and its fourth worst December going all the way back to 1901. However, the market rarely falls precipitously in December and a repeat of last year is not that likely. When it does it is usually a turning point in the market—near a top or bottom. If the market has experienced fantastic gains leading up to December, stocks can pullback in the first half.
In pre-election years, December’s overall ranking remains about the same across the board however, average gains improve handsomely. DJIA averages 2.7%, S&P 500 2.9%, NASDAQ 4.3%, Russell 1000 2.9% and Russell 2000 3.1%. DJIA has advanced in 13 of the last 17 pre-election year Decembers. DJIA’s worst pre-election December was in 2015 when it declined a modest 1.7%. DJIA’s best pre-election year December was in 1991, up 9.5%.
Trading in December is holiday inspired and fueled by a buying bias throughout the month. However, the first part of the month tends to be weaker as tax-loss selling and yearend portfolio restructuring begins. Regardless, December is laden with market seasonality and important events.
Small caps tend to start to outperform larger caps near the middle of the month (early January Effect) and our “Free Lunch” strategy is served from the offerings of stocks making new 52-week lows on Triple-Witching Friday. An Almanac Investor Alert will be sent prior to the open on December 24 containing “Free Lunch” stock selections. The “Santa Claus Rally” begins on the open on Christmas Eve day and lasts until the second trading day of 2020. Average S&P 500 gains over this seven trading-day range since 1969 are a respectable 1.3%.
This is our first indicator for the market in the New Year. Years when the Santa Claus Rally (SCR) has failed to materialize are often flat or down. The last six times SCR (the last five trading days of the year and the first two trading days of the New Year) has not occurred were followed by three flat years (1994, 2004 and 2015) and two nasty bear markets (2000 and 2008) and a mild bear that ended in February 2016. As Yale Hirsch’s now famous line states, “If Santa Claus should fail to call, bears may come to Broad and Wall.”
December Triple Witching Week is more favorable to the S&P 500 with Monday up twelve of the last nineteen years while Triple-Witching Friday is up twenty-five of the last thirty-seven years with an average 0.3% gain. The entire week has logged gains twenty-six times in the last thirty-five years. The week after December Triple Witching is the best of all weeks after Triple Witching for DJIA and is the only one with a clearly bullish bias, advancing in twenty-seven of the last thirty-seven years. Small caps shine especially bright with a string of bullish days that runs from December 19 to 26.
Trading the day before and the day after Christmas is generally bullish across the board with the greatest gains coming from the day before (DJIA up eight of the last twelve). On the last trading day of the year, NASDAQ has been down in fifteen of the last nineteen years after having been up twenty-nine years in a row from 1971 to 1999. DJIA, S&P 500, and Russell 1000 have also been struggling recently and exhibit a bearish bias over the last twenty-one years. Russell 2000’s record very closely resembles NASDAQ, gains every year from 1979 to 1999 and only five advances since.
| December (1950-2018) |
| |
DJI |
SP500 |
NASDAQ |
Russell
1K |
Russell 2K |
| Rank |
|
3 |
|
2 |
|
3 |
|
3 |
|
1 |
| #
Up |
|
48 |
|
51 |
|
28 |
|
30 |
|
30 |
| #
Down |
|
21 |
|
18 |
|
20 |
|
10 |
|
10 |
| Average
% |
|
1.5 |
|
1.5 |
|
1.6 |
|
1.3 |
|
2.1 |
| 4-Year Presidential Election Cycle Performance
by % |
| Post-Election |
|
1.0 |
|
0.6 |
|
0.9 |
|
1.3 |
|
2.2 |
| Mid-Term |
|
0.9 |
|
1.2 |
|
-0.3 |
|
0.1 |
|
0.3 |
| Pre-Election |
|
2.7 |
|
2.9 |
|
4.3 |
|
2.9 |
|
3.1 |
| Election |
|
1.4 |
|
1.2 |
|
1.4 |
|
0.8 |
|
3.0 |
| Best & Worst December by % |
| Best |
1991 |
9.5 |
1991 |
11.2 |
1999 |
22.0 |
1991 |
11.2 |
1999 |
11.2 |
| Worst |
2018 |
-8.7 |
2018 |
-9.2 |
2002 |
-9.7 |
2018 |
-9.3 |
2018 |
-12.0 |
| December Weeks by % |
| Best |
12/2/11 |
7.0 |
12/2/11 |
7.4 |
12/8/00 |
10.3 |
12/2/11 |
7.4 |
12/2/11 |
10.3 |
| Worst |
12/4/87 |
-7.5 |
12/6/74 |
-7.1 |
12/15/00 |
-9.1 |
12/21/18 |
-7.1 |
12/21/18 |
-8.4 |
| December Days by % |
| Best |
12/26/18 |
5.0 |
12/16/08 |
5.1 |
12/5/00 |
10.5 |
12/16/08 |
5.2 |
12/16/08 |
6.7 |
| Worst |
12/1/08 |
-7.7 |
12/1/08 |
-8.9 |
12/1/08 |
-9.0 |
12/1/08 |
-9.1 |
12/1/08 |
-11.9 |
| First Trading Day of Expiration Week: 1990-2018 |
| #Up-#Down |
|
17-12 |
|
16-13 |
|
14-15 |
|
16-13 |
|
13-16 |
| Streak |
|
D1 |
|
D1 |
|
D1 |
|
D1 |
|
D5 |
| Avg
% |
|
0.05 |
|
-0.02 |
|
-0.1 |
|
-0.04 |
|
-0.3 |
| Options Expiration Day: 1990-2018 |
| #Up-#Down |
|
17-12 |
|
19-10 |
|
18-11 |
|
19-10 |
|
16-13 |
| Streak |
|
D1 |
|
D1 |
|
D1 |
|
D1 |
|
D1 |
| Avg
% |
|
0.03 |
|
0.1 |
|
0.1 |
|
0.1 |
|
0.3 |
| Options Expiration Week: 1990-2018 |
| #Up-#Down |
|
22-7 |
|
21-8 |
|
18-11 |
|
20-9 |
|
16-13 |
| Streak |
|
D1 |
|
D1 |
|
D1 |
|
D1 |
|
D1 |
| Avg
% |
|
0.4 |
|
0.4 |
|
-0.08 |
|
0.4 |
|
0.3 |
| Week After Options Expiration: 1990-2018 |
| #Up-#Down |
|
21-8 |
|
19-10 |
|
19-10 |
|
19-10 |
|
22-7 |
| Streak |
|
U6 |
|
U6 |
|
U6 |
|
U6 |
|
U6 |
| Avg
% |
|
0.8 |
|
0.7 |
|
0.9 |
|
0.7 |
|
1.1 |
| December 2019 Bullish Days: Data 1998-2018 |
| |
4,
16, 20, 23, 26 |
10,
16, 20, 23, 26 |
4,
5, 10, 16 |
10,
16, 20, 23 |
10, 17, 19, 20 |
| |
|
|
23,
26 |
26,
27 |
23, 24, 26 |
| December 2019 Bearish Days: Data 1998-2018 |
| |
3,
18, 31 |
31 |
18,
31 |
31 |
31 |
| |
|
|
|
|
|
|
December 2019 Strategy Calendar
|
|
By:
Christopher Mistal
|
November 21, 2019
|
|
|
|
|
Stock Portfolio Update: Accumulate New Positions
|
|
By:
Christopher Mistal
|
November 14, 2019
|
|
|
|
Its no secret at this point, the market’s “Best Months” are now underway. From our
Seasonal MACD Buy on October 11 through today’s close DJIA, S&P 500, NASDAQ and Russell 2000 have advanced an average of 4.5%. DJIA, S&P 500 and NASDAQ have all broken out to new all-time highs. Russell 2000 has not done so yet, but small-cap outperformance normally doesn’t begin in earnest until after mid-December.
After a solid multi-week run of gains, driven by a dovish Fed, earnings and optimism for a trade deal, the market appears to be pausing to digest and consolidate the move. With the market tracking historical seasonal patterns rather closely all this year,
we have been expecting a pause and another opportunity to accumulate long positions here around mid-November and perhaps another chance in early December. November’s seasonal pattern, the pre-election year seasonal pattern and the trend of weakness two weeks before Thanksgiving all suggested a pause.
Further support for a brief pause/mild bout of weakness can be found in bullish sentiment readings. According to
Investor Intelligence Advisor Sentiment survey, bullish advisors have reached 57.6% while bearish advisors have slipped to 17.9% and correction advisors stand at 24.5%. It is not all that unusual for bullish sentiment to remain elevated for extended periods, especially ahead of the holiday season and during the beginning of the “Best Months,” but bullish advisors have nearly reached the level they were at in July, just before the August dip. The elevated number of bulls could cause some uneasiness in the near-term for a brief period.
Technical indicators are also signaling the rally could be due for a brief pause. Stochastic, relative strength and MACD indicators applied to DJIA, S&P 500 and NASDAQ (charts below) are all extended. S&P 500 and NASDAQ are also just under projected monthly resistance (red dashed line). DJIA has modestly exceeded resistance but appears to be unable to make a meaningful move higher, almost like resistance will not completely let go.
That is a case for a brief pause/pullback. However, our longer-term outlook, to year’s end and beyond remains bullish and we view any pause/pullback as a new opportunity to add to existing long positions or to establish new long positions if our Seasonal MACD Buy Signal was missed. Numerous positions in the Stock Portfolio (below) and the
ETF Portfolios can be considered on dips.
Stock Portfolio Update
In the time since last update through yesterday’s close the
Almanac Investor Stock Portfolio climbed 2.8% higher compared to a 6.0% advance by S&P 500 and a 7.4% gain from the Russell 2000. The portfolio’s sizable cash position played a part in capping gains in the first half of October as did the high concentration of defensive stocks held. Our
October Stock Basket, released on October 17, was specifically put together to take advantage of the “Best Months” of the year. All twenty positions have been added to the portfolio. The majority of the positions were added using their respective average price on October 18.
As of yesterday’s close, the October Basket was up on average 7.0% compared to an average gain of 3.3% by DJIA, S&P 500, NASDAQ and Russell 2000 over the same time period. The basket’s performance includes the loss recorded when Taylor Morrison (TMHC) was stopped out. A total of seven positions in the October Basket are up double digits. Qorvo (QRVO) is the best performing position, up 33.4% thus far due to strong earnings and guidance released on October 31. In the release, QRVO gave credit to an upswing in smartphone manufacturing and the 5G build out. QRVO can still be considered on small dips below its new buy limit.
The second-best position from the basket is Murphy Oil (MUR), up 25.4%. Better than expected earnings and revenues were the main catalyst for the advance. Even after this gain, MUR’s valuations remain quite reasonable and its dividend yield north of 4%, at current prices, is a nice bonus. MUR can also still be considered on dips below its new buy limit.
Rounding out the top three performing new positions is Regeneron (REGN). Once again earnings were the key driver as third quarter numbers were much better than estimates and the company shared a bullish outlook for one of its cancer treatments. REGN also announced a $1billion share buyback program. Considering the broad strength currently being exhibited by the biotech sector, REGN can still be considered on dips below its new buy limit. All other positions in the October Stock Basket can also still be considered at current levels or on dips. Updated buy limits and stop losses appear in the table below.
Previous held, mostly defensive in nature, positions in the portfolio remain on hold. Many of them have weakened modestly recently as defense has lost favor and interest rates appear to be stabilizing or at least the Fed has signaled it is likely done cutting rates for now unless there is a material change in their outlook. Many of the defensive positions also offer attractive dividend yields. A combination of growth positions and dividend paying positions should make a rewarding overall portfolio.
Please see table below for current advice, suggested stop losses and where applicable buy limits.
|
ETF Portfolio Updates: “Best Months” Under Way, Accumulate on Dips
|
|
By:
Christopher Mistal
|
November 07, 2019
|
|
|
|
Since issuing our
Seasonal MACD Buy Signal on the close on October 11 through today’s close, DJIA has advanced 3.2%, S&P 500 is up 3.9%, NASDAQ has climbed 4.7% and Russell 2000 has risen 5.4%. DJIA, S&P 500 and NASDAQ have all repeatedly closed at new all-time highs as well. The majority of the market’s recent gains occurred during the historically strong period at the
end of October into the beginning of November. More gains are expected through the end of the year and into the first quarter of next year, but some weakness is expected in mid-November and early December before the rally resumes in earnest.
![[31-year November Seasonal Pattern Chart]](/UploadedImage/AIN_1219_20191107_November_Seasonal.jpg)
Although November’s full-month historical performance has been stellar, it has also been common for the market to soften ahead of the Thanksgiving holiday. This weakness can be seen in the above 31-year November seasonal chart. Performance this November, through today’s close, is graphed as well. Two dips are visible in the chart. The first begins around the seventh and eighth trading days of November and the second occurs from around the eleventh trading day through the fourteenth trading day. Depending on index and dip, on average half to nearly all of the gains in the first five or six trading days are surrendered before the strong rally at the end of the November commences. These dips, should they occur again this year, are an opportunity to continue to accumulate long positions for the balance of the “Best Months.”
Mid-month November weakness is also visible on the Pre-Election Year Seasonal Pattern that we have been tracking throughout the year. It is modestly stronger for NASDAQ, but it is also present for DJIA and S&P 500.
The bullish “Best Months” are underway. We have closed out defensive positions in the Sector Rotation ETF Portfolio and Tactical Seasonal Switching ETF Portfolio. We have added positions poised to benefit from historical seasonal strength that lasts into next year. We have a new long basket of stocks that should also benefit from seasonal strength. However, even the “Best Months” do have soft patches. November’s anticipated soft patch could be an opportunity to establish new, long, bullish positions and/or add to existing positions.
Sector Rotation ETF Portfolio Update
No new Sector Seasonalities begin in November and just one comes to an end. The bearish XOI (oil and gas explorers and producers) finishes at the end of the month. Currently there is no associated position in the portfolio.
Recent market strength has lifted the average open position return to 5%. iShares PHLX Semiconductor (SOXX) is the best performing holding in the portfolio, up 8.2% as of its November 6 close. iShares DJ Transports (IYT), iShares NASDAQ Biotech (IBB) and SPDR Financial (XLF) are all up over 7% since being added on October 14. Only Vanguard REIT (VNQ) has been left out of the rally.
With the exception of SPDR Gold (GLD), all other positions in the portfolio can be considered on dips below their respective buy limits or in the case of SPDR Consumer Staples (XLP) and VNQ, at current levels. Please note that Buy Limits and Stop Losses have been adjusted to account for recent performance.
Tactical Seasonal Switching Strategy Portfolio Update
In the three and a half weeks since issuing our Seasonal Buy Signal, open position average performance has risen to 4.1%. iShares Russell 2000 (IWM) is the best performer up 5.7%. SPDR DJIA (DIA) is the laggard of the group, up 2.5%. All four positions can be considered on dips below their respective buy limits which have been adjusted to account for recent performance. As a reminder, these positions are intended to be held until we issue corresponding Seasonal MACD Sell Signals next year after April 1. As a result, no stop loss is suggested on these positions.