|
2015 Forecast: First Half High Near Dow 19000 Then Flatter Second Half
|
|
By:
Jeffrey A. Hirsch & Christopher Mistal
|
January 31, 2015
|
|
|
Well, it looks like Santa Claus is coming to Wall Street. On the heels of a much sharper than typical correction in the first half of December, fueled by the cratering oil market and fears of another collapse of the Russian ruble, Janet Yellen, Chair of the Federal Reserve, delivered just what the market ordered. More upside follow through, or at least a decent day, tomorrow and we should be set for a typical (or even larger than average) Santa Claus Rally and higher highs by yearend or early January.
At that point, if the momentum stalls, look for the January break. January has been prone to profit taking selloffs in recent years. After any January/February correction the rally should resume, carrying us to new heights in the first half of 2015. While low oil prices may be a drag on energy producer margins it is quite bullish for the rest of the economy, the consumer and the market. As for Russia, this is not 1998. The situation is more contained and Putin himself warned of $40 oil today. Russia has half a trillion dollars in currency reserves and tons of gold it can use if things get tougher there. And besides the writing has been on the wall for quite some time so economic woes in Russia are no surprise.
With the market up over 2% today across the board it looks like we have put in a higher low than October and formed a nice “W” bottom with the August, October and December lows this week. So it appears that seasonality, technical analysis, fundamentals and economics have all come together at the moment. Market forecasting is a difficult and hazardous endeavor, but somebody has to do it and it’s a tradition we do every year at this time. So let’s look at some of the data.
Market cycles are aligned rather well for 2015. It’s a pre-presidential election year, the best year of the 4-year cycle. Since their last loss in 1939, the third year of the cycle is up 16.0% on average for the Dow and 16.3% for the S&P 500. Since 1971 NASDAQ averages a whopping 30.9% in the third year of the 4-year cycle. It is also the fifth year of the decade, which is also the best year of the decade with only one loss in the past thirteen decades. Years ending in “5” average 28.3% for the Dow and its predecessors since 1885, with S&P 500 averaging 25.3% since 1935 and NASDAQ averaging 25.6% since 1975.
We are also now firmly in the sweet spot of the 4-year cycle (midterm Q4 & pre-election Q1-2). These best three quarters of the 4-year cycle have produce averaged gains of 21.5% for the Dow and 22.2% for the S&P 500 since 1950 and 34.1% for NASDAQ since 1974. However, since 1901 there have been six previous presidents that have served a sixth and seventh year. Except for 1919 during the post-WWI-armistice rally, seventh years have been a little weaker than other pre-election years, likely due to lower excitement with a president the country has become disenchanted with.
Four Horsemen of the Economy
The Jobs market is in great shape with the Unemployment Rate in a steady downtrend and now below the Fed’s 6% threshold. After heading higher this fall Initial Jobless Claims have resumed their down trend. This shows continued improvement in the labor market. It is still tough out there for many, but the jobs market continues to improve.
Inflation is now dancing with the Fed’s 2% target level, but low oil and commodities prices are putting pressure on inflation. The end of QE has been digested nicely by the economy and market and with inflation still sanguine the Fed is not likely to crank up rates, maybe up to a flat 0.25% around midyear and then wait and see.
Consumer Confidence continues to trend higher and is now flirting with the critical 90 level and back at pre-recession levels. Despite a few frightful bumps the DJIA and the US stock market powers higher. Once we get into the end of Q1 and into Q2 and the Fed starts tightening we think the momentum will start to wane.
The Housing is doing better as well, but has stalled somewhat recently though at relatively healthy levels. Of the four key pieces of housing data we track: existing home sales, housing starts, new home sales and the NAHB HMI, new home sales is the laggard.
We believe the NAHB Housing Market Index (HMI) is the best indicator of the overall housing market – it led all the other indicators before the meltdown and recovered fastest. HMI is now above its midpoint line, which indicates that the housing market and the economy while settling down some are in good shape.
Existing home sales and Housing starts continue to trend higher though they have been consolidating. New home sales remain a concern struggling to pick up the pace. This will be the last indicator to turn, but will provide an important confirmation when the housing market, the economy and the market have entered the next secular boom.
Pulse of the Market
DJIA’s brisk, early fourth quarter rally, stalled just short of 18,000 in early December as plummeting oil prices began to weigh. DJIA’s faster moving MACD “Buy” indicator (1) signaled a loss of momentum in mid-November while the slower moving MACD “Sell” indicator did not confirm until late November. These early signals foreshadowed DJIA’s eventual retreat below its 50-day moving average (2). Should holiday cheer fail to lift the market, DJIA’s next support level is its 200-day moving average, currently just below 16,800.
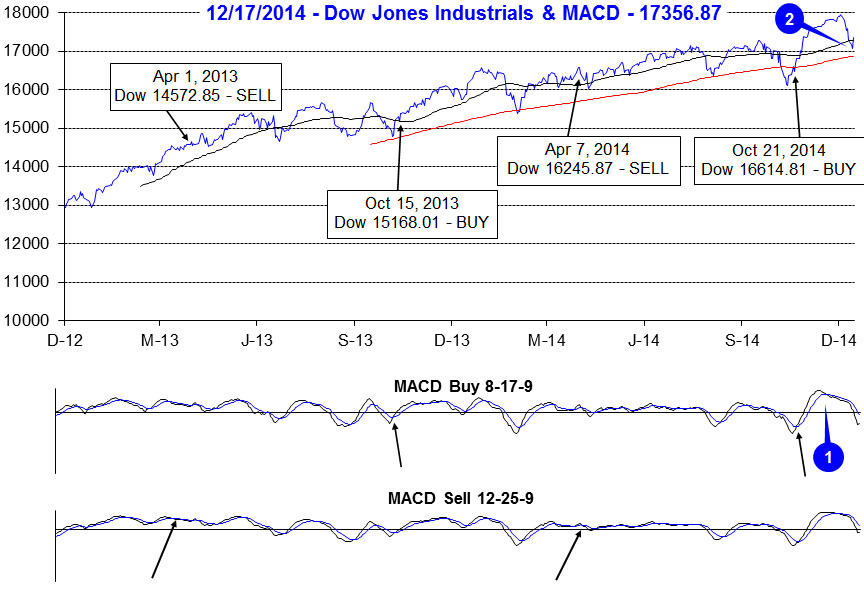
Last week’s 3.8% DJIA decline (3) was its worst weekly loss since November 2011 and was capped off the following Monday by the seventh Down Friday/Down Monday (DF/DM) of 2014 (4). Historically, DF/DM’s have been ominous warnings. Since 2000, DJIA has registered 156 DF/DM occurrences, in all but five occasions; DJIA was lower sometime in the next 90 calendar days. However, this year’s DF/DM occurrences have tended to precede market reversals within days or at longest three weeks.
Last week’s losses also ended a seven week winning streak for DJIA (3) and S&P 500 (5). NASDAQ had suffered a minor loss during the previous week (6), ending its streak at six. The velocity and magnitude of the declines was greater than usual early-December weakness, but it looks like the market has found support mid-month and is poised to rally into yearend.
Early signs of the decline were also present in the ratio of Weekly NYSE Advancers to Weekly NYSE Decliners (7). During the week ending December 5, NYSE Decliners modestly outnumbered NYSE Advancers even as DJIA and S&P 500 recorded gains. When this occurs it typically indicates that a rally is beginning to run out of steam as fewer and fewer stocks participate. However, last week’s trading resulted in a heavily biased ratio towards NYSE Decliners, which possibly signals the worst of the decline could be over. Weekly CBOE Put/Call Ratio (8) also spiked up to levels last seen during mid-October. This spike indicates a dramatic shift in sentiment and also the possibility of a bottom.
One positive from last week’s losses was the sudden drop in Moody’s AAA Corporate Rate (9). At 3.75%, this is the lowest since May 2013. At least AAA-rated companies will be able to borrow cheaply keeping stock buybacks and dividend increases on the rise, both of which have generally been bullish for the market.
Click for larger graphic…
2015 Forecast
The end of quantitative easy, a plunge in the price of oil and several geopolitical and exogenous issues seem to have been shrugged off by this market. We expect the usual 50% move from the midterm low to the pre-election year high to be below average in the 20-30% range as Fed rates hikes loom large. Toward the later part of 2015 the economy is prone to slowing as Republicans and Democrats begin the next battle for the White House.
We expect a high most likely in the first half of 2015 around Dow 19000, S&P 2250 and NASDAQ 5000, slightly higher or lower than NASDAQ’s all-time high. Then we look for a move sideways to slightly higher throughout the last half of 2015 with an ultimate high near yearend 2015.
Happy Holidays & Happy New Year, we wish you all a healthy and prosperous 2015!
|
Market at a Glance 12/18/2014
|
|
By:
Christopher Mistal
|
January 31, 2015
|
|
|
12/17/2014: Dow 17356.87 | S&P 2012.89 | NASDAQ 4644.31 | Russell 2K 1174.83 | NYSE 10603.50 | Value Line Arith 4553.12
Psychological: Festive. Despite last week’s sizable losses, Investor’s Intelligence Advisors Sentiment survey is still showing bulls at 49.5%. Bears number a paltry 14.9%, while the correction camp has swelled to 35.6%. These readings confirm an overall bullish sentiment that still leaves room for upside. Weekly CBOE Put/Call ratio and VIX both spiked last week as well, but both are already heading lower. Typical first-half December weakness is likely over and the market is poised to rally into yearend.
Fundamental: Firm. November’s employment report showed 321,000 net jobs added in the month while the unemployment rate sits at 5.8%. Housing data has cooled to a sustainable rate and housing starts have been above 1 million for three straight months. Falling energy prices will dampen energy company earnings, but will most likely give many consumers extra cash to spend elsewhere. Forward earnings estimates for the S&P 500 are falling, but a year from now (or less), provided oil does stabilize at substantially lower prices than the past few years, energy companies will likely have less weighting in many indices and the impact of their declining earnings will be reduced.
Technical: Consolidating. Until proven differently, DJIA, S&P 500 and NASDAQ have all been merely consolidating the gains from their respective early-November breakouts. It has not been a textbook process as DJIA, S&P 500 and NASDAQ have all closed below their breakout levels and their 50-day moving averages, but they are attempting to reclaim both levels again. Should they fail to find support, then the next key level to watch would be the 200-day moving average, DJIA 16,800, S&P 500 1948 and NASDAQ 4400.
Monetary: 0-0.25%. Everyone would like to know exactly when the Fed will raise interest rates. Unfortunately, this is just not possible. The Fed’s statement on Wednesday went to great pains to avoid any specific timeframe. Simply put, the Fed’s strategy is “wait and see.” It would like employment data and inflation near targets. Employment data is there or at a bare minimum, headed in the correct direction. Inflation, however, is not. Falling energy and other commodity prices are putting downward pressure on inflation. The Fed has spent trillions staving off deflation; I would not anticipate a rate hike until actual, present day inflation exceeds the Fed’s 2% target and future expectations are even higher.
Seasonal: Bullish. January is the third month of the Best Six/Eight, but it is the last of the Best Consecutive Three month span. January is the top month for NASDAQ (since 1971) averaging 2.9%, but it has slipped to sixth for DJIA and fifth for S&P 500 since 1950. The Santa Claus Rally ends on January 5 and the First Five Days early-warning system ends on the 8th. Both indicators provide an early indication of what to expect in 2015. However, we will wait until the official results of the January Barometer on January 30 before tweaking our 2015 Annual Forecast. Alerts will be issued after the close on these dates.
|
January Almanac: 87.5% of Pre-Election Years Follow January’s Direction
|
|
By:
Jeffrey A. Hirsch & Christopher Mistal
|
January 31, 2015
|
|
|
January has quite a legendary reputation on Wall Street as an influx of cash from yearend bonuses and annual allocations typically propels stocks higher. January ranks #1 for NASDAQ (since 1971), but fifth on the S&P 500 and sixth for DJIA since 1950. It is the end of the best three-month span and possesses a full docket of indicators and seasonalities.
DJIA and S&P rankings did slip from 2000 to 2014 as both indices suffered losses in eight of those fifteen Januarys with three in a row, 2008, 2009 and 2010. January 2009 has the dubious honor of being the worst January on record for DJIA (-8.8%) and S&P 500 (-8.6%) since 1901 and 1931 respectively. After three straight gains from 2011 to 2013, last year DJIA and S&P 500 were off 5.3% and 3.6% respectively in January.
On pages 106 and 110 of the Stock Trader’s Almanac 2015 we illustrate that the January Effect, where small caps begin to outperform large caps, actually starts in mid-December, this week. Early signs of this existed today with iShares Russell 2000 (IWM) outperforming the SPDR S&P 500 (SPY). The majority of their outperformance is normally done by mid-February, but strength can last until mid-May when most indices reach a seasonal high.
The first indicator to register a reading in January is the Santa Claus Rally. The seven-trading day period begins on the open on December 24 and ends with the close of trading on January 5. Normally, the S&P 500 posts an average gain of 1.5%. The failure of stocks to rally during this time tends to precede bear markets or times when stocks could be purchased at lower prices later in the year.
On January 8, our First Five Days “Early Warning” System will be in. In pre-presidential election years this indicator has a solid record. In the last 16 pre-presidential election years 12 full years followed the direction of the First Five Days; however, 2007 and 2011 did not. The full-month January Barometer has an even better pre-presidential-election-year record as 14 of the last 16 full years have followed January’s direction.
Our flagship indicator, the January Barometer created by Yale Hirsch in 1972, simply states that as the S&P goes in January so goes the year. It came into effect in 1934 after the Twentieth Amendment moved the date that new Congresses convene to the first week of January and Presidential inaugurations to January 20.
The long-term record has been stupendous, an 87.7% accuracy rate, with only eight major errors in 65 years. Major errors occurred in the secular bear market years of 1966, 1968, 1982, 2001, 2003, 2009, 2010 and possibly 2014. The market’s position on January 30 will give us a good read on the year to come. When all three of these indicators are in agreement it has been prudent to heed their call.
| January (1950-2014) |
| |
DJI |
SP500 |
NASDAQ |
Russell
1K |
Russell 2K |
| Rank |
|
6 |
|
5 |
|
1 |
|
4 |
|
2 |
| #
Up |
|
42 |
|
40 |
|
29 |
|
23 |
|
20 |
| #
Down |
|
23 |
|
25 |
|
15 |
|
13 |
|
16 |
| Average
% |
|
1.0 |
|
1.1 |
|
2.9 |
|
1.1 |
|
1.8 |
| 4-Year Presidential Election Cycle Performance
by % |
| Post-Election |
|
0.7 |
|
0.7 |
|
2.2 |
|
1.6 |
|
2.0 |
| Mid-Term |
|
-0.9 |
|
-1.0 |
|
-.07 |
|
-1.3 |
|
-0.9 |
| Pre-Election |
|
4.2 |
|
4.3 |
|
7.3 |
|
3.6 |
|
3.9 |
| Election |
|
0.3 |
|
0.5 |
|
2.6 |
|
0.7 |
|
2.3 |
| Best & Worst January by % |
| Best |
1976 |
14.4 |
1987 |
13.2 |
1975 |
16.6 |
1987 |
12.7 |
1985 |
13.1 |
| Worst |
2009 |
-8.8 |
2009 |
-8.6 |
2008 |
-9.9 |
2009 |
-8.3 |
2009 |
-11.2 |
| January Weeks by % |
| Best |
1/9/76 |
6.1 |
1/2/09 |
6.8 |
1/12/01 |
9.1 |
1/2/2009 |
6.8 |
1/9/87 |
7.0 |
| Worst |
1/24/03 |
-5.3 |
1/28/00 |
-5.6 |
1/28/00 |
-8.2 |
1/28/00 |
-5.5 |
1/4/08 |
-6.5 |
| January Days by % |
| Best |
1/17/91 |
4.6 |
1/3/01 |
5.0 |
1/3/01 |
14.2 |
1/3/01 |
5.3 |
1/21/09 |
5.3 |
| Worst |
1/8/88 |
-6.9 |
1/8/88 |
-6.8 |
1/2/01 |
-7.2 |
1/8/88 |
-6.1 |
1/20/09 |
-7.0 |
| First Trading Day of Expiration Week: 1990-2014 |
| #Up-#Down |
|
16-9 |
|
12-13 |
|
12-13 |
|
11-14 |
|
11-14 |
| Streak |
|
D1 |
|
D2 |
|
D2 |
|
D2 |
|
D2 |
| Avg
% |
|
0.001 |
|
-0.02 |
|
0.03 |
|
-0.04 |
|
-0.01 |
| Options Expiration Day: 1990-2014 |
| #Up-#Down |
|
14-11 |
|
13-12 |
|
12-13 |
|
13-12 |
|
13-12 |
| Streak |
|
U4 |
|
D1 |
|
D5 |
|
D1 |
|
D1 |
| Avg
% |
|
-0.1 |
|
-0.1 |
|
-0.2 |
|
-0.1 |
|
-0.2 |
| Options Expiration Week: 1990-2014 |
| #Up-#Down |
|
13-12 |
|
9-16 |
|
14-11 |
|
9-16 |
|
13-12 |
| Streak |
|
U4 |
|
D1 |
|
U3 |
|
D1 |
|
U3 |
| Avg
% |
|
-0.3 |
|
-0.3 |
|
-0.04 |
|
-0.3 |
|
-0.1 |
| Week After Options Expiration: 1990-2014 |
| #Up-#Down |
|
11-14 |
|
14-11 |
|
12-13 |
|
14-11 |
|
17-8 |
| Streak |
|
D1 |
|
D1 |
|
D1 |
|
D1 |
|
D1 |
| Avg
% |
|
-0.5 |
|
-0.3 |
|
-0.2 |
|
-0.3 |
|
0.02 |
| January 2015 Bullish Days: Data 1994-2014 |
| |
2,
5, 15 |
5,
9, 15 |
2,
9, 12, 16 |
6,
9, 12, 15 |
8, 9, 15, 16 |
| |
27,
28 |
16,
28, 30 |
20,
27, 28 |
27,
28 |
27, 28, 30 |
| January 2015 Bearish Days: Data 1994-2014 |
| |
8,
20-23 |
21 |
21,
22 |
21 |
21, 26 |
| |
|
|
|
|
|
|
January 2015 Strategy Calendar
|
|
By:
Christopher Mistal
|
January 31, 2015
|
|
|
|
Bargain Stock Free Lunch Licks
|
|
By:
Jeffrey A. Hirsch
|
January 31, 2015
|
|
|
The Santa Claus Rally is scheduled to start tomorrow. As defined on page 114 of the Stock Trader’s Almanac 2015 SCR is the last 5 trading days of the year and the first two of the New Year. As tax-loss selling abates and retail investors revel in holiday cheer, the pros left on The Street gobble up bargains and drive the S&P up an average of 1.5% over the 7-day period. Yale Hirsch discovered this phenomenon in 1972. But its real value is as an indicator. Santa’s failure to show tends to precede bear markets, or times stocks could be purchased later in the year at much lower prices. To wit: “If Santa Claus should fail to call, bears may come to Broad & Wall.”
In 1999-2000 the period suffered a horrendous 4.0% loss. On January 14, 2000, the Dow started its 33-month 37.8% slide to the October 2002 midterm election year bottom. NASDAQ cracked eight weeks later falling 37.3% in 10 weeks, eventually dropping 77.9% by October 2002. Saddam Hussein cancelled Christmas by invading Kuwait in 1990. Energy prices and Middle East terror woes may have grounded Santa in 2004. In 2007 the third worst reading since 1950 was recorded as subprime mortgages and their derivatives lead to a full-blown financial crisis and the second worst bear market in history.
This is the first indicator to register a reading in January. The seven-trading day period begins on the open on December 24 and ends with the close of trading on January 5. Normally, the S&P 500 posts an average gain of 1.5%. The failure of stocks to rally during this time tends to precede bear markets or times when stocks could be purchased at lower prices later in the year.
On January 8, our First Five Days “Early Warning” System will be in. In pre-presidential election years this indicator has a solid record. In the last 16 pre-presidential election years 12 full years followed the direction of the First Five Days; however, 2007 and 2011 did not. The full-month January Barometer has an even better pre-presidential-election-year record as 14 of the last 16 full years have followed January’s direction.
Our flagship indicator, the January Barometer created by Yale Hirsch in 1972, simply states that as the S&P goes in January so goes the year. It came into effect in 1934 after the Twentieth Amendment moved the date that new Congresses convene to the first week of January and Presidential inaugurations to January 20.
The long-term record has been stupendous, an 87.7% accuracy rate, with only eight major errors in 65 years. Major errors occurred in the secular bear market years of 1966, 1968, 1982, 2001, 2003, 2009, 2010 and possibly 2014. The market’s position on January 30 will give us a good read on the year to come. When all three of these indicators are in agreement it has been prudent to heed their call.
Lunch Licks
Some rather tasty morsels were served up in the list of stocks hitting new 52-week lows last Friday. From the initial batch of about 78 stocks on the NYSE, AMEX and NASDAQ that made a new 52-week low we boiled it down to 17 choice selections for our 2014 FREE Lunch Menu of Bargain Stocks. After we eliminated preferred stocks, funds, splits, special high dividends and new issues we cut stocks trading below $1.00. The remaining stocks had to average at least 25,000 shares per day over the last three months and have a market cap of at least $20 million. Finally, any stock that was not down 30% or more from its 52-week high to the 52-week low reached on Friday were also eliminated.
Unlike previous years, we suggested specific buy limits and stop losses for each stock included and the trades will be tracked in the Almanac Investor Stock Portfolios. It turned out to be a surprisingly diversified group of companies and several receive high marks from rating agencies. The market’s rally off last Tuesday’s low and the rebound in the energy stocks reduced the number of oil-related shares making new lows on Friday. Though there are two Oil & Gas Royalty Trusts on the list. The biggest group representing is three from the big winner of the year yet recently beleaguered biotech sector.
The remaining dozen: International Restaurants, Israeli Cellphone Services, Apparel Manufacturing, Metallurgical Coal Miner, Specialty Steel Manufacturing, Online Dating, Chinese Internet, Travel, Solar, 3D printer, HVAC & Compressor Manufacturing and Medical Products. We were able to get a position at our suggested buy limits or better in all but three stocks so far. Hanwha SolarOne (HSOL), Spark Networks (LOV) and Tecumseh Products (TECU) all ran up and never traded at or below our buy limits. Amazingly, TECU was up 87% at one point today – 130% more than Friday’s close. But you can’t get them all.
![[Free Lunch 2014 Table]](/UploadedImage/AIN_0115_20141223_Lunch.jpg)
Please remember, this “Free Lunch” strategy is not for the faint at heart. It is a quick, short-term strategy for sophisticated nimble traders. Folks tend to get rid of their losers near yearend for tax-loss purposes, often driving these stocks down to bargain levels. Over the years we have shown (STA 2015, page 112) that NYSE stocks trading at a new 52-week low on or about December 15 will usually outperform the market by February 15 in the following year. In the past 15 years we have added stocks from AMEX and NASDAQ and found that the most opportune time to compile our list is on the Friday of December triple witching which often further depresses already distressed equities and leaves plenty of time to capitalize on the Santa Claus Rally and January Effect.
If you buy these stocks, please note the following:
1. Consider selling them as soon as you have a significant gain and utilizing stop losses.
2. The stocks all behave differently and there is no automatic trigger point to sell at.
3. Standard trading rules from the Almanac Investor Stock & ETF Portfolios do not apply for these stocks.
4. We think you should be out of all of these stocks between the middle of January and the middle of February.
5. Also, be careful not to chase these stocks if they have already run away.
DISCLOSURE NOTE: At press time officers of the Hirsch Organization or the accounts they control, held positions in ARCO, BIND, CCIH, CEL, EPAX, IMGN, OGXI, OXM, SJT, SSYS, TNDM, WHX, WLT, and WOR.
|
2014 Free Lunch Served: Triple Witching Serves Up 17 Tasty New Lows
|
|
By:
Jeffrey A. Hirsch & Christopher Mistal
|
January 31, 2015
|
|
|
As a reminder, our “Free Lunch” strategy is purely a short-term strategy reserved for the nimblest traders. Traders and investors tend to get rid of their losers near yearend for tax loss purposes, often driving these stocks down to bargain levels. Research has shown that NYSE stocks trading at a new 52-week low on or about December 15 will usually outperform the market by February 15 in the following year. We have found that the most opportune time to compile our list is on the Friday of December triple witching which often further depresses already distressed equities and leaves plenty of time to capitalize on the Santa Claus Rally and January Effect.
To be included in this list, the stock must have traded at a new 52-week low on Friday, December 19, 2014. Then, preferred stocks, funds, splits, special high dividends and new issues are eliminated. To remain on this year’s list, the stock had to still be trading at $1.00 or higher as several online trading platforms place additional restrictions on a trade when shares are below $1.00. Furthermore, the stock had to average at least 25,000 shares per day over the last three months and have a market cap of at least $20 million. Finally, any stock that was not down 30% or more from its 52-week high to the 52-week low reached on Friday were also eliminated.
Unlike previous years, we have suggested specific buy limits and stop losses for each stock included and the trades will be tracked in the Almanac Investor Stock Portfolios.
If you buy these stocks, please note the following:
1. Consider selling them as soon as you have a significant gain and utilizing stop losses.
2. The stocks all behave differently and there is no automatic trigger point to sell at.
3. Standard trading rules from the Almanac Investor Stock & ETF Portfolios do not apply for these stocks.
4. We think you should be out of all of these stocks between the middle of January and the middle of February.
5. Also, be careful not to chase these stocks if they have already run away.
DISCLOSURE NOTE: Officers of the Hirsch Organization do not currently own any of the shares mentioned. However, we do plan to participate in the Free Lunch Strategy this year.
|
Stock Portfolio Update: Taking Profits on Airline Stocks & Free Lunch Invite
|
|
By:
Christopher Mistal
|
January 31, 2015
|
|
|
Investors tend to get rid of their losers near year-end for tax purposes, often hammering these stocks down to bargain levels. Over the years the Stock Trader’s Almanac has shown that NYSE stocks selling at their lows on December 15 will usually outperform the market by February 15 in the following year. When there are a huge number of new lows, stocks down the most are selected, even though there are usually good reasons why some stocks have been battered.
Our “Free Lunch” strategy is only a short-term strategy reserved for nimble traders. It has performed better after market corrections and when there are more new lows to choose from. The object is to buy bargain stocks near their 52-week lows and sell any quick, generous gains, as these issues can often be real dogs. Last year’s basket of 18 stocks produced a 25.7% average return from the close on December 20, 2013 through the close on January 21, 2014.
This strategy has been profitable in 14 of the last 15 years with an average basket gain of 15.8%. Like nearly every asset class at the time, the “Free Lunch” trade was down 3.2% in 2007-2008, but it still outperformed the NYSE over the same period. This year’s “Free Lunch” stock basket will be emailed before the market opens on December 22. Unlike previous years, we will provide specific buy limits and stop losses for each stock included and the trades will be tracked in the Almanac Investor Stock Portfolios.
Stock Portfolio Updates
Since last update in mid-November S&P 500 declined 0.7% through yesterday’s close. Russell 2000 slipped 0.2% over the same period while collectively the three Almanac Investor Stock Portfolios gained 1.2%. Our Small- and Mid-Cap portfolios performed best gaining 1.0% and 3.1% respectively. The Large-Cap portfolio slipped 0.8% due primarily to declines by Gildan Activewear (GIL), Icahn Enterprises (IEP) and Sunoco Logistic (SXL).
Falling commodity prices, crude oil in particular, have garnered much attention recently. Crude oil’s epic collapse this year has been a double-edged sword for the portfolios. Companies like Sunoco Logistic (SXL) and IEP have declined in sympathy while airline shares, Hawaiian Holdings (HA), Jetblue Airways (JBLU) and United Continental Holdings (UAL) have all soared. Crude oil could very well trade at $40 per barrel, but it is not likely to remain at that price for long. A price between $60-80 per barrel seems more likely as there is still sufficient incentive for companies to invest in exploration and future production while still being high enough to support the rapid development and deployment of alternative energy.
Profits have already been taken on HA (sold half the position when it first doubled) and although JBLU and UAL have not yet doubled from their original purchase prices, their recent price surge and increasingly muted response to further declines in crude oil price warrants at least considering taking partial profits now. Sell 1/3 of your position in UAL and JBLU when total position gain equals or exceeds 40%. For tracking purposes, 1/3 of our UAL position will be sold using today’s closing price.
From Tuesday’s Seasonal Sector Trades Alert, new trade idea Global Brass and Copper Holdings (BRSS) appears in the Small-Cap portfolio. This trade was initiated as a way to play seasonal strength in copper that typically begins in mid-December and can last until mid-April. BRSS can still be considered at current prices. Additionally, Southern Copper (SCCO) can be considered near current levels. Due to broad commodity weakness, due in varying amounts to tepid global growth, U.S. dollar strength and general malaise, typical seasonal gains are likely to be less than normal or may not even materialize at all. If purchased, pay close attention to BRSS and SCCO stop losses.
With yearend approaching quickly, all positions except BRSS and SCCO are on Hold. Recent gains have resulted in numerous stop losses being increased. Please see full portfolio table, below, for most recent advice.
Disclosure Note: At press time, officers of the Hirsch Organization, or the accounts they control, held positions in IEP, IIIN, LAD, LDL, PII, STLD, SXI and UNH.
|
Seasonal Sector Trades: Looking for Corn & Copper to Overcome Commodity Stigma
|
|
By:
Christopher Mistal & Jeffrey A. Hirsch
|
January 31, 2015
|
|
|
Copper has a tendency to make a major seasonal bottom in December and then a tendency to post major seasonal peaks in April or May. This pattern could be due to the buildup of inventories by miners and manufacturers as the building construction season begins in late-winter to early-spring. Auto makers are also preparing for the new car model year that often begins in mid- to late-summer. Traders can look to go long a May futures contract on or about December 12 and hold until about February 23. In this trade’s 42-year history, it has worked 28 times for a success rate of 66.7%. This trade has produced gains in ten of the last thirteen years. Losses were in 2006 (end of housing bubble), 2012 (copper peaked in February) and 2013 (peaked in late December as emerging market growth slowed).
Cumulative profit, based upon a single futures contract excluding commissions and fees, is a solid $78,025. Nearly one-fourth of that profit came from 2007, as the cyclical boom in the commodity market magnified that seasonal price move. However, this trade has produced other big gains per single contract, such as a $14,475 gain in 2011, and even back in 1973, it registered another substantial $9,475 gain. These numbers show this trade can produce big wins and big losses if not properly managed. A basic trailing stop loss could have mitigated many of the losses.
![[Long Copper (May) Trade History Table]](/UploadedImage/AIN_0115_20141209_HG_History.jpg)
Let’s consider a stock that mirrors the price moves of copper. The chart below has Global Brass and Copper Holdings (BRSS) prices overlaid on copper. This company primarily operates in the U.S. as a converter, fabricator and processor of copper and brass products. BRSS is not a mining company; they are essentially a recycler that produces sheet, strip, foil, rod, tube and similar products from processed scrap, used copper cathodes and other refined metal sources. Although based in the U.S., BRSS also has some operations in China, Japan, United Kingdom and Germany.
![[Copper (HG) Bars, Global Brass and Copper Holdings (BRSS) Closes and Seasonal Pattern Chart (Weekly Data November 2013 – December 9, 2014)]](/UploadedImage/AIN_0115_20141209_HG_Seasonal.jpg)
Year-to-date, BRSS has had a difficult year, down roughly 25% as of today’s trading. Revenues are down with the price of copper, but BRSS remains profitable and is paying a dividend. Should typical seasonal strength in copper materialize, BRSS is highly likely to climb higher with copper. Although BRSS’s technical picture is improving with a recent MACD buy confirmation signal and improving relative strength, it could still be susceptible to further tax-loss selling pressure before yearend. BRSS could be bought on dips below $12.33. If purchased, a stop loss of $10.05 is suggested. This trade will be tracked in the Almanac Investor Small-Cap Stock Portfolio.
![[Global Brass and Copper Holdings (BRSS) Daily Bar Chart]](/UploadedImage/AIN_0115_20141209_BRSS.jpg)
Yet another option to take advantage of copper’s seasonal move is iPath DJ-UBS Copper TR Sub-Index ETN (JJC). As a reminder, ETNs differ from ETFs. An ETN is debt whose current value is based upon an index return. In the case of JJC, it is linked to the Dow Jones-UBS Copper Total Return Sub-Index which represents the potential return of an unleveraged investment in copper futures. JJC trading volume is on the light side, trading a little more than 20,000 shares per day on average over the past three months, but it does pick up when copper moves. JJC could be bought on dips below $34.75. Once purchased a stop loss of $32.50 is suggested. This trade will be tracked in the Almanac Investor ETF Portfolio.
Corn Bounces on Seasonal Cue
In the United States and many other parts of the world, one would find life without corn difficult, as it has an extremely diverse range of uses. Corn is used as a basic food staple, to manufacture plastic, and for nearly everything in between. Most recently, growing demand from ethanol production and animal feed has resulted in a tightening of supply and the increasing concern of potential shortages.
Weather plays a significant role in corn production. Excess rain or cold weather can delay planting, and once the corn is in the ground, drought can be a threat to the harvest. The crop is most vulnerable to weather conditions in June and July in North America. Prices tend to make seasonal lows in the fall at harvest, when there is an abundance of supply, and then begin to rise steadily until spring planting begins.
![[Corn (C) Bars and Seasonal Pattern Chart (Weekly Data Nov 2013 – December 9, 2014)]](/UploadedImage/AIN_0115_20141209_Corn_Seasonal.jpg)
Our best percentage trade suggests buying corn’s July futures contract in the first half of July and holding until mid-January. Since 1970, this trade has been successful 28 times in 44 years, 63.6% and from 2003 to 2011 this trade racked up nine consecutive gains. In 2012, summer drought sent corn soaring in June and July. When the crop came in better than expected in the fall, there was only one way for price to go, down. Last year, the trade would have been successful if the long position was maintained in early spring. This year, corn bounced off multi-year lows touched in early October and has been rallying since.
![[Long Corn (July) Trade History Table]](/UploadedImage/AIN_0115_20141209_Corn-History.jpg)
Outside of the futures market, Teucrium Corn (CORN) is a “pure” ETF to trade the commodity corn. CORN has over $100 million in assets consisting of CBOT corn futures contracts. CORN holds the second-to-expire, third-to-expire and the December contract following the third-to-expire contract. This strategy attempts to reduce the negative effects of backwardation and contango. CORN can be bought on dips below $25.75. If purchased, set a stop loss at $23.75. This trade will also be tracked in the Almanac Investor ETF Portfolio.
|
ETF Trades: Riding the Yearend Rally
|
|
By:
Christopher Mistal
|
January 31, 2015
|
|
|
Over the course of this year, we have compared 2014 to past midterm years and more specifically midterm years that were also sixth years of presidential terms. Prior to this year there were seven previous presidents that served a sixth year in office since 1901; Presidents Wilson (1918), Roosevelt (1938), Eisenhower (1958), Nixon (1974, resigned after completing more than half the year in office), Reagan (1986), Clinton (1998) and G.W.Bush (2006). President McKinley was elected to a second term, but was assassinated in his fifth year in office. Once again the one-year seasonal pattern for Sixth Years is compared to all midterm years and 2014 year-to-date in the following charts.
![[DJIA Sixth Years, Midterm years & 2014 Seasonal pattern chart]](/UploadedImage/AIN_0115_20141204_DJIA-Sixth_Seasonal.jpg)
![[S&P 500 Sixth Years, Midterm years & 2014 Seasonal pattern chart]](/UploadedImage/AIN_0115_20141204_SP500-Sixth_Seasonal.jpg)
Whether you are a believer or not in seasonal patterns and analysis, it is difficult to ignore the fact that DJIA and S&P 500 have tracked the Sixth Years seasonal pattern rather well in 2014. January proved to be a tough month, but from the beginning of February into the third quarter, DJIA and S&P 500 both moved steadily higher just as they had both done in previous Sixth Years. However, rather than peaking early in the third quarter, they continued higher until mid-September before crumbling into mid-October. And from their October lows, DJIA and S&P 500 rocketed higher, just as the Sixth Year pattern does.
Now the Sixth Year pattern is suggesting a brief period of consolidation before the market resumes its march higher into yearend. This pause is likely to last until mid-December and DJIA and S&P 500 could finish the month around 2% higher than they are currently trading.
Portfolio Updates
Typically, the upcoming month’s trade ideas would be presented at this time. However, just one short sector seasonality begins in January, Computer Tech. Based upon the most recent 5-year track record of this trade, found on page 94 of Stock Trader’s Almanac 2015, posting an average loss of 0.9%, we will pass on this trade for now. The longer-term, 15-year track record is still respectable and worth a second look in early January. Should a solid short-trade setup present itself then, a new trade idea will be considered.
As a reminder, three sector seasonalities come to an end in December: Gold & Silver, Semiconductor, and Telecom. Gold & Silver related positions were stopped out or cancelled in early September. iShares DJ US Telecom (IYZ) and iShares PHLX Semiconductor (SOXX) are on Hold. IYZ has been struggling and its technical picture is also weak. Rather than outright selling IYZ, employ a very tight stop loss at $29.67. SOXX is an entirely different situation having surged higher with the broad market. As of the close on December 3, SOXX was up 16.3% since being added to the portfolio on October 21. Beginning with today’s SOXX closing price a 5% trailing stop loss, based on closing price, is suggested. Stop only if SOXX closes below this trailing stop.
SPDR Gold (GLD) was added on November 12 to take advantage of gold’s seasonal tendency to rally from mid-November to early December as featured in Commodity Trader’s Almanac 2013. This trade has been moderately successful this year with GLD gaining 3.9% through yesterday’s close. But, this brief seasonality is coming to an end and GLD is already starting to show signs of fatigue. Sell GLD. For tracking purposes, GLD will be closed out of the portfolio using today’s closing price.
Per last month’s advice, CurrencyShares British Pound (FXB) and CurrencyShares Euro (FXE) have been closed out of the portfolio. Relatively solid U.S growth, when compared to Europe, has kept a bid under the U.S. dollar. As a result, typical seasonal strength in the British pound and the euro never materialized. Modest losses of 1.8% for FXB and 1.7% for FXE were realized.
Overall, the market’s performance since last update has translated into respectable gains for most positions held in the ETF portfolio. Healthcare, biotech, semiconductor and transport related trades are performing best showing double-gains as of yesterday’s close. “Best Six/Eight Month” trade ideas, DIA, IWM, QQQ and SPY, are also performing well, up an average 7.0%. With major indices trading at or near all-time highs, the majority of the portfolio is on Hold.
Disclosure Note: At press time, officers of the Hirsch Organization, or accounts they control held positions in IBB, IWM, IYT, QQQ, SPY, UNG, VNQ, XLF, XLI and XLV.
|
November ETF Scoreboard: Crude Oil Crushed, But Just Another Typical Midterm Month
|
|
By:
Christopher Mistal
|
January 31, 2015
|
|
|
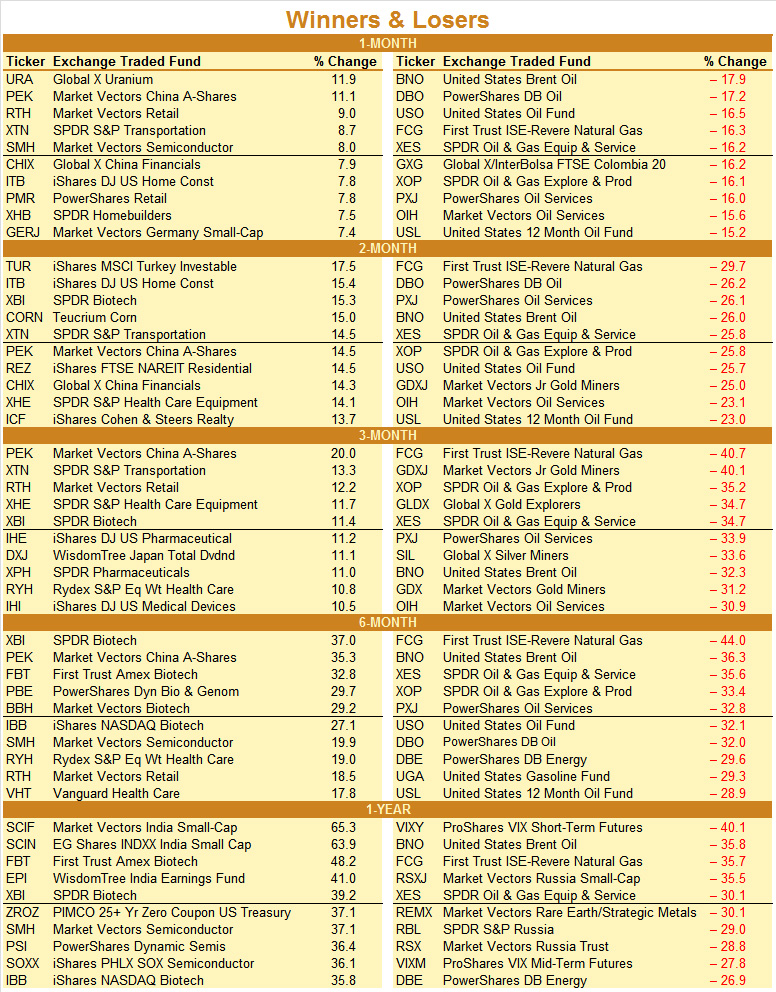
Although November got off to a sluggish start as traders and investors paused to reflect upon October’s sizable move and gains, the month ultimately succeeded in living up to its midterm-year reputation for solid gains. When trading ended in a dull half-day post-Thanksgiving-Day session, DJIA had advanced 2.5%, S&P 500 2.7% and NASDAQ 3.8% for the month. This performance was just slightly less than the average midterm November since 1950. Only the Russell 2000 small-cap index failed to live up to historical standards as it fell 0.02% in November compared to an average midterm November gain of 3.9% since 1982. Once again, DJIA, S&P 500 and NASDAQ all traded at new highs in the month. Russell 2000 has yet to eclipse its closing high from earlier this year in March.
Gains were widespread across most ETF sectors last month with 22 of 29 advancing. The top five sectors were: Semiconductors (+6.7%), Software (+5.0%), Technology (+5.0%), Consumer (+4.9%) and Healthcare (+3.2%). Market Vectors Semiconductor (SMH) gained 8.0% in November, good enough for the fifth best, non-leveraged ETF performance in the 1-Month winners list. This gain was surpassed by SPDR S&P Transportation (XTN) up 8.7%, Market Vectors Retail (RTH) up 9.0%, Market Vectors China A-Shares (PEK) plus 11.1% and Global X Uranium (URA), climbing 11.9%.
Overall, the mix of China, Retail, Housing and Transportation related ETFs that rounded out the 1-Month winners list is an encouraging sign as all four represent substantial portions of U.S. and global growth, both actual and the apparently improving prospects for the future. A 7.4% advance by Market Vectors Germany Small-Cap (GERJ) is also notable as small-cap stocks tend to led following shifts in market sentiment and/or direction. Since Germany is widely recognized as the backbone of the European Union, any pickup in economic activity there is usually a positive indication for the rest of Europe.
Of the seven sectors that declined in November, Energy was the worst, off 8.7%.The majority of the declines were directly attributed to the decline in crude oil last month, especially on the last two days of November when OPEC did not trim production. United States Brent Oil (BNO) was the biggest loser, declining 17.9% in November and 35.8% over the past twelve months. As a result, all ten of the biggest 1-Month losers were either from the energy sector or directly related to crude. Global X MSCI Colombia (GXG) shed 16.2% as Columbia is a net exporter of crude and many of First Trust ISE-Revere Natural Gas (FCG) holdings are also directly exposed to the price crude oil. Crude oil remains seasonally weak through at least mid-December, but weakness can persist into February before a final low is reached.
New 52-Week Highs climbed modestly higher in November as major indices reached new highs while New 52-Week Lows shrunk slightly. Of the 281 New Highs, 250 were recorded during the last week of trading in November. Excluding Energy, Bear/Short and Natural Resources/Gold, New Highs were produced in all other sectors. New Lows were comprised mostly of gold and precious metals related funds early in November while later in the month, Energy and Bear/Short funds dominated. In short, this month’s ETF Scoreboard offers no evidence that the stock bull market is near its end yet.