|
September 2016 Trading & Investment Strategy
|
|
By:
|
August 30, 2016
|
|
|
|
|
September Outlook: September/October Correction Setting Up
|
|
By:
By Jeffrey A. Hirsch & Christopher Mistal
|
--
|
|
|
|
Since the post-Brexit rally and the break to new all-time highs the market has been on summer vacation. The blue chips have been off the grid, virtually flat since mid-July. Techs and small caps have been a bit stronger, but less so since mid-August. Only the small caps have been able to gain any ground the past two weeks.
This lack of momentum has been accompanied by even greater bullish sentiment with
Investors Intelligence Bullish Advisors % moving up to 56.7%, its highest level since mid-2015 – and it’s been over 50% for seven weeks now. CBOE Weekly Equity Only Put/Call ratio has been equally as complacent over the past two months in the 0.56-0.67 range.
The recent lack of momentum, added to all this frothy sentiment increases the risk of a pullback or correction in the near term. Mixed fundamental readings are not much help, but there seems to be enough good economic and corporate data to support the market and avoid a major pullback at this time, save some political, geopolitical or systemic market event that derails the bull.
While Hillary Clinton appears to have a solid lead, Trump has recently been trimming the large gap Clinton enjoyed a few weeks ago. It remains to be seen what impact the emergence of the Johnson-Weld Independent ticket will have and who they will steal votes from. The market has bullishly been tracking the
Incumbent Party Win trend since midyear. Trumps new surge and the rise of Johnson-Weld may be chipping away at the bullish trend.
Elevated bullish sentiment, lack of momentum, weak technicals and mixed fundamentals are setting up for some sort of September/October correction. This is typically a trouble spot for the market, especially the week after September Triple Witching, the end of Q3 and the beginning of October. How deep that correction is may depend on how strong or weak the Clinton campaign is. In the chart below you can see how much deeper and longer the average pullback is in September/October during election years when the incumbent party loses.
So be ready for a pullback after the usual bullish first half of September and for deeper declines should Clinton slip further in the polls. Either way, that pullback should make a nice entry point for the yearend rally.
Pulse of the Market
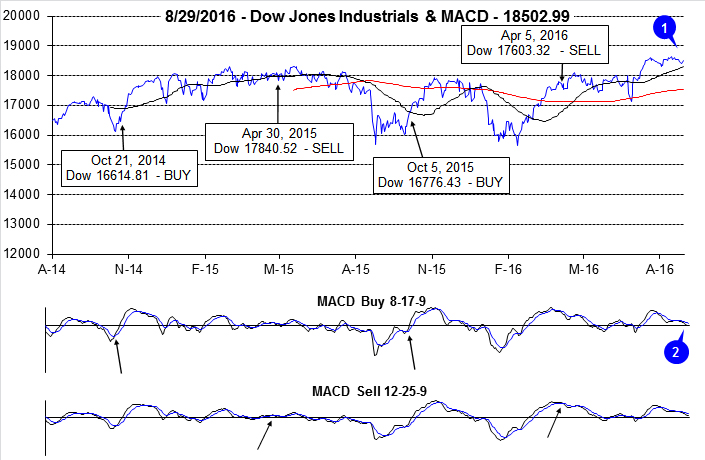
After breaking out to new all-time highs in July, DJIA has stalled and slipped into a narrow trading range (1) between about 18,200 and 18,700. Both the faster and slower MACD indicators applied to DJIA have been negative since the end of July (2), confirming the loss of upward momentum. Bullishly, DJIA has remained above its 50- and 200-day averages since recovering from Brexit aftermath in late June. But the rapidly rising 50-day average is currently only about 150 points below DJIA today.
Further confirmation of the market fizzling out can be seen in weekly performance over the past nine weeks. After four straight weeks of gains in July DJIA has seesawed back and forth between weekly gains and losses and has been modestly lower in three of the last five weeks (3). Two of the three weekly declines were accompanied by losses on Friday and the following Monday (4). Down Friday/Down Mondays have a track record of signaling and/or confirming a lack of confidence that frequently leads to further declines. S&P 500 (5) has the same weekly track record as DJIA over the last nine weeks.
After lagging for most of the year, NASDAQ put together an eight-week-winning streak (6) that has nearly brought its year-to-date performance in line with DJIA and S&P 500. During this weekly streak NASDAQ climbed 11.3% however; the vast majority of the gain occurred in the first few weeks and tapered off to only 0.1% in the final week of the streak.
NYSE Weekly Advancers and Decliners (7) over the last nine weeks have been trending in a direction that confirms the market’s waning momentum. Weekly Advancers have been slowly declining in number while Decliners are rising. NYSE Weekly New Highs peaked and Lows bottomed out (8) during the week ending July 15. This is further confirmation that the rally has fizzled.
Back-to-back Weekly CBOE Put/Call ratio readings under 0.60 (9) could also be a sign that the market has topped out in the near-term. Although 0.60 was once considered a neutral level, the recent trend has been any reading below this level, such as the 0.56 during the week ending July 15, has signaled an end to the majority of the market’s move higher.
Click for larger graphic…
|
Market at a Glance - 8/30/2016
|
|
By:
Christopher Mistal
|
--
|
|
|
|
8/29/2016: Dow 18502.99 | S&P 2180.38 | NASDAQ 532.33 | Russell 2K 1244.94 | NYSE 10811.35 | Value Line Arith 4968.80
Psychological: Troubling. According to the most recent
Investor’s Intelligence Advisor Sentiment survey bullish sentiment is still frothy. Bullish advisors stood at 56.7%, Bearish advisors were at 20.2%, while correction advisors are at 23.1%. The spread between bulls and bears remained at its highest level since early 2015 when the market last stalled. Although bullish sentiment is elevated, if does not mean a meaningful correction or pullback is imminent. Sentiment can remain highly bullish for extended periods of time especially if the market remains resilient.
Fundamental: Mixed. Second quarter earnings for S&P 500 companies were down 1.8% year-over-year, but better than the expected decline. Excluding energy the results would have been positive. New home sales surged in July, but existing home sales fell in July for the first time since February. July payroll gains were a whopping 255k and the unemployment rate held at 4.9%. Consumer speeding also rose for the fourth straight month in July. U.S. Q2 GDP was revised down to 1.1%. It seems for every positive there is an offsetting negative that is keeping overall progress in check. Fewer negatives are needed in order for the fundamental landscape to improve.
Technical: Range bound. DJIA, S&P 500 and NASDAQ all broke out to new all-time highs, Russell 2000 has not. Since the breakout momentum has waned and the major indices have slipped into a narrow trading range. DJIA, S&P 500 and NASDAQ have been essentially moving sideways for at least a month. Russell 2000 has climbed modestly higher. Stochastic, relative strength and MACD indicators all confirm the loss of momentum.
Monetary: 0.25-0.50%. The next Fed announcement is currently scheduled for September 21 and it will be accompanied by a Summary of Economic Projections and a press conference. Past projections have proven overly optimistic and this time will likely be no different. The Fed has repeatedly stated its data dependent nature and inflation is not where they want it. The multi-year trend is still lower, not higher even though there has been a modest pickup in CPI and PPI this year.
Seasonal: Bearish. Since 1950, September is the worst performing month of the year for DJIA, S&P 500, NASDAQ (since 1971), Russell 1000, and Russell 2000 (since 1979). September’s performance does improve slightly in election years, but it is still negative nearly across the board. Only the Russell 1000 and Russell 2000 have been able to escape negative territory and post modest 0.2% and 0.7% average gains.
|
September 2016 Strategy Calendar
|
|
By:
Christopher Mistal
|
August 25, 2016
|
|
|
|
|
September Almanac, Vital Stats & Calendar: Worst Performing Month Since 1950
|
|
By:
Jeffrey A. Hirsch & Christopher Mistal
|
August 25, 2016
|
|
|
|
Since 1950, September is the worst performing month of the year for DJIA, S&P 500, NASDAQ (since 1971), Russell 1000, and Russell 2000 (since 1979). September was creamed four years straight from 1999-2002 after four solid years from 1995-1998 during the dot.com bubble madness. Bullish election-year forces do little to improve on September’s poor overall performance over the same timeframe. September’s performance does improve slightly in election years, but it is still negative nearly across the board. Only the Russell 1000 and Russell 2000 have been able to escape negative territory and post modest 0.2% and 0.7% average gains respectively in the last nine election year Septembers.
![[September Election Year Stats]](/UploadedImage/AIN_0916_20160825_Sept_Election_Years.jpg)
Although the month has opened strong 13 of the last 21 years, once tans begin to fade and the new school year begins, fund managers tend to clean house as the end of the third quarter approaches, causing some nasty selloffs near month-end over the years. Recent substantial declines occurred following the terrorist attacks in 2001 (Dow: -11.1%) and the collapse of Lehman Brothers in 2008 (Dow: -6.0%). Solid September gains in 2010; DJIA’s 7.7%, S&P 500’s 8.8% were the best since 1939, but the month suffered nearly the same magnitude declines in 2011, confirming that September can be a volatile month.
September Triple Witching week is generally bullish with S&P 500 advancing nearly twice as many times as declining since 1990, but is has suffered some large losses. DJIA, S&P 500, Russell 1000 and 2000 recorded gains on Monday of expiration week for three straight years 2009-2011. NASDAQ has been down four straight years since. Triple-Witching Friday has been firm the past twelve years with every index advancing at least eight times. The week after Triple Witching has been brutal, down 22 of the last 26, averaging an S&P 500 loss of 1.1%. In 2011, DJIA and S&P 500 both lost in excess of 6%.
In recent years, Labor Day has become the unofficial end of summer and the three-day weekend has become prime vacation time for many. Business activity ahead of the holiday was more energetic in the old days. From 1950 through 1977 the three days before Labor Day pushed the DJIA higher in twenty-five of twenty-eight years. Bullishness has since shifted to favor the two days after the holiday as opposed to the days before. DJIA has gained in 15 of the last 22 Tuesdays and 16 of the last 21 Wednesdays following Labor Day.
| September (1950-2015) |
| |
DJI |
SP500 |
NASDAQ |
Russell
1K |
Russell 2K |
| Rank |
|
12 |
|
12 |
|
12 |
|
12 |
|
12 |
| #
Up |
|
26 |
|
29 |
|
24 |
|
18 |
|
20 |
| #
Down |
|
40 |
|
36 |
|
21 |
|
19 |
|
17 |
| Average
% |
|
-0.8 |
|
-0.5 |
|
-0.6 |
|
-0.7 |
|
-0.6 |
| 4-Year Presidential Election Cycle Performance
by % |
| Post-Election |
|
-0.7 |
|
-0.6 |
|
-0.3 |
|
-0.7 |
|
-0.7 |
| Mid-Term |
|
-1.0 |
|
-0.4 |
|
-0.8 |
|
-1.1 |
|
-0.6 |
| Pre-Election |
|
-1.0 |
|
-0.9 |
|
-0.9 |
|
-1.0 |
|
-1.6 |
| Election |
|
-0.4 |
|
-0.2 |
|
-0.2 |
|
0.2 |
|
0.7 |
| Best & Worst September by % |
| Best |
2010 |
7.7 |
2010 |
8.8 |
1998 |
13.0 |
2010 |
9.0 |
2010 |
12.3 |
| Worst |
2002 |
-12.4 |
1974 |
-11.9 |
2001 |
-17.0 |
2002 |
-10.9 |
2001 |
-13.6 |
| September Weeks by % |
| Best |
9/28/01 |
7.4 |
9/28/01 |
7.8 |
9/16/11 |
6.3 |
9/28/01 |
7.6 |
9/28/01 |
6.9 |
| Worst |
9/21/01 |
-14.3 |
9/21/01 |
-11.6 |
9/21/01 |
-16.1 |
9/21/01 |
-11.7 |
9/21/01 |
-14.0 |
| September Days by % |
| Best |
9/8/98 |
5.0 |
9/30/08 |
5.4 |
9/8/98 |
6.0 |
9/30/08 |
5.3 |
9/18/08 |
7.0 |
| Worst |
9/17/01 |
-7.1 |
9/29/08 |
-8.8 |
9/29/08 |
-9.1 |
9/29/08 |
-8.7 |
9/29/08 |
-6.7 |
| First Trading Day of Expiration Week: 1990-2015 |
| #Up-#Down |
|
17-9 |
|
14-12 |
|
10-16 |
|
14-12 |
|
11-15 |
| Streak |
|
D1 |
|
D2 |
|
D4 |
|
D2 |
|
D2 |
| Avg
% |
|
-0.1 |
|
-0.2 |
|
-0.4 |
|
-0.2 |
|
-0.3 |
| Options Expiration Day: 1990-2015 |
| #Up-#Down |
|
14-12 |
|
15-11 |
|
17-9 |
|
16-10 |
|
18-8 |
| Streak |
|
D1 |
|
D4 |
|
D3 |
|
D3 |
|
D3 |
| Avg
% |
|
0.03 |
|
0.1 |
|
0.1 |
|
0.1 |
|
0.2 |
| Options Expiration Week: 1990-2015 |
| #Up-#Down |
|
15-11 |
|
17-9 |
|
17-9 |
|
17-9 |
|
16-10 |
| Streak |
|
D1 |
|
D1 |
|
U3 |
|
D1 |
|
U1 |
| Avg
% |
|
0.001 |
|
0.2 |
|
0.1 |
|
0.2 |
|
0.3 |
| Week After Options Expiration: 1990-2015 |
| #Up-#Down |
|
5-221 |
|
4-22 |
|
9-17 |
|
5-21 |
|
7-19 |
| Streak |
|
D5 |
|
D5 |
|
D2 |
|
D5 |
|
D2 |
| Avg
% |
|
-1.2 |
|
-1.1 |
|
-1.1 |
|
-1.1 |
|
-1.7 |
| September 2016 Bullish Days: Data 1995-2015 |
| |
2,
8, 12, 13 |
1,
8, 9, 12-14 |
1,
8, 9, 13, 14 |
1,
8, 9, 12-14, 16 |
1, 7, 8, 12-14 |
| |
16,
29 |
16,
28, 29 |
16,
20 |
28,
29 |
16, 29 |
| September 2016 Bearish Days: Data 1995-2015 |
| |
19,
22, 23, 26, 30 |
22,
23, 26, 30 |
15,
22, 23, 30 |
22,
23, 26, 30 |
22, 23, 27 |
| |
|
|
|
|
|
|
ETF Portfolio Updates: Bonds & Utilities Continue to Perform
|
|
By:
Christopher Mistal
|
August 23, 2016
|
|
|
|
Earlier today, the U.S. Census Bureau released figures for sales of new single-family houses in July 2016. The headline figure was staggering at a seasonally adjusted annual rate of 654,000. This was a jump of 31.3% compared to July 2015 and 12.4% above June’s revised number of 582,000. These are not hard numbers, rather they are estimates based upon surveys. These eye-popping numbers should not be taken as cold hard fact and are likely to be revised (many times over). Nonetheless, they are positive for homebuilders and for U.S. economic growth at least in the short-term. Another possible explanation for the surge could be the constant teasing by the Fed to raise rates. Perhaps some buyers finally jumped off the fence in July out of fear of higher mortgage rates later on.
In addition to new home sales, we also track three other pieces of housing data: existing home sales, housing starts and the NAHB HMI. Since 2011 all four data sets have been steadily on the rise with some usual volatility. Existing home sales were least impacted when the housing bubble burst in 2006 and are the strongest, essentially at the same level they were back in 2001/2002.
New home sales and housing starts suffered overwhelming declines between late 2005 and their respective lows in 2011 and 2009. Both have staged solid recoveries, but remain below their averages going back to 1985 (dashed lines in charts below). The sharp rise in property taxes in many areas of the U.S. and the disadvantage new homes have (often assessed much higher than an equal, but older property) combined with demographic shifts suggest single-family home sales and construction could remain below their long-term average for much longer and possibly even indefinitely.
Lastly, the NAHB Housing Market Index (HMI) tends to be a good leading indicator for overall housing market health. HMI has frequently risen and fallen in advance of weakness in sales and starts data. This was clearly the case back in 2005 and 2006. HMI was upped briskly higher in 2012 just as the housing market recovery really began to gain traction and accelerate. Unfortunately, HMI appears to have topped in October 2015 and has slipped in 2016 perhaps signaling the current trend in housing is on the verge of slowing or worse yet reversing.
ETF Portfolio Updates
As is typically the situation in late-August, the Almanac Investor ETF Portfolio is rather slim with just 8 total positions and a defensive posture. August and September are the worst two months of the year, on average, for the market. In election years, the market has historically exhibited strength in August and has done so thus far and the market is not exactly running away either. This strength has afforded no opportunity to purchase iShares NASDAQ Biotech (IBB) or iShares DJ US Tech (IYW) yet. IBB and IYW can still be considered on dips below their respective buy limits.
Market strength also resulted in the sale of ProShares UltraShort S&P 500 (SDS). The market appears to have stalled out, but continues to flirt with new all-time highs resulting in SDS being stopped out on August 5 at $16.52, for a 5% loss. SPDR Energy (XLE) was shorted on August 8 using its average price that day as it gapped through resistance. XLE was subsequently stopped out when it traded above its stop loss of $70.05 on August 18 for a 2.7% loss. U.S. dollar volatility and renewed expectations for an OPEC production cut or freeze supported crude oil and the associated stocks of companies in the energy sector.
This month’s
Seasonal Sector Trades idea,
SPDR Gold (GLD) was added to the portfolio using its average daily price on August 5 when it gapped below its buy limit.
GLD is on Hold. GLD’s next move will likely depend on what the U.S. dollar does next and whether the stock market can regain lost momentum or not. Gold’s bullish seasonality typically lasts until late-September or early-October.
Despite the market’s resilience, defensive positions in AGG and TLT have held up. As of yesterday’s close, TLT was the best up 5.4%. AGG and TLT are on hold. Our position in Ranger Equity Bear (HDGE) has not performed, but the position’s loss could shrink if there is a modest market pullback. Continue to Hold HDGE.
Disclosure Note: At press time, officers of the Hirsch Organization, or accounts they control held positions in AGG, HDGE, SDS and TLT.
|
Stock Portfolio Updates: Rally Momentum Waning, Short Positions Remain on Hold
|
|
By:
Christopher Mistal
|
August 18, 2016
|
|
|
|
With a little help from the release of the Fed’s minutes from its last meeting yesterday, the market was able to mount a rally that spilled over into today, producing modest gains on both days. The wishy-washy nature of the Fed has once again convinced enough people that any rate hike is most likely to be later, not sooner. Low rates for longer also put downward pressure on the U.S. dollar which in turn has given a boost to crude oil. Even with the ongoing support of the Fed, the market’s current rally appears to be losing some steam. A bit higher in August is still likely, but afterwards a modest
pullback in September-October is not out of the question.
![[DJIA Daily Bar Chart]](/UploadedImage/AIN_0916_20160818_DJIA.jpg)
![[S&P 500 Daily Bar Chart]](/UploadedImage/AIN_0916_20160818_SP500.jpg)
![[NASDAQ Daily Bar Chart]](/UploadedImage/AIN_0916_20160818_NASDAQ.jpg)
In the above three charts of DJIA, S&P 500 and NASDAQ signs of a slowing rally are growing. DJIA is sitting at about the same place it was a month ago in mid-July. S&P 500 is a handful of points higher and only NASDAQ has made any substantial move higher over the past four weeks. Stochastic and relative strength indicators are bouncing around just under overbought. MACD has been negative on DJIA and S&P 500 charts since the end of July while NASDAQ MACD has visibly turned negative over the past three days. All of this does not preclude additional gains, but it does suggest any gain is likely to be unimpressive.
Portfolio Updates
In the four and a half weeks since last update, S&P 500 was up 0.7% and Russell 2000 gained 1.6% as of yesterday’s close. The Almanac Investor Stock Portfolio’s sizable cash position and short positions were a drag on performance. Overall, the entire Stock Portfolio slipped 3.6% lower over the same time period. Large-cap positions were the worst, down a disappointing 7.4% as long positions faltered and short positions went against it. Mid-Caps and Small-Caps also contributed to the overall decline, falling 3.2% and 2.8% respectively.
Due to recent overall market strength, short positions in Virtus Investment (VRTS), Vermilion Energy (VET), Cognex Corp (CGNX), Energen Corp (EGN) and Autodesk Inc (ADSK) have been stopped out. With the exception of Hi-Crush Partners (HCLP), all short trade ideas presented on July 12 have been traded. Those still in the portfolio are on Hold. The market, along with many of these short positions, has gone a long way in a relatively brief period of time which suggests a pause and/or possibly some sort of pullback is likely. Recent crude oil strength has also hindered many of the short positions as many were from the energy sector. There is still an excess of crude oil supply and demand will likely fade as the summer driving season begins to wind down after Labor Day.
Looking back to last year’s basket of short stocks, the
Almanac Investor Stock Portfolio was in a similar situation
last August as it is this August; many of the short positions initially went against it. However, when the market did break down later in the month and remained weak through much of September the short positions paid off handsomely with solid returns by the
mid-September 2015 update. In election years, August is usually a solid month, but much of the gains happen in the first half of the month. After this point the market frequently softens in
September through October. It is during this time that the current short positions could begin to shine.
Refer to the updated portfolio table below for Current Advice about each specific position. Also note that several stop losses have been updated.
Disclosure Note: At press time, officers of the Hirsch Organization, or accounts they control did not hold any positions in the stocks mentioned, but may buy or sell at any time.
|
Mid-Month Update: Mid-August to Election Day
|
|
By:
Christopher Mistal
|
August 16, 2016
|
|
|
|
At roughly the half-way point of August, the eleventh trading day of the month and yesterday’s close, DJIA was up 1.11%, S&P 500 0.76%, NASDAQ 1.94% and Russell 2000 1.80%. Some of these month-to-date gains were surrendered today, but the market is tracking August’s historical pattern in election years quite closely. As you can see in the following two charts, election-year Augusts follow a different pattern than all Augusts.
Election-year Augusts tend to start strong and remain in positive territory for the duration of the month while all Augusts over the most recent 21-year period have opened weak, bounced mid-month and finish in the red. In election years, around mid-month, NASDAQ and Russell 2000 tend to pull away from DJIA and S&P 500 to finish with an average gain of around 3%.
According to
Investor Intelligence Advisors Sentiment survey, bullish sentiment has been on the rise with the markets and is nearing lofty levels, but it is still not as frothy as it was, for as long as it was at the market’s top in May 2015. Bullish advisors were reported at 54.3% most recently compared to 59.5% in early 2015. Bears have retreated to just 20.9% and the correction camp is down to 24.8%. Bullish sentiment is elevated, but it has not reached truly worrisome levels yet which leaves plenty of room for the market to resume its advance in August.
Mid-August to Election Day Performance
Since 1950, the period from mid-August to Election Day in all years has a slightly bullish bias. DJIA and S&P 500 have advanced approximately 60% of the time with average gains of 0.3% and 1.0% respectively. This is actually rather impressive considering the propensity for market declines in August and September. But, since this time span also includes October, the month where numerous bear markets have ended and the subsequent rebound, it is actually not all that surprising.
However, in presidential-election years, the span from mid-August to Election Day over the same time period becomes somewhat mixed. With 2008 in the stats (and 2000 for NASDAQ), average gains shrink considerably with DJIA and NASDAQ posting average losses. The percentage of advances does increase for NASDAQ and Russell 2000. When 2008 is excluded from the stats there is a solid increase in average performance. DJIA jumps to an average gain of 0.8%, S&P 500 climbs to 1.6%, NASDAQ 2.2% and Russell 2000 3.8%.
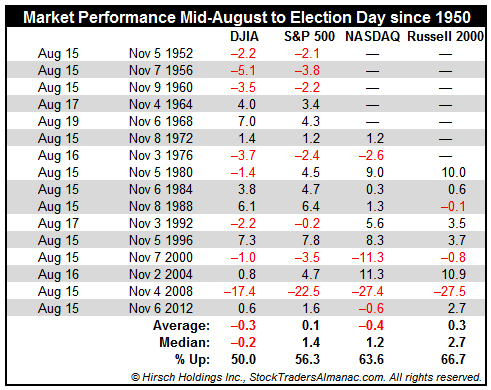
In the years that incumbent parties were victorious (shaded in grey), average performance improves nicely. Were it not for 1956, NASDAQ in 2012 and Russell 2000 in 1988, the record would have been perfect. When the incumbent party won, DJIA was up 2.4%, S&P 500 3.2%, NASDAQ 3.6% and Russell 2000 3.6% between mid-August and Election Day. With recent polls suggesting the Democrats are increasingly likely to maintain control of the White House, similar gains this year are also increasingly possible.
|
New Highs and A New Three Peaks & Domed House Pattern
|
|
By:
Jeffrey Hirsch & Christopher Mistal
|
August 11, 2016
|
|
|
|
Earlier this week updated Eighth Year of Presidential terms seasonal pattern charts for DJIA, S&P 500 and NASDAQ were presented. At that time it was noted that the market had most likely shrugged of the 8th year curse and were once again tracking the typical election year course which includes strength in July and August before some weakness in September and October.
In response to these charts inquiries were made regarding the impact that 2008 has on the election year pattern. This is quite reasonable given the magnitude of market declines in that year. DJIA shed 33.8% in 2008, S&P 500 plummeted 38.5% and NASDAQ plunged 40.5%. Losses were steep and rather consistent from start to finish in 2008 so it would seem that year could easily pull the overall election year performance lower.
![[DJIA 8th Year Chart]](/UploadedImage/AIN_0916_20160811_election_seasonal_ex2008_DJIA.jpg)
![[S&P 500 8th Year Chart]](/UploadedImage/AIN_0916_20160811_election_seasonal_ex2008_SP500.jpg)
![[NASDAQ 8th Year Chart]](/UploadedImage/AIN_0916_20160811_election_seasonal_ex2008_NASDAQ.jpg)
In the charts above, a fourth line has been added representing all election years excluding 2008. With 2008 removed there is virtually no change in the shape of the pattern and major rallies and pullbacks on the pattern remain intact. For DJIA and S&P 500, there was only an improvement of about 2% near the end. NASDAQ improved around 5%. The simple reason why there is just a modest improvement excluding 2008 is the number of election years since 1900. Our database has 28 election years since 1901 for DJIA, 21 since 1930 for S&P 500 and 11 since 1971 for NASDAQ. Even excluding 2008, the typical election year pattern still exhibits weakness in August and September, just a bit more on the mild side.
What Goes Up Must Come Down
As the market continues its push higher off the February and Brexit lows, we continue to evaluate when the next pullback may occur and how deep the next correction might be. As noted in the August Almanac and the election year chart above, August is notoriously much better in election years, while September/October corrections are still prevalent.
The new Three Peaks and a Domed House Top Pattern (3PDH) that may be developing can provide some guidance. The market’s recent breakout lines up quite well with the current Three Peaks lasting just 8 months from Peak 1 (point 3) in February/March 2015 to Peak 3 (point 7) in October/November 2015, falling right in the 8-10 time span of Lindsay’s Basic Model.
The Domed House top timeframe in the Basic Model is about 7 months from the end of the Separating Decline at point 14 to the top at point 23. From the Separating Decline low in February 2016 that would put the top some around or after September. But we have seen this phase of the pattern transpire in much shorter and longer time frames.
Whenever that top occurs, the pattern resolves at point 28, somewhere back around points 10 and 14 at a minimum. It can go substantially lower before a new high, which could culminate in a bear market. If the top occurs soon, I would expect another correction and not the 20%+ type of bear market, which from current levels is well below the February low. If this 3PDH top does not occur until September or later, perhaps around the election, then this 3PDH is more likely to resolve in a bear.
In some instances Point 27 has been higher than Point 23, so we could alternatively see a correction to Point 26 in September/October back around the May/June lows in 5-10% correction before the market rallies into the election and yearend. Furthermore the Point 23 3PDH top may not be transpiring at the moment and will occur later this year or early next, culminating in that aforementioned bear market.
It is also possible that this pattern fails to materialize and other analysis and indicators will be more instructive. But for now, with the market richly valued and sentiment high, caution is in order as a pullback of some sort is on the near-term horizon.
|
Market Shakes Off Worst-Case Eighth Year Scenario
|
|
By:
Christopher Mistal
|
August 09, 2016
|
|
|
|
At the close of trading yesterday, DJIA was up 6.3% year-to-date. S&P 500 was up a similar 6.7% and NASDAQ was up 4.1%. At these levels of performance DJIA and S&P 500 are slightly above average compared to past election years while NASDAQ is roughly in line with historical averages for this time of the year. Barring some disastrous exogenous event, the worst-case Eighth Year of Presidential terms scenario appears to be off the table.
Now that the 8th Year scenario is highly unlikely let’s turn attention towards the more likely typical election year pattern for the remainder of the year. Although August is typically a weak month, this is not the case in election years. Since 1952, DJIA and S&P 500 have averaged gains of 0.8% and 1.0% respectively in election-year Augusts. NASDAQ is even stronger, up 2.9% on average since 1972. However, once August ends and September arrives, back-to-school and back-to-work time, weakness does creep back into the picture.
Looking at the above three charts, an interim top is seen at the beginning of September for DJIA and S&P 500. NASDAQ strength tends to last slightly longer, until about mid-month September. Weakness then tends to persist until early- or mid-October before the market rebounds to close out the year on a positive note.
Some Room Left
The rally off of the Brexit lows has been impressive, but the nearly 20% across-the-board rise off of February’s lows is even more so. DJIA and S&P 500 closed out July with down to flat performance while NASDAQ simply charged higher into August. As a result, stochastic, relative strength and MACD indicators applied to NASDAQ are stretched. The same indicators on DJIA and S&P 500 charts are mixed. MACD is negative, but stochastic and relative strength are positive.
All three indices still have some room left to run before reaching projected monthly resistance levels (red dashed lines). DJIA could run until about 18800, S&P 500 2210 and NASDAQ 5300. Respective 50-day moving averages (magenta solid line) would be the first area of support on any pullback or weakness. For DJIA and S&P 500, their 50-day moving averages are right around last year’s old all-time highs.
Assuming the market does get derailed, either by economic data or by an unexpected event, the balance of 2016 could be relatively smooth sailing. The incumbent party in the presidential election has a solid lead in the polls, see page 28 of Stock Trader’s Almanac 2016 (STA16) which suggests gains from now until yearend. The last seven or eight months of election years since 1952 have been positive except in 1956, 2000 and 2008 (page 32 of STA16). And even the Worst Six Months in election years can be less challenging as detailed on page 62 of STA16.
This does not mean that buying now, at or near all-time highs, is the best move. The seasonal pattern charts back at the beginning suggests a better buying opportunity will be available sometime in September or October. This is further supported by the market performance following a
Hot July.
|
Seasonal Sector Trades: Gold’s Rally Likely to Continue
|
|
By:
Christopher Mistal & Jeffrey A. Hirsch
|
August 04, 2016
|
|
|
|
Historically, there is a strong price period for gold (shaded in yellow in chart below) from late August until late September or early October as demand increases as jewelers again stock up ahead of a the seasonal wedding event in India and also, as investors return from summer vacations. Entering long positions on or about August 26 and holding until October 1 has worked 23 times in the last 41 years for a success rate of 56.1%. In the 19 years since 1996, this trade has been profitable 13 times with a cumulative potential profit of $17,550 per single futures contract.
Sizable losses were suffered in 2011, 2013 and 2014; however this trade’s best performance ever was in 2012. In recent years, gold’s seasonal strength has begun earlier; in late July or early August and finished sooner; sometime in September to early October. Last year’s trade would have been profitable with an earlier entry and/or earlier exit.
Gold has rallied about 30% year-to-date after hitting multi-year lows late last year. This rally would suggest that golds multi-year bear market that started in September 2011 is over. Negative interest rates and continued monetary stimulus from many of the world’s central banks are also adding to gold’s appeal. Just today the Bank of England (BOE) cut its key lending rate to a record low of 0.25%. The BOE also announced plans to expand purchases of corporate and government bonds. Global growth concerns and the safe-haven trade are also supporting gold’s price.
![[SPDR Gold (GLD) Daily Bar Chart]](/UploadedImage/AIN_0916_20160804_GLD.jpg)
SPDR Gold (GLD) is an easy and cost effective way to execute this trade. It has over 31 million ounces of gold worth over $42 billion backing it and typically trades in excess of 10 million shares daily. Stochastic, relative strength and MACD indicators applied to GLD are all positive. GLD can be considered on a breakout above$131.75 or on dips below $128.85. If purchased an initial stop loss of $115.50 is suggested. This trade idea will be tracked in the Almanac Investor ETF Portfolio.
|
ETF Trades: Three Reasons Why Energy Stocks Could Decline Soon
|
|
By:
Christopher Mistal
|
August 02, 2016
|
|
|
|
August started off in somewhat typical fashion this year, selling off the first two days. We warned last week of
weakness the first trading day of August. History also suggests that the first nine trading days of August are also likely to be weak. Since 1988, S&P 500 has been down 17 times in 28 years during the first nine trading days of August. Its average loss has been 1.02% and the median decline is 0.72%. DJIA, NASDAQ and Russell 2000 each have one fewer loss over the same time period, but the average decline remains approximately 1.0%.
The tendency towards declines during the first nine days of August is likely due to an exodus from The Street as traders and investor kick it into summer overdrive mode as well as the fall off of excitement surrounding July earnings season. There appears to some correlation to July’s performance, but just barely. Following 14 S&P 500 July declines, 9 first-nine-trading-day periods in August were also down however, 14 S&P 500 up Julys were follow by 7 losing first-nine-day periods.
However, when the first two days of August are down we have often seen the bulk of the early August decline. Fourteen times the first two days of August were down since 1988, like 2016, the next seven days were down 8 times, but with a positive average gain of 0.05% and a median loss of -0.21%. When the first two days of August are up, the next seven are down 10 of 14 times with S&P 500 losses averaging -1.22% (median -0.95%).
New Trade Ideas for September Seasonalities
Oil’s historically weak seasonality begins in the beginning of September, usually lasts until the end of November and is based upon the AMEX Oil index (XOI). MACD, stochastic and relative strength indicators applied to XOI are all negative and have been so since mid-July. The average price decline of XOI during this period over the last 15 years has been 5.6% and this trade is setting up well, but a little early this year. First, oil has already dropped by over 20% since its early June highs. Second, gasoline inventories have not been declining as quickly as they typically do during the peak driving season. And third, inventories are still higher now than they were one year ago. When peak driving season comes to an end around Labor Day this year, oil, gasoline and energy stocks could easily fall faster and further than they typically do.
Aggressive traders may consider Direxion Energy Bear 3x (ERY) or ProShares UltraShort Oil & Gas (DUG) to take advantage of the sectors historically weak period however, both of these funds are leveraged and volatility is magnified. An outright short position in SPDR Energy (XLE) is the path we will take in the Almanac Investor ETF Portfolio. XLE has been trending lower since an early July top. It’s stochastic, relative strength and MACD indicators are all negative, confirming the trend lower. XLE could be shorted near resistance around $67.63 or on a breakdown through support around $64.97. A stop loss around $70.05 is suggested and profits can be taken if XLE falls below $57.46.
ETF Portfolio Updates
Per last update, United States Oil Fund (USO) was closed out of the Portfolio using its average price on July 6 for a 32.0% gain. Crude oil and USO have both fallen substantially since then. The short positions in SPDR Financials (XLF) and First Trust ISE-Revere Natural Gas (FSG) were also covered on the sixth for modest gains of 3.4% and 4.7% respectively.
Other recent trades include the covering of SPDR Materials (XLB) short position on July 15 when it closed above its stop loss along with the sale of iPath Bloomberg Livestock Sub-TR ETN (COW) and PowerShares DB Agriculture (DBA). COW and DBA both closed below their stop losses last month. All three positions were closed out with around a 5% loss for each.
A stellar July for the market afforded no opportunity to purchase iShares NASDAQ Biotech (IBB) or iShares DJ US Tech (IYW). IBB and IYW can still be considered on dips below their new buy limits. Due to the higher buy limits, stop losses and Auto-Sell prices have also be adjusted. See table below for updated IBB and IYW limits.
Our July S&P 500 short trade was executed somewhat early on July 8, but ProShares UltraShort S&P 500 (SDS) never closed below its stop of $16.52. With further market weakness possible, continue to Hold SDS.
Despite solid market gains for the full-month of July, defensive positions in AGG, HDGE and TLT have held up. As of yesterday’s close, TLT was the best up 5.3%. AGG, HDGE and TLT are on hold.
Disclosure Note: At press time, officers of the Hirsch Organization, or accounts they control held positions in AGG, HDGE, SDS and TLT.