|
October 2016 Trading & Investment Strategy
|
|
By:
|
September 29, 2016
|
|
|
|
|
Market at a Glance - 9/29/2016
|
|
By:
Christopher Mistal
|
September 29, 2016
|
|
|
|
9/28/2016: Dow 18339.24 | S&P 2171.37 | NASDAQ 5318.55 | Russell 2K 1255.67 | NYSE 10753.45 | Value Line Arith 4966.27
Psychological: Concerning. According to the most recent
Investor’s Intelligence Advisor Sentiment survey bullish sentiment is still elevated. Bullish advisors stood at 45.2%, Bearish advisors were at 23.1%, while correction advisors are at 31.7%. Weekly CBOE Put/Call ratio was 0.60 last week and is in the range that has recently been associated with interim tops.
Fundamental: Mixed. Yes, Q2 GDP was revised higher, but it only went from 1.0% to 1.4%. This level of growth is nothing to get excited about unless your only expectation is to avoid a recession. Even with this anemic growth, weekly initial jobless claims have remained below 300,000 for 82 straight weeks, a streak that has not been bested in decades. The housing market is seeing some weakness as new home sales slipped in August. Existing home sales were also weaker.
Technical: Diverging. DJIA and S&P 500 fell below their respective 50-day moving averages in early September and the 50-day average has been resistance since. NASDAQ briefly flirted with its 50-day, but quickly rebounded and even closed at a new all-time high. NASDAQ’s direction is likely to determine where the overall market and other major indices head next. If NASDAQ can hold gains and power higher, its strength will likely aid DJIA and S&P 500, but should NASDAQ begin to breakdown then DJIA & S&P 500 could easily trade down towards their respective 200-day moving averages.
Monetary: 0.25-0.50%. The next Fed announcement is currently scheduled for November 2, just six days before the next U.S. president will be elected. It is highly unlikely the Fed would raise rates then and this is confirmed by the CME Group’s FedWatch tool which currently shows just an 8.3% probability of higher rates. As much as the Fed likely wants to raise rates, it just doesn’t appear the U.S. economy has the momentum to allow for an increase.
Seasonal: Improving. October is the last month of the “Worst Six Months” for DJIA and S&P 500 and the last month of NASDAQ’s “Worst Four Months”. In election years, October ranks dead last, but excluding October 2008, ranking improves to mid-pack. Keep an eye out for our Official MACD Seasonal Buy Signal. It can trigger anytime on or after October 3.
|
October Outlook: End Q3, Octoberphobia Setting Up October Best Six Months MACD Buy Signal
|
|
By:
By Jeffrey A. Hirsch & Christopher Mistal
|
September 29, 2016
|
|
|
|
Ahead of the first presidential debate Monday night we made a fun little intra-office bet that the loser buys the winner a nice lunch. The bet was whether or not Trump would break down or blow up or lose it completely at some point during the debate. Jeff won the lunch as Chris conceded that Mr. Trump did not completely break down. Some political pundits even admitted that there were surprised Trump held up as well and as long as he did.
Mrs. Clinton is veteran debater and policy wonk, who clearly prepared well for the debate. On pure debating points, tone and manner, she was much more polished. However, for a rookie, Trump arguable held his own and did not blow up, though he missed plenty of opportunities to drive home Mrs. Clinton’s legacy of negative issues and present more solid policy points. Clinton also came up a bit short on really hammering her less experienced opponent and solidifying her position. Polls remain extremely narrow.
While Trump did not blow up, Chris’ expectation that whatever the outcome of the debate, the media would spend a massive amount of time on how bad Trump was and the market would rally after the debate did prove accurate. In any event for a first effort Trump managed to stay in the race and hold his ground. Perhaps he’ll step it up in the next two and give Clinton more of a run for her money.
More importantly, from our vantage point is that the market today is threatening to return to the downside after two days of bliss following the debate. The
Down Friday/Down Monday warning this week is looming large again. Spooked by a host of market events, the often treacherous end of Q3 portfolio adjusting by fund managers and some Octoberphobia, stocks are in retreat mode today.
News from Apple, Deutsche Bank, Wells Fargo and OPEC has the market in sell mode at this writing. U.S. equity indices have rallied off the mid-afternoon lows (which is historically the weakest part of the day), but it’s still rather red across the board. How we close out today should be instructive, as will tomorrow’s action on the
last trading day of Q3.
The 50-day moving average has been resistance for DJIA and S&P and serving as support for NASDAQ and Russell 2000. If S&P 500 cannot reclaim its 50 DMA and instead breaks down through its monthly pivot point around 2150, the early September lows near 2120 come into play. Then there is some support near 2100 around June’s highs. If that level does not hold then further support can be found just below the 200-day moving average near 2050.
However, this will be a solid set up for a quintessential October Buy. October is the best month to buys stocks, especially small caps and tech stocks. It’s even better after a pullback/correction. This current downside action is close to putting or MACD indicators into sell mode and setting up a solid “Best Six Months” Seasonal MACD Buy signal sometime on or after October 3. We will keep you posted. In the meantime, stay cautious and be patient.
Pulse of the Market
In early September DJIA abruptly plunged below its 50-day moving average after spending the previous two months solidly above (1). In the time since, DJIA has remained above its 200-day moving average, but has repeatedly failed to reclaim its 50-day average. DJIA’s 50-day average, currently right around 18400, is proving to be firm overhead resistance. As of yesterday’s close, both the slower and faster MACD indicators applied to DJIA were positive (2), but just slightly. A few days of weakness or a single day decline of about 270 points would result in a sell signal from the slower moving MACD indicator.
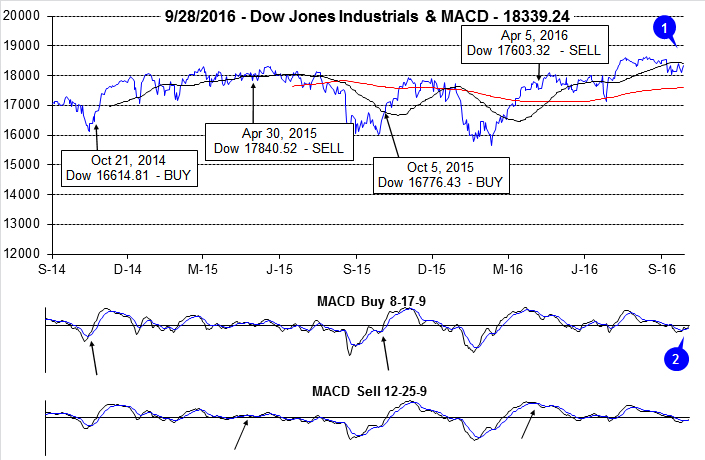
DJIA’s last closing new all-time high was 18636.05 on August 15, 2016. Including the Friday before this high was reached; DJIA has declined on six of the last seven Fridays (3). Weakness on Friday suggests traders and investors are reluctant to hold positions over the weekend which is a sign of concern and waning confidence. Further troublesome, three of these down Fridays were followed by down Mondays with back-to-back occurrences happening this past Monday (4). Historically, DJIA Down Friday/Down Monday incidences have preceded weakness sometime within the next 90 calendar days.
Despite all this Friday weakness DJIA, S&P 500 (5) and NASDAQ (6) have managed to eke out gains during three of the last four weeks. However, two-percent-plus across the board losses during the week ending September 9, DJIA and S&P 500 were lower last Friday than four weeks prior.
NYSE Weekly Advancers and Decliners (7) have been behaving as would be expected with one notable exception, the week ending September 16. In that week, DJIA and S&P 500 managed modest gains while NASDAQ leapt 2.3%, but NYSE Weekly Decliners outnumbered Weekly Advancers by a margin or nearly two to one. This ratio is more commonly associated with weekly losses. It also suggests the major indices moved higher on the backs of a fewer number of stocks. Meaningful advances typically require broader participation.
NYSE Weekly New Highs also plunged during the week ending September 16, from 456 to just 99. New Lows (8) climbed to 69. These unusual numbers may have been due to quarterly options expiration, but are still a concern.
Weekly CBOE Put/Call ratio at 0.60 (9) last week is suggestive of a near-term top. Recent past readings in the range of 0.56 to 0.60 were followed by mild weekly market weakness.
|
October 2016 Strategy Calendar
|
|
By:
Christopher Mistal
|
September 27, 2016
|
|
|
|
|
October Almanac, Vital Stats & Calendar: Much Better When Incumbent Party Retains White House
|
|
By:
Christopher Mistal & Jeffrey A. Hirsch
|
September 27, 2016
|
|
|
|
October has a frightful history of market crashes such as in 1929, 1987, the 554-point drop on October 27, 1997, back-to-back massacres in 1978 and 1979, Friday the 13th in 1989 and the 733-point drop on October 15, 2008. During the week ending October 10, 2008, Dow lost 1,874.19 points (18.2%), the worst weekly decline in our database going back to 1901, in point and percentage terms. It is no wonder that the term “Octoberphobia” has been used to describe the phenomenon of major market drops occurring during the month.
But October has also been a turnaround month—a “bear killer”. Twelve post-WWII bear markets have ended in October: 1946, 1957, 1960, 1962, 1966, 1974, 1987, 1990, 1998, 2001, 2002 and 2011 (S&P 500 declined 19.4%). However, eight were midterm bottoms. This year is neither a midterm year nor is a bear market in progress, thus October’s performance in past election years is of greater importance.
Election-year Octobers rank dead last for Dow, S&P 500 (since 1952), Russell 1000, and Russell 2000 (since 1980). NASDAQ fairs slightly better, with October being the second worst month in election years since 1972. Eliminating gruesome 2008 from the calculation provides a moderate amount of relief, as rankings climb to mid pack. Should a meaningful decline materialize in October it is likely to be an excellent buying opportunity, especially for any depressed technology and small-cap shares.
![[Election Year October Performance Table]](/UploadedImage/AIN_1016_20160927_Election-Year_Oct_Performance.jpg)
Another interesting aspect of election-year Octobers is the propensity for S&P 500 gains when the incumbent party ultimately retains the White House. Of the ten incumbent victories since 1944, the S&P 500 has advanced seven times, declined twice, and was unchanged in 1944 with an average October gain of 1.4%. Of the eight occurrences since 1944 when the incumbent was defeated, there were five S&P 500 declines and three advances in October. The average October decline when incumbents were defeated was 2.2%. Even excluding the S&P’s 16.9% plunge in 2008, incumbent defeats were still preceded by an average October loss of 0.1%.
![[S&P 500 Monthly % Change in Election Years since 1944]](/UploadedImage/AIN_1016_20160927_SP500_Election-Year_Table.jpg)
Options expiration week in October provides plenty of opportunity. On the Monday before expiration the DJIA has only been down seven times since 1980 and the Russell 2000 is up twenty of the last twenty-six years, seventeen straight from 1990 to 2006. Expiration day has a spotty record as does the week as a whole. After a market bottom in October, the week after is most bullish, otherwise it is susceptible to downdrafts.
October is also the end of the DJIA and S&P 500 “Worst 6 Months” and NASDAQ “Worst 4 Months”. Remain on the alert for our Seasonal MACD Buy Signal that can occur anytime beginning October 3. An email alert will be sent when it triggers. At that time we may establish new long positions in SPDR DJIA (DIA), SPDR S&P 500 (SPY), PowerShares QQQ (QQQ) and iShares Russell 2000 (IWM). We may also pickup any remaining open recommendations from the ETF Portfolio.
| October (1950-2015) |
| |
DJI |
SP500 |
NASDAQ |
Russell
1K |
Russell 2K |
| Rank |
|
7 |
|
7 |
|
6 |
|
5 |
|
10 |
| #
Up |
|
40 |
|
40 |
|
25 |
|
24 |
|
21 |
| #
Down |
|
26 |
|
26 |
|
20 |
|
13 |
|
16 |
| Average
% |
|
0.7 |
|
0.9 |
|
0.8 |
|
1.1 |
|
-0.2 |
| 4-Year Presidential Election Cycle Performance
by % |
| Post-Election |
|
0.7 |
|
0.9 |
|
1.2 |
|
0.8 |
|
0.2 |
| Mid-Term |
|
3.1 |
|
3.3 |
|
4.2 |
|
4.7 |
|
3.9 |
| Pre-Election |
|
-0.5 |
|
0.1 |
|
0.05 |
|
0.2 |
|
-1.9 |
| Election |
|
-0.8 |
|
-0.7 |
|
-2.1 |
|
-1.4 |
|
-2.6 |
| Best & Worst October by % |
| Best |
1982 |
10.7 |
1974 |
16.3 |
1974 |
17.2 |
1982 |
11.3 |
2011 |
15.0 |
| Worst |
1987 |
-23.2 |
1987 |
-21.8 |
1987 |
-27.2 |
1987 |
-21.9 |
1987 |
-30.8 |
| October Weeks by % |
| Best |
10/11/74 |
12.6 |
10/11/74 |
14.1 |
10/31/08 |
10.9 |
10/31/08 |
10.8 |
10/31/08 |
14.1 |
| Worst |
10/10/08 |
-18.2 |
10/10/08 |
-18.2 |
10/23/87 |
-19.2 |
10/10/08 |
-18.2 |
10/23/87 |
-20.4 |
| October Days by % |
| Best |
10/13/08 |
11.1 |
10/13/08 |
11.6 |
10/13/08 |
11.8 |
10/13/08 |
11.7 |
10/13/08 |
9.3 |
| Worst |
10/19/87 |
-22.6 |
10/19/87 |
-20.5 |
10/19/87 |
-11.4 |
10/19/87 |
-19.0 |
10/19/87 |
-12.5 |
| First Trading Day of Expiration Week: 1990-2015 |
| #Up-#Down |
|
21-5 |
|
19-7 |
|
18-8 |
|
20-6 |
|
20-6 |
| Streak |
|
U1 |
|
U1 |
|
U1 |
|
U1 |
|
D2 |
| Avg
% |
|
0.7 |
|
0.6 |
|
0.7 |
|
0.6 |
|
0.5 |
| Options Expiration Day: 1990-2015 |
| #Up-#Down |
|
13-13 |
|
17-9 |
|
17-9 |
|
17-9 |
|
12-14 |
| Streak |
|
U3 |
|
U3 |
|
U3 |
|
U3 |
|
D2 |
| Avg
% |
|
0.01 |
|
0.001 |
|
0.02 |
|
0.001 |
|
-0.06 |
| Options Expiration Week: 1990-2015 |
| #Up-#Down |
|
18-8 |
|
18-8 |
|
14-12 |
|
18-8 |
|
14-12 |
| Streak |
|
U1 |
|
U1 |
|
U1 |
|
U1 |
|
D1 |
| Avg
% |
|
0.7 |
|
0.8 |
|
1.1 |
|
0.9 |
|
0.7 |
| Week After Options Expiration: 1990-2015 |
| #Up-#Down |
|
16-10 |
|
14-12 |
|
15-11 |
|
14-12 |
|
14-12 |
| Streak |
|
U3 |
|
U3 |
|
U3 |
|
U3 |
|
U3 |
| Avg
% |
|
0.4 |
|
0.3 |
|
0.4 |
|
0.2 |
|
0.1 |
| October 2016 Bullish Days: Data 1995-2015 |
| |
6,
14, 20, 27, 28 |
4,
6, 14, 18-21 |
4-6,
13, 14, 20 |
4,
14, 18-21 |
6, 14, 20, 21, 31 |
| |
|
28,
31 |
21,
28, 31 |
28,
31 |
|
| October 2016 Bearish Days: Data 1995-2015 |
| |
7,
10, 25 |
7,
10 |
None |
10,
25 |
10, 25 |
| |
|
|
|
|
|
|
Mid-September Stock Basket: Use Dips to Accumulate
|
|
By:
Christopher Mistal
|
September 22, 2016
|
|
|
|
Since the beginning of July, NASDAQ has been the star and its leadership is continuing this week with another all-time high close today. NASDAQ was up 6.6% in July and 1.1% in August, and as of today’s close is up 2.4% so far in September. This is noticeably better than S&P 500 which was up 3.6% in July, down 0.1% in August and is currently up 0.3% for the month. For the month of September these results are better than
past election year averages, but there is still time remaining. These gains could hold or could just as easily vanish before month’s end.
![[DJIA Daily Bar Chart]](/UploadedImage/AIN_1016_20160922_DJIA.jpg)
![[S&P 500 Daily Bar Chart]](/UploadedImage/AIN_1016_20160922_SPX.jpg)
![[NASDAQ Daily Bar Chart]](/UploadedImage/AIN_1016_20160922_NASDAQ.jpg)
A month plus of sideways trading preceded an early September dip by DJIA, S&P 500 and NASDAQ. This action lead to a slow deterioration of Stochastic, relative strength and MACD indicators applied to all three indices. Strength the last two days has reversed that trend and all three technical indicators across all three indices are now positive. Tomorrow could prove pivotal in providing further confirmation that the market has regained traction and can sustain recent positive momentum. A solid gain on Friday would be a sign that confidence is returning. Over the last six Fridays, DJIA and S&P 500 have closed down. NASDAQ’s record is slightly better, but it has been down three of the last five Fridays.
Select Stocks for the “Best Months”
These 14 stocks all have reasonably solid valuations, healthy revenue and earnings growth, while exhibiting positive price and volume action as well as other constructive technical and chart pattern indications. The group of 14 covers a broad array of sectors and industries. It also runs the gamut of market capitalization with a mix of large caps with more than $5 billion in market value, midcaps in the $1-5 billion range, and small caps under $1 billion.
We first sifted through the universe of about 8,000 U.S. traded stocks for those with a market cap of at least $25 million and average daily volume of 50,000 shares or more on average over the past twenty trading sessions. Then we winnowed the list down to only those stocks with relatively low price-to-sales and price-to-earnings ratios. From there we looked for stocks that were exhibiting revenue and earnings growth.
With this list of about 50 stocks we dug into each individual company and chart before settling on these final 14 stocks. Our underlying theme was to find reasonably priced stocks quietly growing sales and earnings that are flying somewhat under the radar with few on The Street paying close attention to them. As market cap goes higher, this becomes increasingly challenging and a history of earnings surprises becomes even more important.
At the end of the screening process we found that homebuilders, technology, medical and financial industries were well represented in the basket. We did not search specifically for top-performing stocks within these sectors, this just happens to be where reasonable value and growth currently exist.
This basket is being presented in order to take advantage of the “Best Six Months” (November to April) for stocks. We will look to add these 14 stocks, in the table below, on dips. We will allocate a hypothetical $2000 from the cash position in the portfolio to each position. For each stock we have provided the ticker, name, sector, general business description, plus annual sales growth, PE, price-to-sales ratio, market value, a dividend yield and a suggested buy limit and stop loss.
|
ETF Trades: “Best Six/Eight Months” Buying Spree
|
|
By:
Christopher Mistal
|
September 20, 2016
|
|
|
|
For 50 years the new edition of the
Stock Trader’s Almanac has been released early in the fourth quarter. And for the past fifteen years we have been preparing
Almanac Investor readers for the annual October ETF buying spree. This year is no exception, but before delving into October’s seasonalities, let’s do a quick review for new and seasoned followers alike.
Every year while preparing the annual Almanac, we revisit and analyze our sector seasonalities (STA 2017 pages 94, 96 and 98) in depth in order to make adjustments for any new or developing trends. There have been a few minor revisions made to our Sector Seasonalities table in recent years, but for the most part, sector seasonality has been reasonably on track since September 2009 with many sectors producing the bulk of their annual gains during their traditionally favorable periods. Years of sector research allows us to specify whether the seasonality starts or finishes in the beginning third (B), middle third (M) or last third (E) of the month based upon the number of trading days in the month.
The 2017 Almanac table follows. Keen observers and long-time readers will note the absence of several indices. Indices that no longer appear are no longer being calculated or are not readily available in the public domain. In the place of discontinued indices we have added S&P Sector indices. Both long and short trade opportunities are researched and the most statistically viable appear below.
These entry and exit points will be the basis for our seasonal trades over the coming year. They are guidelines, as we generally look to enter new positions before the start of the favorable period and exit before its end. Occasionally a trade is closed out well in advance of the seasonality’s end. An outsized advance may trigger a trade at the suggested auto-sell price (a price target based upon past historical performance of the specific seasonality) or should strength fail to materialize, a stop loss could be reached.
There are twelve sector seasonalities that enter their favorable periods in October. The following trade ideas are made based upon these seasonalities. Currently, all buy limits are below current market levels. Should the market continue to struggle prior to our Seasonal MACD Buy Signal, triggering sometime on or after October 3, we want to take advantage of the pullback to begin accumulating the following new positions.
Trades for October Seasonalities
Transports enter their historically favorable season at the beginning of October and it runs until May. iShares DJ Transports (IYT) is attractive below current levels with a buy limit of $137.00. The stop loss is $123.30 and auto sell is $179.79. Top 5 holdings are: FedEx, United Parcel Service, Union Pacific, Norfolk Southern and Kansas City Southern. With nearly 70% of U.S GDP coming from consumers, seasonal strength in the consumer sector overlaps nicely with the transportation sector. If IYT trades below its buy limit, cover the IYT short trade and simultaneously establish a new long position.
![[iShares DJ Transports (IYT) Chart]](/UploadedImage/AIN_1016_20160920_IYT.jpg)
Over the last 15 years, Telecom has generated an average return of 8.1%, but for the last 5 years the average has slipped to 3.1% during its bullish seasonality from the middle of October through yearend. The top ETF within this sector is iShares DJ US Telecom (IYZ). Use a buy limit of $31.10 and stop loss of $27.99. If above average gains materialize, take profits at the auto sell of $36.98. Top 5 holdings are: AT&T, Verizon, Level Communications, T-Mobile and CenturyLink. Aggressive competition has not been kind to growth, but IYZ does boast a 2.33% yield and new product offerings could bring consumers in for an upgrade for the holidays.
![[iShares DJ US Telecom (IYZ) Chart]](/UploadedImage/AIN_1016_20160920_IYZ.jpg)
Semiconductors come into favor near October’s end and remain so until the beginning of December. This trade has averaged 12.9% and 7.5% gains over the last 15- and 5-year periods, respectively. iShares PHLX Semiconductor (SOXX) is the top selection. Establish new positions with a buy limit of $104.05 and utilize a stop loss of $93.65. Take profits at the auto sell of $129.22. Top 5 holdings are: Intel, Texas Instruments, QUALCOMM, NVidia and Broadcom. These are the companies that design and supply the brains for most of our favorite electronic devices; smart watches, smart phones, PCs, tablets, toaster ovens, basically you name it.
![[iShares PHLX Semiconductor (SOXX) Chart]](/UploadedImage/AIN_1016_20160920_SOXX.jpg)
Although consumer spending is spilt into two distinct sectors, Discretionary and Staples, their favorable seasons run concurrently from the beginning of October to the beginning of June in the following year. Over the past 15-years Discretionary has an average gain of 14.1% and Staples 8.4%. SPDR Consumer Discretionary (XLY) and SPDR Consumer Staples (XLP) are the preferred vehicles to execute these trades. XLY can be considered on dips below $75.35. An initial stop loss of $67.82 and an auto-sell at $94.57 are suggested. XLY Top 5 holdings are: Amazon.com, Comcast, Home Depot, Walt Disney and McDonald’s. XLP could be purchased on dips below $52.05. Set a stop loss at $46.85 and auto-sell of $62.06. XLP Top 5 holdings are: Procter & Gamble, Coca-Cola, Philip Morris, Altria and Walmart.
![[SPDR Consumer Discretionary (XLY) Chart]](/UploadedImage/AIN_1016_20160920_XLY.jpg)
![[SPDR Consumer Staples (XLP) Chart]](/UploadedImage/AIN_1016_20160920_XLP.jpg)
The line between Broker/Dealer and Banking sectors has become increasingly fuzzy in recent years with each sector averaging gains of 22.8% and 18.9% over the last 5 years, respectively. Instead of trading two smaller, somewhat less liquid ETFs, SPDR Financial (XLF) is the better choice. Use a buy limit of $19.05 and a stop loss of $17.15 once a position has been entered. The auto sell is $23.53. Its holdings cover all things financial from insurance companies to stock exchanges. Top 5 holdings are: Berkshire Hathaway, JPMorgan Chase, Wells Fargo, Bank of America and Citigroup. The Fed has delayed raising rates again and again and again, but at some point they will go higher. A steepening yield curve combined with a reasonably healthy labor market should give this group a boost. (Editor’s note: XLF chart has not been adjusted for the 9/16/2016 special dividend due to the restructuring of major S&P 500 sectors which gives real estate its own sector.)
![[SPDR Financial (XLF) Chart]](/UploadedImage/AIN_1016_20160920_XLF.jpg)
Yet another area exhibiting a reasonable amount of overlap is the Healthcare and Pharmaceutical sectors, at least as far as many ETFs are concerned. Healthcare has racked up a rather impressive 18.3% average return over the past five years while Pharmaceutical alone has been just 7.7%. SPDR Health Care (XLV) does an excellent job of representing both sectors and comes with the added bonus of holding several well-established biotechnology companies as well. XLV is attractive near current levels with a buy limit of $71.10. The stop loss is $63.99 and auto sell is $85.17. Top five holdings are: Johnson & Johnson, Pfizer, Merck, UnitedHealth Group and Amgen. Whether we like it or not, Obamacare seems to be here to stay. It mandated coverage or a fine and did little to control prices in the sector. Greater access to services and an aging population should translate into solid sector growth.
![[SPDR Health Care (XLV) Chart]](/UploadedImage/AIN_1016_20160920_XLV.jpg)
Materials have a favorable period that runs from the beginning of October through the beginning of May with historical returns of 18.1% over both the last 15- and 5- year periods. Buy SPDR Materials (XLB) with a buy limit of $45.15. Once purchased, set a stop loss of $40.64 and an auto sell of $58.65. Top 5 holdings are: Dow Chemical, Du Pont, Monsanto, Praxair and Ecolab. Tepid global growth has kept a lid on the materials sector and XLB is still below its highs from early 2015. Any under-investment now could easily lead to a supply crunch when growth does begin to accelerate resulting in higher prices for the products produced and eventually to higher profits and stock prices.
![[SPDR Materials (XLB) Chart]](/UploadedImage/AIN_1016_20160920_XLB.jpg)
Computer Tech comes into favor in early October and remains so until the beginning of January. This trade has averaged 13.7% and 7.7% gains over the last 15- and 5-year periods, respectively. SPDR Technology (XLK) is the top selection. Enter this trade with a buy limit of $45.90 and employ a stop loss of $41.31. Take profits at the auto sell of $57.41. Top 5 holdings are: Apple, Microsoft, Facebook, AT&T and Alphabet. Apple is the largest current holding, at 13.82% of total assets. Smartphones and tablets are continually replacing desktops and laptops. Cloud-based applications and storage are also growing. Many of XLK’s holdings are well positioned to profit from these trends either directly or indirectly.
![[SPDR Technology (XLK) Chart]](/UploadedImage/AIN_1016_20160920_XLK.jpg)
Real Estate has seen returns of 13.2% and 13.0% over the last 15 and 5 years respectively from the end of October to the beginning of May. Vanguard REIT (VNQ) is our choice this year. Use a buy limit of $82.05 and a stop loss of $73.85 once a position has been entered. The auto sell is $102.17. Top 5 holdings are: Simon Property, Public Storage, Prologis, Welltower and Equinix. Although sensitive to interest rates, this trade provides exposure to rental markets, commercial and residential, which have been performing well recently.
Portfolio Updates
Defensive positions in TLT, HDGE and AGG are on hold. We will likely continue to hold these positions until the “Best Six/Eight Months” officially begin sometime on or after October 3 when we issue our Seasonal MACD Buy Signal Alert.
iShares NASDAQ Biotech (IBB) and iShares US Tech (IYW) can be considered on dips below their respective buy limits. IBB and IYW buy limit, stop loss and auto-sell prices have been adjusted to take into account recent strength.
Disclosure Note: At press time, officers of the Hirsch Organization, or accounts they control held positions in AGG, HDGE and TLT. They did not hold any positions in the other ETFs mentioned in this Alert, but may buy or sell at any time.
|
Mid-Month Update: Seasonal Weak Spot After September Triple Witching
|
|
By:
Jeffrey A. Hirsch
|
September 15, 2016
|
|
|
|
So I guess that’s the end of our low volatility period. As we pointed out last week the end of
lengthy streaks of low volatility can be damaging to market performance. After not having an S&P 500 daily move greater than +/- 1% for 43 trading days since July 8th, we have had 4 in the last 5 days.
I am not convinced we will get all the way back to the 3PDH Separating Decline low at points 10-14 at this juncture, but the Brexit lows could be in play over the next several weeks.
The perennial trouble spot of late September just after Triple Witching and early October is converging with this ominous chart pattern. Election campaign machinations are ramping up now with less than two months left to Election Day. The first debate is in less than two weeks. Polls have narrowed to a statistical dead heat and the third party candidates are gaining some traction.
Typical September
September is still tracking the usual seasonal pattern somewhat closely. The month started out on the upside. Then we succumbed to some back-to-school weakness. Currently the market is attempting to mount the usual mid-month rally. (Today’s market action is not in the September 2016 chart below.) Recent volatility has clearly rendered September 2016 performance below average. As of todays close the S&P 500 is off -1.1% for the month of September to date.
Election-year
Septembers tend to be a bit more volatile and that’s precisely what we are getting this year. After the convention bounces and the summer break the rhetoric heats up in September just as fund managers and institutions begin to jockey for positon and readjust portfolios for yearend and the next administration. Throw in a few geopolitical events with North Korea, Russia and the Middle East and the market gets shaky.
Like most years, election years are prone to a correction in the two months leading up to Election Day, but this usually sets up a nice post-election and yearend rally. Continued risk avoidance is in order for the time being as our cautious stance continues to pay off.
|
Stock Portfolio Updates: Summer Doldrums Come to an End
|
|
By:
Christopher Mistal
|
September 13, 2016
|
|
|
|
It is official; the market’s
summer doldrums came to an end last Friday with S&P 500 shedding 2.45%. That day also ended S&P 500’s streak of trading days without a +/- 1% move at 43. Some will point to the Fed, others economic data, the election or some combination of these possible reasons for the spike in volatility and the market’s declines. Regardless of the exact reason, the outcome is stacking up to be rather
typical September market behavior.
![[DJIA Daily Bar Chart]](/UploadedImage/AIN_1016_20160912_DJIA.jpg)
![[S&P 500 Daily Bar Chart]](/UploadedImage/AIN_1016_20160912_SPX.jpg)
![[NASDAQ Daily Bar Chart]](/UploadedImage/AIN_1016_20160912_NAS.jpg)
In the above three charts of DJIA, S&P 500 and NASDAQ the damage from Friday’s decline and today is visible. DJIA and S&P 500 are spending a third day below their respective 50-day moving averages and below projected monthly support (green dashed line). NASDAQ was in a slightly firmer position before the past three days and remains so today, but it is testing monthly support and its 50-day moving average. MACD, Stochastic and relative strength indicators applied to DJIA and S&P 500 have been deteriorating since the end of July, NASDAQ since mid-August. It remains to be seen if the current spike in volatility will manifest into something more significant or simply fade away. The fact that September has an infamous history of volatility should not be dismissed.
Portfolio Updates
In the three and a half weeks since last update, S&P 500 was down 1.1% while Russell 2000 gained 0.7% as of yesterday’s close. The Almanac Investor Stock Portfolio’s sizable cash and short positions provided little buffer as numerous long positions weakened and several short positions strengthened. Overall the entire portfolio slipped 1.4%. Large-caps were the worst performing group off 5.7%. Small-caps declined 0.9% and Mid-Caps were flat, off 0.1%. However, today’s market weakness and crude oil decline is assisting our short positions.
August was a good month for small-cap stocks and that strength persisted into early September. Russell 2000 climbed 1.6% in August as DJIA and S&P 500 booked minor losses. As a result of this small-cap strength, three out of four small-cap short positions were stopped out. Pros Holdings (PRO), Hi-Crush Partners (HCLP) and Flotek Industries (FTK) have been closed out of the portfolio for losses. The single remaining small-cap short position, Lindsay Corporation (LNN) is on Hold.
Mid-caps were the least poor performing due to a modest improvement in two of its three existing short positions (MTDR and DRQ) even as its two long positions weakened. Short position gains were nearly enough to offset long position declines. All positions in the Mid-cap portfolio are on Hold.
The Large-cap segment of the portfolio suffered the most since last update. Tractor Supply (TSCO) was stopped out on September 8 when it closed below its stop loss of $79.03. TSCO was closed out at $70.13 (average price on the day) as it gapped lower on a sizable cut in earnings guidance. This was the second guidance cut this year and apparently TSCO is not immune to all of the woes of the broader retail sector. Las Vegas Sands (LVS) short position was also stopped out on September 1 following a report of solid revenue growth in July from Nevada casinos.
Continental Resources (CLR), a short position, is the worst performing of Large-cap positions as of yesterday’s close, but shares are down nearly twice as much as crude oil today. Looking at its chart, it is clear that CLR has gotten way ahead of itself since bottoming back in January/February at around $18 per share. CLR’s nearly 200% increase since then far exceeds the move in crude oil. CLR’s move may have been based upon the assumption that the crude oil glut would end soon, but the U.S. Energy Information Administration (EIA) now expects the glut to persist into 2017 which is likely to keep crude’s price in check. This is certainly not bullish news for the energy sector or CLR however; it could aid our bearish bets.
Refer to the updated portfolio table below for Current Advice about each specific position. Also note that several stop losses have been updated.
Disclosure Note: At press time, officers of the Hirsch Organization, or accounts they control did not hold any positions in the stocks mentioned, but may buy or sell at any time.
|
Lengthy Streaks of Low Volatility Damaging to Performance
|
|
By:
Jeffrey Hirsch & Christopher Mistal
|
September 08, 2016
|
|
|
|
It has been a usually quiet stretch for the market over the last month and a half or so since mid-July. After breaking out to new all-time highs in July, S&P 500 settled into a narrow range between 2140 and just under 2200. During this time S&P 500 has not had a daily move in excess of +/- 1% (on a closing basis) in 43 trading days including today. July 8 was the last day S&P 500 recorded a move exceeding 1%.
In late August we noted the streak
at 33 trading days. At that duration (and under the assumption that the streak would likely end soon) the subsequent trading action of all similar or longer past streaks was relatively benign. S&P 500 was up 1-Month after streaks of 33 or more trading days 50.9% of the time, but with an average loss of a modest 0.14%. 3-, 6- and 12-months later S&P 500 was up 60-70% of the time with respectable average gains. The 33-day streak table can be viewed
here.
![[43 Day S&P 500 Low Volatility Streak Table]](/UploadedImage/AIN_1016_20160908_43_counting_SP500_low_vol.jpg)
As of today’s close, S&P 500 has extended its streak of not exceeding +/– 1% to 43 trading days. When past streaks of 43 trading days or longer are examined there is a clear shift in S&P 500’s subsequent performance. At the 1-month point after such streaks ended S&P 500 turns more bearish advancing just 42.9% of the time and the average loss extends to –1.12%. Its 1-month median performance also takes a dive from positive 0.09% to negative 1.30%. Performance at the 3-, 6- and 12-month intervals also weakens. Average performance at 3- and 6-months after the streak ends becomes negative and percentage of “Up” occurrences slips to just above 50%. Average performance 1-year after the streak ends tumbles to just 3.86%.
Looking ahead the data bears out further reduction in subsequent performance when S&P 500 extended its streak beyond 53 trading days (shaded in light grey). At 53 trading days and beyond, 1-, 6- and 12-month later performance declines even further. History suggests the longer the current streak without a +/– 1% S&P 500 daily move runs, the greater the odds become for declines after it ends.
Jury Still Out on the Sell in May
In the face of all this low volatility, the market has held on to its Worst Six Months gains, bringing out once again the Sell in May naysayers. However, a look at page 32 and 62 of the Stock Trader’s Almanac 2016 will remind you that the Worst Six Months has been quite strong in election years. The positive mindset of electing a new commander in chief helps buoy U.S. equities throughout the second half of the year with only two losses in the last seven months of election years.
So with the S&P 500 up 5.9% so far for the Worst Six Months of 2016, it begs the question, if the S&P is up May-October this year what does that indicate for the next Best Six Months, this year and next as a whole? We’ve broken out the data into four tables: Great, OK and Bad WSM, plus Great and OK WSM in election years. With seven weeks left in the current WSM, the September/October disaster area upon us and the polls showing Trump gaining traction, it remains to be seen if the gains will hold.
In the table above of Great WSM, the next BSM is up 23 of 26 years with an average gain of 9.2%. The year as a whole is even better, down only once with an average gain of 20.9%. The following year is also pretty good, though not as much, up 73.1% of the time with an average gain of 10.1%. Note below how the year after really Bad WSM has been the best.
The table above shows years we deemed to have “OK” WSM in the range of +4.5% to –3.8%. With the 2016 WSM up 5.9% currently, it could easily slip into this category. The BSM following these years produced gains in only 65.4% of the years up 17 of 26 with an average gain of 5.3%. The year as a whole and the next year in this table were not as strong as the Great WSM in the first table. The whole year is up 80.8% of the time with an average gain of 8.5%. The next year is considerable weaker up only 61.9% of the times with an average gain of 4.9%.
The Bad WSM years show solid bounce back in the subsequent BSM with gains 80.0% of the times and an average gain of 6.5%. The whole year is horrible, down 80.0% of the time with average losses of –11.2%. The following year is the best of them all, up 86.7% of the times with average gains of 13.6%. Note that there are only two election years in the bunch, 1956 (Russian invades Hungary in October) and 2008 (Great Recession).
Since this is an election year and WSM is on the cusp of Great and OK, we broke out these election years. This table indicates that the greater the election year WSM gains are, the greater the likelihood of gains in the subsequent BSM, this year and next. However, as you can see from this table and the Bad WSM table, the post-election year, next year, is prone to weakness across the board.
|
ETF Portfolio Updates: Stick with Defense
|
|
By:
Christopher Mistal
|
September 06, 2016
|
|
|
|
Following six straight months of gains from February through July, DJIA declined 0.2% in August. S&P 500 had been up for five months straight before slipping 0.1% in August. NASDAQ and Russell 2000 performed better in August, up 1.0% and 1.6% respectively. Overall
August performance was weaker than past election years although not far off as tech and small-caps did outperform. As of last Friday’s close DJIA was up 6.12% year-to-date, S&P 6.66% and NASDAQ 4.84%. DJIA and S&P 500 are above average compared to past election years, but NASDAQ is still slightly below.
The market is now navigating the weakest part of the calendar year, September. Even in
election years the month has been challenging. This weakness is apparent on the following updated “Eighth Year” charts. In past election years, DJIA and S&P 500 have peaked early in September and then decline through mid-October. NASDAQ tends to rally until mid-September before surrendering its gains.
ETF Portfolio Updates
Over the past two weeks since last update, the market has been relatively quiet and so has the Almanac Investor ETF Portfolio. SPDR Utilities (XLU) is the oldest and best performing holding up 9.1% as of the close on September 2. Recent talk and increase speculation of a September Fed rate increase had pressured XLU throughout the month of August, but recent weak data, August jobs report, ISM-manufacturing and non-manufacturing, has reduced the odds of the Fed acting in September. Once again, lower rates for longer is creating a demand for higher-yielding assets such as XLU. With today’s gains, XLU’s technical outlook has improved. MACD and stochastic indicators are now positive and relative strength is improving. XLU is on Hold.
iShares 20+Year Treasury Bond (TLT) and iShares Core US Aggregate Bond (AGG) have been moving sideways since early August. Similar to XLU, TLT and AGG are off their respective July highs, but not as much. If data weakness persists and the Fed sits tight, further gains are possible. TLT and AGG are on Hold.
Recent Seasonal Sector Trade ideas, SPDR Gold (GLD) and ProShares UltraShort Bloomberg Oil (SCO) were both under water at last Friday’s close. Today’s tepid data and softer U.S. dollar gave GLD a boost today and this position is now positive. SCO was added last Friday using its average daily price as it gapped below its buy limit. SCO was down even more today as the weaker dollar lifted crude oil. GLD and SCO are also on Hold.
iShares NASDAQ Biotech (IBB) and iShares DJ US Tech (IYW) have still not traded below their respective buy limits. IBB did weaken in August while IYW continued its march higher. We will not give chase. IBB and IYW can still be considered on dips below their respective buy limits.
Our position in Ranger Equity Bear (HDGE) still has not performed. A key reason for this is the fact that stocks have held up well through the summer months. Continue to Hold HDGE, its loss could shrink if there is a modest market pullback in September and/or October or turn into a gain should a deeper correction transpire if seasonal weakness and election uncertainty materialize.
Disclosure Note: At press time, officers of the Hirsch Organization, or accounts they control held positions in AGG, HDGE and TLT.
|
Seasonal Sector Trades: Unemployment & Crude’s Seasonal Decline
|
|
By:
Christopher Mistal & Jeffrey A. Hirsch
|
September 01, 2016
|
|
|
|
August’s jobs report, scheduled to be released tomorrow morning, is being billed as the most important release of the year or something like that. A strong enough number (whatever that may be) could be sufficient to spur the Fed to raise its key interest rate later this month. June and July’s reports showed solid headline job growth that was well above expectation. A third month in a row would apparently make a trend that might be good enough for the Fed to act after sitting idle for the past nine months.
Consensus estimates are expecting a number around 180,000 tomorrow morning, but past August reports have a history of
misses and substantial revisions. The markets’ response to the report has been mixed over the last 15 years with average losses on the day for DJIA, S&P 500, NASDAQ, Russell 1000 and 2000. In the last 15 years, S&P 500 has moved in excess of 1% on the day seven times. Four were losers and three were winners. The worst loser was 2011 when zero jobs were initially reported. Tomorrow’s jobs report could easily be the catalyst that ends the
S&P 500’s low volatility streak at 39 days.
Crude Oil’s Seasonal Slump
Seasonally speaking, crude oil tends to make significant price gains in the summer, as vacationers and the annual trek of students returning to college in August creates increased demand for unleaded gasoline. The market can also price in a premium for supply disruptions due to threats of hurricanes in the Gulf of Mexico. However, towards mid-September, we often see a seasonal tendency for prices to peak out, as the driving and hurricane seasons begin to wind down. Crude oil’s seasonal decline is highlighted in yellow in the following chart.
![[Crude Oil (CL) Weekly Bars and Seasonal Trend Chart (Weekly Data Aug 2015 – September 2, 2016)]](/UploadedImage/AIN_1016_20160901_CL_Seasonal.jpg)
Shorting the February crude oil futures contract in mid-September and holding until on or about December 9 has produced 22 winning trades in the last 33 years. This gives the trade a 66.7% success rate and theoretical total gains of $108,270 per futures contract. Following three consecutive years of losses, this trade has been successful for four years straight. Last year’s trade resulted in the fourth largest profit yet as crude’s decline resumed in mid-October.
![[September Short Crude Oil (February) Trade History Table]](/UploadedImage/AIN_1016_20160901_CL_History.jpg)
Regardless of the nearly 100% rally in price from the February lows to its highs in mid-June, many of the fundamental issues that triggered crude’s slide from $100 per barrel in 2014 remain in place. Global growth is still anemic, the U.S. dollar is still hovering around multi-year highs and OPEC is still pumping as much as possible in a bid to shake out higher-priced production and maintain market share. Downside could be limited this year as lower prices are keeping production, outside of OPEC, in check and demand has been firm, at least according to weekly EIA data. Crude’s spring rally ended just above $50 per barrel in June and its recent bounce also ended just below $50. Three straight days of declines have crude currently trading under $44 and it appears to be making a run towards $40 and possible lower.
![[ProShares UltraShort DJ-UBS Crude Oil (SCO) Daily Bar Chart]](/UploadedImage/AIN_1016_20160901_SCO.jpg)
ProShares UltraShort Bloomberg Crude Oil (SCO) is the preferred vehicle to take advantage of seasonal weakness. SCO’s benchmark is the Bloomberg WTI Crude Oil Sub index which is comprised entirely of crude oil futures contracts. SCO is designed to return 200% of the inverse of the daily move of this index and has approximately $200 million in assets. Its expense ratio of 0.95% is about average for a leveraged, inverse ETF.
Crude oil’s recent weakness has resulted in a brisk rally for SCO. As a result, stochastic, relative strength and MACD Buy indicators are all positive. SCO could be bought on dips below $99.00. SCO will be tracked in the Almanac Investor ETF Portfolio. If purchased, an initial stop loss at $88.00 is suggested.