|
November 2016 Trading & Investment Strategy
|
|
By:
|
October 27, 2016
|
|
|
|
|
Market at a Glance - 10/27/2016
|
|
By:
Christopher Mistal
|
October 27, 2016
|
|
|
|
10/26/2016: Dow 18199.33 | S&P 2139.43 | NASDAQ 5250.27 | Russell 2K 1204.75 | NYSE 10528.19 | Value Line Arith 4836.99
Psychological: Neutral. According to the most recent
Investor’s Intelligence Advisor Sentiment survey sentiment is in neither excessively bullish nor excessively bearish. Bullish advisors stood at 47.1%, Bearish advisors were at 23.1%, while correction advisors are at 29.8%. Sentiment does not appear to be at either extreme which suggests there is room for the market to move higher. Weekly CBOE Put/Call ratio was 0.59 last week, another middling level that can support a move higher.
Fundamental: Mixed. Tomorrow we will get an advance estimate for Q3 GDP. According to the Atlanta Fed’s GDPNow model we will likely see a number around 2.1%. Not bad, but not great. Existing home sales, the largest portion of the housing market, appear to be plateauing. New home sales also appear to be settling into a sideways pattern. The labor market is exhibiting a similar pattern, weekly initial claims remain low and the unemployment rate is hanging out right around 5%.
Technical: Range Bound. Since breaking out in July and topping out in August, DJIA, S&P 500 and NASDAQ have essentially gone nowhere. DJIA and S&P 500 have been fighting to reclaim their respective 50-day moving averages since early September. NASDAQ’s chart is firmer by a slim margin. However, all appear stuck between their respective June highs and all-time highs. This resiliency suggests the market is waiting to see what happens on Election Day before making its next move.
Monetary: 0.25-0.50%. No one seems to expect much from the Fed’s November meeting next week just ahead of Election Day. A rate hike at the December meeting is increasingly possible, maybe, perhaps, feasible, if economic data is as good as expected or better. At this point, even if the Fed said “we are going raise rates in December” at the November meeting, we’d still be left wondering if they would actually follow through in December.
Seasonal: Bullish. November begins the “Best Six Months” for the DJIA and S&P 500, and the “Best Eight Months” for NASDAQ. November also marks the beginning of the best consecutive three-month span November-January. Election-year Novembers mixed though, # 1 DJIA & #2 S&P 500, but NASDAQ, Russell 1000 and Russell 2000 rank #8, #6 and #8 respectively. Sizable losses in 2000 and 2008 damage average performance and rankings.
|
November Outlook: Let The Good Times Roll!
|
|
By:
Jeffrey Hirsch & Christopher Mistal
|
October 27, 2016
|
|
|
|
Last night Jeff closed the opening session with a short presentation entitled “Election Perspectives from 50 Years on Wall Street,” followed by a workshop on “Tactical Investing And Sector Rotation: Avoiding Traps And Profiting From Trends” Shoot us an email if you’d like a copy of the slides. After mingling with attendees and other speakers in the morning, Jeff took the stage after lunch with the mission to corral this assembly of bright yet potentially long-winded market analysts.
Jeff shared our outlook that the typical correction in the two months before Election Day this election year has set up a quintessential October Buy for a post-election, yearend rally and the Best Six Months. He noted that the market being up about 4.5-5% year-to-date indicates the market is expecting another Democratic President. Jeff informed the room that while post-election years have been worse under new Republicans and midterm years have been worse for Democrats, either way the next bear market is likely to transpire over 2017-2018, setting up our
Super Boom Forecast.
Then we went down the line with outlooks from the panel and dove into the discussion. To sum it up, Boockvar, who contends that the long term bull market in bonds is officially over, backed up our bear call for the next two years after the Best Six Months and the first 100 days of the new President, saying that a bear market will likely be triggered by the imminent rise in long term interest rates and weaker economic growth.
Skousen was arguably the most bullish on stocks mostly due to the increase in the money supply, but is bearish on gold since his gold indicator recently gave a sell signal. (We are seasonally bullish on gold and own some GLD, as well as bullish on stocks for the next six months, unless the wheels come off.) We also discussed how his Gross Output (GO) metric is a better economic indicator than GDP and is indicating a slight weakening in the economy.
Mr. Grant maintains that it is not the level of money supply that is the issue, it is the rate at which it moves that matters most; hence the velocity of money, and that this whole negative interest rate environment is unhealthy and is likely not to end well. Grant, who is bucking for Fed Chair, is a firm believer that we should end the war on price discovery and leave it to the bond market to determine interest rates.
Peter Schiff asserted that the Fed may not even raise rates again in December and feels that even if they do; they will ease again real soon. Schiff is also concerned about the Fed’s talking-up-the-economy rhetoric. If the economy is so strong, why not raise rates more and sooner and faster?
We covered a great deal more on the economic and market prospects over the rest of the year and beyond including inflation and what the Fed and other central banks need to do to set things right and put us on better path to growth and a more robust economy. Thankfully the whole panel was recorded and will be available to stream or order online in the next week or so at
http://neworleansconference.com/ or you can call them at (504) 837-3033 to pre-order.
The market is likely to continue to waffle until after the election as the country and the world is a little on edge with this year’s unique circumstances. But after that we expect an upside move in November and through the Best Six Months and the first 100 days of the new President with some weakness in the first half of December and a January/February profit-taking break, save some longshot election result or a delay in the decision that derails the stock market.
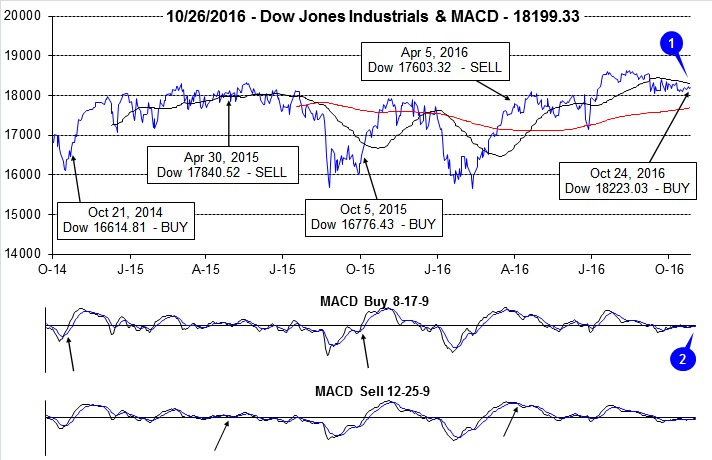
Pulse of the Market
On the close of October 24, 2016, criteria were satisfied and our Season MACD Buy Signal was issued (1). DJIA closed that day at 18223.03 which is just 1.1% higher than it was the first time it closed above 18,000 on December 23, 2014. That is 671 calendar days to gain a meager 1.1% excluding dividends. Our last two
Seasonal MACD Buy signals went on to produce returns of 7.4% and 4.9% (also excluding dividends) for comparison.
As of yesterday’s close, both the faster and slower MACD indicators applied to DJIA were positive (2) and trending higher even with tepid upside momentum. After Election Day, provided economic data holds up and corporate earnings continue to trend toward improving, the market is likely to move higher into yearend.
DJIA performance on Fridays (3) and Mondays (4) remains troublesome and indicative of a heightened level of nervousness by traders and investors alike. Over the past 20 weeks, DJIA has fallen on Friday twelve times and the following Monday eleven times. On six of occasions, losses were back-to-back triggering a Down Friday/Down Monday warning of higher probability for weakness sometime during the next 90 calendar days. The fact that the market has avoided any significant or sizable pullback or correction is a testament to its resiliency and underlying strength. Further improvement on Fridays and Mondays would be a welcome sign that could aid in propelling DJIA and the broader market decisively to new all-time highs.
After a respectable finish to Q3 with three straight weekly gains, DJIA, S&P 500 (5) and NASDAQ (6) declined in two of the last three weeks. Those declines were sufficient to delay our Seasonal MACD Buy Signal and reverse gains since mid-September.
NYSE Weekly Advancers and Decliners (7) have been behaving as would be expected with one notable exception, the week ending September 30. In that week, DJIA, S&P 500 and NASDAQ managed modest gains, but NYSE Weekly Decliners outnumbered Weekly Advancers. It suggests the major indices moved higher on the backs of a fewer number of stocks. Meaningful advances typically require broader participation and the three week rally ended that week.
NYSE Weekly New Highs (8) have been steadily slipping since their peak in mid-July at 659. Weekly New Lows have also been on the rise, albeit rather slowly. A reversal in both of these trends would assist in confirming the rally has resumed.
New this month (9), Moody’s AAA Corporate Bond Rate has been replaced with the 30-Year Constant Maturity Treasury Rate. Both rates typically move in similar direction and magnitude. The primary reason for the change is Moody’s AAA Corporate Bond Rate is no longer being tracked by the Fed. A daily value is still available from Moody’s, but the weekly value would need to be calculated by tracking a daily update from Moody’s while the 30-Year Treasury Rate (weekly) is still readily available at
https://fred.stlouisfed.org/series/WGS30YR.
Click for larger graphic…
|
November Almanac: Best Three Consecutive Months Begins
|
|
By:
Jeffrey Hirsch & Christopher Mistal
|
October 26, 2016
|
|
|
|
November begins the “Best Six Months” for the DJIA and S&P 500, and the “Best Eight Months” for NASDAQ. Small caps come into favor during November but don’t really take off until the last two weeks of the year. November is the number-three DJIA and number-two S&P 500 month since 1950. Since 1971, November ranks third for NASDAQ. November is best for Russell 1000 and Russell 2000 second best since 1979.
November maintains its status among the top performing months as fourth-quarter cash inflows from institutions drive November to lead the best consecutive three-month span November-January. The month has taken hits during bear markets and November 2000, down –22.9% (undecided election and a nascent bear), was NASDAQ’s second worst month on record—only October 1987 was worse.
November’s is a mixed bag in presidential election years. DJIA has advanced in 9 of the last 16 election years since 1952 with an average gain of 1.5%. Significant DJIA declines occurred in 2008 (-5.3%) and 2000 (-5.1%). For S&P 500 November ranks second with a similar record to DJIA. NASDAQ, Russell 1000 and Russell 2000 are not as strong ranking #8, #6 and #8 respectively. Fewer years of data (11 for NASDAQ and 9 for Russell indices) combined with sizable losses in 2000 and 2008 drag down rankings and average gains.
![[Election-Year Novembers Table]](/UploadedImage/AIN_1116_20161026_November_Election_Year.jpg)
Options expiration often coincides with the week before Thanksgiving. DJIA posted ten straight gains 1993-2002 and has been up 18 of the last 23 weeks before Thanksgiving. The Monday of expiration week had been streaky with the DJIA up five straight, 1994-1998, during the bulk of the last 20th Century bull market, down five in a row, 1999-2003, up three, 2004-2006, but has been mixed since 2007, up four and down four. The net result is a modestly bullish up eight of the last twelve. Options expiration day has a clearly bullish bias, up 12 of the last 14. The week after expiration has been improving lately with S&P 500, NASDAQ, Russell 1000 and 2000 up four straight.
Being a bullish month November has six bullish S&P days, though it does have weak points. NASDAQ and Russell 2000 exhibit the greatest strength at the beginning and end of November. Russell 2000 is notably bearish on the 12th trading day of the month (November 16, 2016), when the small-cap benchmark has risen just five times in the last 32 years (since 1984). The Russell 2000’s average decline is 0.49% on the day. Recent weakness around Thanksgiving has shifted DJIA and S&P 500 strength to mirror that of NASDAQ and Russell 2000 with the majority of bullish days at the beginning and end of the month. The best way to trade Thanksgiving is to go long into weakness the week before the holiday and exit into strength just before or after.
| November (1950-2015) |
| |
DJI |
SP500 |
NASDAQ |
Russell
1K |
Russell 2K |
| Rank |
|
3 |
|
2 |
|
3 |
|
1 |
|
2 |
| #
Up |
|
44 |
|
44 |
|
30 |
|
27 |
|
24 |
| #
Down |
|
22 |
|
22 |
|
15 |
|
10 |
|
13 |
| Average
% |
|
1.5 |
|
1.5 |
|
1.6 |
|
1.6 |
|
1.8 |
| 4-Year Presidential Election Cycle Performance
by % |
| Post-Election |
|
1.8 |
|
1.7 |
|
2.4 |
|
3.7 |
|
2.8 |
| Mid-Term |
|
2.5 |
|
2.6 |
|
3.7 |
|
2.7 |
|
3.5 |
| Pre-Election |
|
0.3 |
|
0.3 |
|
0.9 |
|
-0.2 |
|
1.2 |
| Election |
|
1.5 |
|
1.3 |
|
-0.6 |
|
0.5 |
|
-0.2 |
| Best & Worst November by % |
| Best |
1962 |
10.1 |
1980 |
10.2 |
2001 |
14.2 |
1980 |
10.1 |
2002 |
8.8 |
| Worst |
1973 |
-14.0 |
1973 |
-11.4 |
2000 |
-22.9 |
2000 |
-9.3 |
2008 |
-12.0 |
| November Weeks by % |
| Best |
11/28/08 |
9.7 |
11/28/08 |
12.0 |
11/28/08 |
10.9 |
11/28/08 |
12.5 |
11/28/08 |
16.4 |
| Worst |
11/21/08 |
-5.3 |
12/21/08 |
-8.4 |
11/10/00 |
-12.2 |
11/21/08 |
-8.8 |
11/21/08 |
-11.0 |
| November Days by % |
| Best |
11/13/08 |
6.7 |
11/13/08 |
6.9 |
11/13/08 |
6.5 |
11/13/08 |
7.0 |
11/13/08 |
8.5 |
| Worst |
11/20/08 |
-5.6 |
11/20/08 |
-6.7 |
11/19/08 |
-6.5 |
11/20/08 |
-6.9 |
11/19/08 |
-7.9 |
| First Trading Day of Expiration Week: 1990-2015 |
| #Up-#Down |
|
14-12 |
|
12-14 |
|
12-14 |
|
13-13 |
|
14-12 |
| Streak |
|
U3 |
|
U4 |
|
U1 |
|
U4 |
|
U1 |
| Avg
% |
|
0.02 |
|
-0.03 |
|
-0.1 |
|
-0.03 |
|
-0.001 |
| Options Expiration Day: 1990-2015 |
| #Up-#Down |
|
19-7 |
|
17-9 |
|
13-13 |
|
17-9 |
|
13-13 |
| Streak |
|
U6 |
|
U4 |
|
U4 |
|
U4 |
|
U6 |
| Avg
% |
|
0.3 |
|
0.2 |
|
0.02 |
|
0.2 |
|
0.2 |
| Options Expiration Week: 1990-2015 |
| #Up-#Down |
|
19-7 |
|
17-9 |
|
15-11 |
|
16-10 |
|
14-12 |
| Streak |
|
U3 |
|
U3 |
|
U3 |
|
U3 |
|
U1 |
| Avg
% |
|
0.5 |
|
0.2 |
|
0.2 |
|
0.2 |
|
-0.1 |
| Week After Options Expiration: 1990-2015 |
| #Up-#Down |
|
13-13 |
|
15-11 |
|
17-9 |
|
15-11 |
|
16-10 |
| Streak |
|
D1 |
|
U4 |
|
U4 |
|
U4 |
|
U4 |
| Avg
% |
|
0.5 |
|
0.6 |
|
0.8 |
|
0.6 |
|
0.9 |
| November 2016 Bullish Days: Data 1995-2015 |
| |
2,
3, 4, 11, 15 |
2,
3, 4, 15 |
1-4,
11, 22 |
1-4,
11, 15 |
2, 3, 4, 10 |
| |
22,
23, 25, 28 |
25,
29 |
23,
28, 29 |
23,
25, 28, 29 |
22, 23, 29 |
| November 2016 Bearish Days: Data 1995-2015 |
| |
None |
30 |
None |
None |
16, 21 |
| |
|
|
|
|
|
|
November 2016 Strategy Calendar
|
|
By:
Christopher Mistal
|
October 26, 2016
|
|
|
|
|
Portfolio Updates: Ramping Up Long Exposure
|
|
By:
Christopher Mistal
|
October 25, 2016
|
|
|
|
Today’s Alert is a continuation of yesterday’s Seasonal MACD Buy Signal. It is being delivered a little later than usual as all updates were done using today’s closing prices. November’s Vital Statistics, Almanac and Strategy Calendar Alert will be sent out tomorrow.
Unlike last year, the late-summer/early-fall selloff was relatively mild this year. S&P 500 is still on course to close out October in the red which would complete a
three consecutive month losing streak. Past streaks of three or more losing months in a row were followed by solid gains and the majority of the losing streaks did end at just three months.
Should this be the case, November could be a good month to be long again. November marks the beginning of the “Best Six Months” for DJIA and S&P 500 and the “Best Eight Months” for NASDAQ. November is also the first month of the best three consecutive month span that runs until the end of January. And of course, we should finally know who the next president will be after Election Day. The uncertainty of what the political alignment will be next year in D.C. is undoubtedly weighting on the market and this should end two weeks from now.
The other major headwind the market faces is the Fed. Will they raise rates or not is still an unknown. As of today, CME Group’s FedWatch Tool is showing only a 9.3% probably of a rate increase at the Fed’s November meeting and the probability of an increase in December is 79.5%. This would suggest virtually no chance for November, but a fairly decent chance of a hike in December. If the Fed did act, it could ultimately prove to be another positive for the market. Fed action would remove another major uncertainty from the equation and within the longer-term perspective, even at a Fed funds rate range of 0.50-0.75%, rates would still be quite low which is favorable for business and consumers alike and in turn should be a positive for the market.
Stock Portfolio Updates
Per yesterday’s Alert, all remaining short trades where covered today. The most successful of these trades was Newfield Exploration (NFX) with a gain of 8.8%. The three Mid-Cap portfolio shorts, MTDR, TNH and DRQ were also closed out for modest gains. Other short positions, LNN, KKR and PX were closed at for modest losses. KKR and PX were covered today while LNN was stopped out on October 13 when it closed above its stop loss.
In addition to these positions, recent October weakness and today’s retail sector weakness resulted in four other positions being closed out since last update. CNC, DHI, HBI and SBUX have all been closed out of the Large-Cap portfolio after closing below their respective stop losses.
With the closure of several long positions and all short positions there is a sizable cash balance in the Stock Portfolio once again. We will look to put this cash to work in a basket of undervalued, relatively unknown stocks exhibiting the greatest potential for growth and gains regardless of Election Day outcome in upcoming Alerts.
ETF Portfolio Updates
Per yesterday’s Alert, remaining defensive positions were closed out of the portfolio today. AGG was closed out for a 0.6% gain excluding dividends while HDGE was sold at a 9.0% loss. The loss on HDGE is unsatisfactory however; no major pullback or correction took place during the summer/early-fall months. HDGE was the more aggressive “Worst Months” trade. Absent meaningful weakness, a loss is not unexpected.
SPDR DJIA (DIA), SPDR S&P 500 (SPY), PowerShares QQQ (QQQ), and iShares Russell 2000 (IWM) appear in the table below and can be purchased at current levels or below their respective buy limits, whichever is lower. Most other positions can also be considered at current levels or below their respective buy limits. See table below for updated buy limits, stop losses and auto-sell prices.
Disclosure Note: At press time, officers of the Hirsch Organization, or accounts they control held positions in BUSE, FXB, GLD,IBB, IWM, IYT, MHO, QQQ, SCMP, SPY, VNQ, XLB, XLF, XLP, XLV and XLY.
|
Seasonal MACD Buy Signal Update: “Best Six/Eight Months” Begin
|
|
By:
By Jeffrey A. Hirsch & Christopher Mistal
|
October 24, 2016
|
|
|
|
Faster moving MACD indicators applied to DJIA, S&P 500 and NASDAQ are all positive as of today’s close. The criteria to issue our Seasonal MACD Buy Signal have been satisfied. With all three indices confirming, we are now issuing our Seasonal MACD Buy Signal. The “Best Six/Eight Months” have officially commenced.
Buy SPDR DJIA (DIA), SPDR S&P 500 (SPY), PowerShares QQQ (QQQ), and iShares Russell 2000 (IWM). For tracking purposes, these ETFs will be added to the portfolio using their respective average prices on October 25. This price will be calculated by summing the open and close prices and dividing by two. Buy limits for DIA, SPY, QQQ and IWM are initially today’s closing price plus 1%. For example if today’s closing price was $100, then the buy limit would be $101 (close * 1.01 = buy limit).
Also at this time sell AdvisorShares Ranger Equity Bear (HDGE) and iShares Core US Aggregate Bond (AGG). For tracking purposes, these ETFs will be closed out of the portfolio using their respective average prices on October 25.
Other open positions in the ETF Portfolio can be bought at this time. Buy IYW, IYT, IYZ, SOXX, XLY, XLB and XLK with a buy limit of today’s closing price plus 1%. For tracking purposes, these ETFs will be added to the portfolio using their respective average prices on October 25. This price will be calculated by summing the open and close prices and dividing by two.
Remaining short stock trades in the Almanac Investor Stock Portfolio will also be closed out. Cover Lindsay Corp (LNN), Matador Resources (MTDR), Terra Nitrogen (TNH), Drill-Quip (DRQ), KKR & Co (KKR), Newfield Exploration (NFX) and Praxair (PX). For tracking purposes, these stock trades will be closed out of the portfolio using their respective average prices on October 25.
The Almanac Investor Stock and ETF Portfolios will be updated to reflect these trades in our next regularly scheduled Alert, after the close on Tuesday, October 25, 2015.
Disclosure Note: At press time, officers of the Hirsch Organization, or accounts they control held positions in AGG and HDGE. They did not hold any positions in the other ETFs or stocks mentioned in this Alert, but may buy or sell at any time.
|
ETF Portfolio Update: Use Dips & MACD Update: Still No Go
|
|
By:
Christopher Mistal
|
October 20, 2016
|
|
|
|
As of today’s close, our Seasonal MACD Buy Signal is still on Hold. Our 8-17-9 MACD “Buy” indicator applied to DJIA is positive, but S&P 500 and NASDAQ remain negative. In order to issue our Seasonal MACD Buy Signal, DJIA, S&P 500 and NASDAQ MACD “Buy” indicators need to signal a “Buy” and all be in agreement.
While we continue to await the all-clear signal, numerous open trade ideas remain in the
Almanac Investor ETF and Stock portfolios that can still be considered on dips below their respective buy limits. Election and Fed uncertainty has created volatility that is delaying the start of the “Best Months,” but we still anticipate respectable market performance in the wake of the election outcome and the Fed. It will likely be a bumpy road, but as long as fundamentals don’t take a turn for the worse and earnings continue to hold up, the path higher exists.
ETF Portfolio Updates
Per last update from earlier this month on October 4, SPDR Utilities (XLU) has been closed out of the portfolio. XLU was closed out using its average price on October 5 for a modest 4.0% return excluding dividends paid while it was held.
Recent hate hike expectations and a stronger U.S. dollar have resulted in iShares 20+ Year Treasury Bond (TLT) being stopped out on October 11 when it closed below its stop loss of $133.00. Price only return was a meager 0.2%, but with monthly dividends included it is better as they totaled around $1.50 since May. Our other bond holding, iShares Core US Aggregate Bond (AGG) is still on Hold.
Recent volatility did allow the addition of iShares NASDAQ Biotech (IBB), SPDR Consumer Staples (XLP), SPDR Healthcare (XLV) and Vanguard REIT (VNQ). As of yesterday’s close, IBB, XLP and XLV were still trading below their respective buy limits and can be considered at current levels. VNQ was 2.3% higher yesterday and can be considered on dips below its buy limit.
This month’s Seasonal Sector Trade idea, CurrencyShares British Pound (FXB) was added to the portfolio on October 11 at $120.00. The pound’s mini crash appears to have put in a bottom as the low on the eleventh has held thus far. FXB is on Hold. Significant uncertainty remains as to the effects of Brexit, but since most of the disastrous consequences have not materialized and may not there is room for a pound bounce. If the bounce fails, the tight stop loss should be heeded at $117.90.
The other “Worst Months” defensive position in HDGE is on hold. Continue to hold AGG and HDGE positions until the “Best Six/Eight Months” officially begin when we issue our Seasonal MACD Buy Signal Alert.
Numerous positions in the portfolio remain open with buy limits that are below current market levels. In some cases, well below. IYW, IYT, IYZ, SOXX, XLY, XLB and XLK can all be considered on dips below their respective buy limits. Any positions not added before our Seasonal MACD Buy Signal will be considered when we issue the Seasonal Buy.
SPDR DJIA (DIA), iShares Russell 2000 (IWM), PowerShares QQQ (QQQ) and SPDR S&P 500 (SPY) all appear in the portfolio as “Not Yet” with corresponding buy limits that are still well below current prices, but just above their respective support levels. If these positions dip below their respective buy limits, a half position is suggested. A full position would then be established when we issue our Seasonal Buy.
After cratering at the start of October, SPDR Gold (GLD) appears to have found support right around its 200-day moving average. Technical indicators applied to GLD are improving and additional purchases can be considered on dips below $120.05. Should GLD trade at this level we will officially double the position in the portfolio by adjusting its purchase price.
Disclosure Note: At press time, officers of the Hirsch Organization, or accounts they control held positions in AGG, HDGE and TLT. They did not hold any positions in the other ETFs mentioned in this Alert, but may buy or sell at any time.
|
Eighth Year Pattern Back in Play & MACD Update: On Hold
|
|
By:
Christopher Mistal
|
October 18, 2016
|
|
|
|
For the better part of a year we have been tracking the 8th Year of Presidential Administrations pattern. Early this year, the market was tracking the pattern closely, almost too closely as there were substantial declines in January and into early February before the market rebounded in March and April. From there the market moved sideways until breaking out in July. It was around that time we declared the worst case scenario had been taken off the table and the next timeframe to look out for was in September and October, most notably for DJIA and S&P 500. With the bulk of this period over we can look back and see the market did surrender to typical election-year weakness in September and thus far in October. September’s declines were modest; DJIA –0.5%, S&P 500 –0.1% and NASDAQ +1.9%. Declines so far in October have been greater. At today’s close DJIA is down 0.8%, S&P 500 and NASDAQ are off 1.3% so far this October.
![[DJIA 8th Year Seasonal Chart]](/UploadedImage/AIN_1116_20161018_8th_seasonal_DJIA.jpg)
![[S&P 500 8th Year Seasonal Chart]](/UploadedImage/AIN_1116_20161018_8th_seasonal_SP500.jpg)
![[NASDAQ 8th Year Seasonal Chart]](/UploadedImage/AIN_1116_20161018_8th_seasonal_NASDAQ.jpg)
Looking ahead, there are two big dates on the calendar with market moving potential, Election Day, November 7 and the Fed’s announcement on December 15. The Fed does meet on November 1-2, but this meeting will likely be used to indicate to the market that rates will (most) likely be going up at the December meeting. As of today, the outcome of the Election could be the biggest wild card and it is also a dividing line in the charts above.
Whether looking at “All Presidential Election Years” or just “Eighth Years,” the market is usually in rally mode near the end of October. Should the election go as polls suggest then the market will most likely track the “All Presidential Election Years” pattern to finish the balance of 2016. However, the Fed could spoil the last few weeks. Should the election results be too close to call and trigger a recount, then the “Eighth Years” pattern is back in play. An undecided outcome similar to November 2000 (an Eighth Year) would produce uncertainty and could lead to declines similar to those that occurred then. DJIA dropped 5.1%, S&P 500 plunged 8.0% while NASDAQ imploded 22.9% (tech bubble burst, not likely to occur again as valuations are not as extreme now) in November 2000. In the undecided scenario, it would not be surprising to see the Fed skip a rate hike in December in order to provide some relief to the market.
Seasonal MACD Buy Signal Update
As of today’s close, our Seasonal MACD Buy Signal is still on Hold. Our 8-17-9 MACD “Buy” indicator applied to DJIA, S&P 500 and NASDAQ are all negative. In order to issue our Seasonal MACD Buy Signal, DJIA, S&P 500 and NASDAQ MACD “Buy” indicators need to signal a new “Buy” and all be in agreement.
While we await the all-clear signal, numerous open trade ideas in the
Almanac Investor ETF and Stock portfolios can still be considered on dips below their respective buy limits. Election and Fed uncertainty has created volatility that is delaying the start of the “Best Months,” but we still anticipate respectable market performance in the wake of the election outcome and the Fed. It will likely be a bumpy road, but as long as fundamentals don’t take a turn for the worse and earnings continue to hold up, the path higher is available.
|
MACD Update: No Go & Post-Election Years: New Administrations
|
|
By:
Christopher Mistal
|
October 13, 2016
|
|
|
|
Approximately halfway through the month of October and thus far the market has been following historical trends reasonably closely. We have not seen a full-blown bout of “Octoberphobia” yet, and may not, however, as of yesterday’s close DJIA was down 0.9%, S&P 500 was off 1.3% and NASDAQ was at -1.4%. DJIA and S&P 500 have already exceeded their historical
average losses for an election-year October. Beyond election uncertainties the single biggest driver behind current market weakness appears to be the Fed. They did not raise rates at their last meeting, but the minutes of the meeting showed that some members of the board are ready to act this year. According to CME Group’s
FedWatch Tool the current chances of a November increase are just 9.3% while a December rate increase has odds right around 70%. This is still not a sure thing, but it is leaning heavily in favor of higher rates by yearend.
If the Fed does raise rates in December it is quite likely the market will have a reaction similar to last December’s rate increase. Initially there will likely be a sign of relief that the Fed has finally taken action because the economy is perceive to be on solid ground and improving. This could send the market initially higher until reality sets back in and reality is just not as good as the forecasts would like. Yes, the labor market is arguably on stable footing with respectable job growth and the official unemployment rate is 5.0%. But U.S. growth (and global growth) is still tepid. Today’s import/export data from China is just one confirming piece of data.
Following the likely positive initial response to a (potential) December rate hike and the subsequent return to reality, the market is likely to weaken, possibly at yearend and into early next year. This weakness combined with typical early-year, post-election year weakness has the potential to setup a solid rally later on in 2017 especially if Hillary Clinton wins the election. In the next chart DJIA’s performance in post-election years is presented.
![[Post-election DJIA Seasonal Pattern Chart]](/UploadedImage/AIN_1116_20161013_1st_Elected_Seasonal.jpg)
In the above chart, “All Post-Election” years since 1953 is the baseline to which “All 1st Elected,” “Dem 1st Elected,” and “Rep 1st Elected” are compared. “All 1st Elected” years are the first years of a new president. “Dem 1st Elected” are first years of a new president that was a Democrat and “Rep 1st Elected” are new Republican presidents. For the first half of a post-election year all four are quite close. Under 1st Elected Democrats DJIA was weaker in January and February on average as a result of early losses in 2009. By the end of July DJIA’s performance begins to show significant deviation and by the end of the year DJIA has performed best under a newly elected, 1st-year Democrat. Should polls hold and Hillary Clinton become the next President, DJIA’s performance in 2017 could resemble the green line. If Donald Trump can defy odds and polls then DJIA could follow the path of the black line.
In the following table all Presidents and all post-election years since 1953 are listed. “1st Elected” years are shaded in grey and appear separately. These years are then broken down into Democrat and Republican. In total there have been nine “1st Elected” years since 1953, four went to the Democrats and five went to the Republicans. Of the five Republicans only G. H. W. Bush’s first year in office was accompanied by a DJIA gain. Democrats have an opposite record, only Carter suffered a DJIA loss in his first year. The dataset is small, but the differences between a newly elected Democrat and a newly elected Republican in their first year in office are stark. These differences further expand when DJIA data going back to 1897 is used. In this expanded data set DJIA averaged 15.1% under “1st Elected” Democrats compared to just 2.6% under “1st Elected” Republicans.
Seasonal MACD Buy Signal Update
As of today’s close, our Seasonal MACD Buy Signal is still on Hold. Our 8-17-9 MACD “Buy” indicator applied to DJIA, S&P 500 and NASDAQ are all negative. In order to issue our Seasonal MACD Buy Signal, DJIA, S&P 500 and NASDAQ MACD “Buy” indicators need to signal a new “Buy” and all in agreement.
|
MACD Update: On Hold & Stock Portfolio Updates: Use Dips to Accumulate
|
|
By:
Christopher Mistal
|
October 11, 2016
|
|
|
|
As of today’s close, our Seasonal MACD Buy Signal is still on Hold. Our 8-17-9 MACD “Buy” indicator applied to S&P 500 had been positive since late September, but today’s decline has turned its MACD indicator negative. At the lows of the day, DJIA’s MACD indicator was also negative, but by the close it just managed to narrowly hang onto positive territory. If DJIA does not gain more than 67.5 points tomorrow, its MACD indicator will be negative. NASDAQ’s “Buy” Indicator has been negative every day this month except October 5.
In order to issue our Seasonal MACD Buy Signal, DJIA, S&P 500 and NASDAQ MACD “Buy” indicators need to signal a new “Buy” and be in agreement. To clarify further, the 8-17-9 MACD indicator needs to be positive across all three indices; DJIA, S&P 500 and NASDAQ on a closing basis then an email Alert will be sent.
Portfolio Updates
In the four weeks since last update, S&P 500 was up 0.2% while Russell 2000 gained 1.2% as of yesterday’s close. The Almanac Investor Stock Portfolio’s blend of cash, long and short positions resulted in a modest 0.3% overall gain over the same time period. Small-cap stocks in our portfolio performed best, advancing 0.9%. Mid-caps climbed 0.5% while Large-caps shed 3.1%.
Much of the loss in the Large-cap portion of the portfolio can be attributed to three stocks, Union Pacific (UNP), CVS Health (CVS) and Continental Resources (CLR). All three were stopped out last week. The short position in CLR proved to be costly as it broke out to multi-year highs above $53.25 resulting in a 28.1% loss. CLR is clearly a momentum play as its advance was more than double of crude’s since their respective lows earlier this year. Its current run will come to an end especially if crude suddenly reverses course and hides lower.
Mid-cap performance was lifted by the addition of three new positions from last month’s
Stock Basket.
Ameris Bancorp (ABCB),
Sabra Healthcare REIT (SBRA) and
Corelogic (CLGX) were all added when they dipped below their respective buy limits. ABCB was up 5.3% at yesterday’s close while SBRA’s modest gain essentially offsets CLGX’s mild loss.
Scotts Miracle-Grow (SMG) also contributed to gains. However, the same weakness that allowed the addition of new trade ideas did result in
Amerco Inc. (UHAL) being stopped out for a loss of 6.6%. This was the second time we traded UHAL and although there was a loss this time, the gain from the first trade was a robust 88%.
Small-caps have been outperforming recently after a long period of underperformance. A 0.9% gain is respectable considering the limited number of small-cap positions and the sizable cash balance. Lydall (LDL) and Sucampo Pharma (SCMP) accounted for the bulk for the Small-cap portfolio gains.
With our Seasonal MACD Buy still on hold, we will maintain existing short positions and use dips to accumulate new trade ideas from September’s Stock Basket. Please refer to the updated portfolio table below for Current Advice about each specific position. Also note that several stop losses have been updated.
Disclosure Note: At press time, officers of the Hirsch Organization, or accounts they control did not hold any positions in the stocks mentioned, but may buy or sell at any time.
|
MACD Update: Not Buy Yet & Seasonal Sector Trades: A Pound Bounce
|
|
By:
Christopher Mistal & Jeffrey A. Hirsch
|
October 06, 2016
|
|
|
|
Consistent with October’s historical tendency towards volatility, September’s Employment Situation report, usually released on the first Friday of October when the Federal government isn’t in a total or partial shutdown, also has a tendency to induce sizable swings in the major U.S. indices. Over the past fifteen years October’s Employment report has resulted in mixed performance with a modest average gains by DJIA, S&P 500 and NASDAQ while Russell 1000 and Russell 2000 have modest average losses. DJIA has the best record with nine gains and six losses and has been up in five of the last six years. S&P 500, NASDAQ, Russell 1000 & 2000 have been up three years straight and four of the last six.
British Pound Autumn Rally
Great Britain is a multi-trillion-dollar economy and its largest city, London, is considered the world’s top financial trading center. Many market factors can influence the floating value of the pound versus other currencies such as the euro. However, when we compare the pound in terms of the U.S. dollar, we see several trading opportunities throughout the year.
Here is an interesting, relatively short-term trade, one that seems to have the same reaction with the trade direction in the yen, Swiss franc, and euro currencies during this time period. The British pound has a seasonal tendency to decline just ahead of the end of the third quarter and reach a bottom near mid-September.
We typically see rallies in October through the end of the calendar year (shaded in yellow in following chart). After that, the market starts to fade against the dollar again, before posting a bottom shortly before Britain’s fiscal year begins in April. Seasonally speaking, the pound tends to trade higher in value against the U.S. dollar from around September 17 until about November 3. In the last 41 years this trade has worked 25 times, for a success rate of 61.0%.
This trade has failed in six of the last eight years as unpreceded monetary policy in response to financial crisis in 2008 has disrupted currency seasonality. This June’s Brexit vote dealt the British pound a major blow and it has been weak since. This week’s move by the pound to its lowest level going back to 1985 caught our attention as the FTSE 100 climbed to record highs. British pound sentiment also appears excessively bearish. The pound’s recent low against the U.S. dollar was just above parity which still leaves room for further downside, but the pounds recent weakness is already creating some benefits. Britain’s exports are getting cheaper and vacations there are less expensive, which could cause demand to rise prompting economic activity to improve sooner than expected. In turn, the British pound could quickly find support and begin to rebound.
![[S&P 500 (SP) Weekly Bars and Seasonal Trend Chart (Weekly Data Oct 2015 – October 5, 2016)]](/UploadedImage/AIN_1116_20161006_BP_seasonal.jpg)
CurrencyShares British Pound (FXB) is one way to gain long exposure to the British pound. Because of the volatile nature of this trade, FXB could be considered on dips below $120. If purchased an initial tight stop loss at $117.90 is suggested. Look for corresponding improvements in Stochastic, relative strength and MACD indicators prior to taking a new long position below the buy limit. This trade will be tracked in the Almanac Investor ETF Portfolio.
Seasonal MACD Signal Update
As of today’s close, our Seasonal MACD Buy Signal is still on hold. Our 8-17-9 MACD “Buy” indicator applied to DJIA and S&P 500 has been positive since late September, but our window for a signal did not open until October 3. On the first trading day of October, the MACD “Buy” indicator histogram was and still is trending toward negative (blue arrows in lower pane of DJIA and S&P 500 charts below). NASDAQ’s MACD “Buy” indicator was also trending toward negative on October 3 and went negative on October 4. It was fractionally positive at yesterday’s close and is negative again today.
In order to issue our Seasonal MACD Buy Signal, DJIA, S&P 500 and NASDAQ MACD “Buy” indicators need to be in agreement and the negative trend in MACD histograms needs to be reversed.
|
ETF Trades: Seasonal MACD Buy Signal Update
|
|
By:
Christopher Mistal
|
October 04, 2016
|
|
|
|
With just two trading days in the record books, the fourth quarter of 2016 is off to a bumpy start. As of today’s close S&P 500 is down 0.82% and appears to be casting its vote early, against the incumbent party’s candidate Hillary Clinton. Perhaps it is voting for Republican candidate Donald Trump or maybe for Gary Johnson of the Libertarian party. Admittedly it is too early in October to make such a call however; it is notable that S&P 500 has already deviated from its typical path in October compared to past incumbent party victories.
In the above chart, S&P 500 performance in October is plotted for “All Years,” “Election Years,” “Incumbent Victories,” “Incumbent Party Defeats” and “2016.” Should S&P 500 continue to track the Incumbent Party Defeat pattern, weakness is likely to persist until near the end of October before a modest rally ensues, but still fails to return to positive territory.
This presidential election has been unique and an unusual response from the market is not out of the question. Recent weakness likely has more to do with the IMF lowering its growth forecast for the U.S. and an increasingly hawkish tone from the Fed. Brexit fears are also weighing with the British pound trading at its lowest level in decades today. These are all legitimate concerns, but nothing exactly new. The Fed has been a pendulum swinging between yes and no since the start of the year and U.S. (and global) growth has been tepid for years now while an actual Brexit is still unsorted. Friday’s jobs report and earnings season just around the corner will either confirm concerns and fears or alleviate them.
MACD Seasonal Buy Signal Update
Our Seasonal MACD Buy signal can trigger anytime now. Presently, the MACD Buy indicator (MACD (C,8,17,F)) in the following chart of NASDAQ is negative. DJIA and S&P 500 MACD indicators are trending toward negative as a result of recent weakness. One-day declines of 53 DJIA points and 0.54 S&P 500 points would turn their respective MACD indicators negative while NASDAQ needs a one-day gain in excess of 25.34 points to be positive.
Due to these mixed signals we are going to wait until
when MACD indicators for DJIA, S&P 500 and NASDAQ are
all positive before issuing our Seasonal MACD Buy Alert. Until that time we will continue to maintain a modestly defensive posture in our
ETF and Stock portfolios.
Portfolio Updates
Seasonal strength in Utilities typically comes to an end in early October. As a result of this, Sell SPDR Utilities (XLU). For tracking purposes, XLU will be closed out using its average price on October 5.
Defensive positions in TLT, HDGE and AGG are on hold. Continue to hold these positions until the “Best Six/Eight Months” officially begin when we issue our Seasonal MACD Buy Signal Alert.
Numerous positions in the portfolio remain open with buy limits that are below current market levels. In some cases, well below. IYW, IBB, IYT, IYZ, SOXX, XLY, XLP, XLV,XLB, XLK and VNQ can all be considered on dips below their respective buy limits. Any positions not added before our Seasonal MACD Buy Signal will be considered when we issue the Seasonal Buy.
iShares DJ Transports (IYT) short position was stopped out on September 30, when it closed above $145.
SPDR DJIA (DIA), iShares Russell 2000 (IWM), PowerShares QQQ (QQQ) and SPDR S&P 500 (SPY) all appear in the portfolio as “New” with corresponding buy limits that are well below current prices, but just above their respective support levels. If these positions dip below their respective buy limits, a half position is suggested. A full position would then be established when we issue our Seasonal Buy.
Overall election-year October performance has a hit or miss record. October is generally much better when the incumbent party ultimately wins in November and worse when it loses. Recent polls continue to indicate a tight race that could, with a catalyst, easily go either way. This uncertainty creates volatility and opportunity. Regardless of the election outcome, the market generally rallies to finish out the year as the uncertainty over who will take up residence in the White House is resolved.
Disclosure Note: At press time, officers of the Hirsch Organization, or accounts they control held positions in AGG, HDGE and TLT. They did not hold any positions in the other ETFs mentioned in this Alert, but may buy or sell at any time.