|
June 2017 Trading & Investment Strategy
|
|
By:
|
May 30, 2017
|
|
|
|
|
Market at a Glance - 5/30/2017
|
|
By:
Christopher Mistal
|
May 30, 2017
|
|
|
|
5/26/2016: Dow 21080.28 | S&P 2415.82 | NASDAQ 6210.19 | Russell 2K 11382.24 | NYSE 11631.87 | Value Line Arith 5433.80
Psychological: Fading. According to the most recent
Investors Intelligence Advisors Sentiment survey bulls have slipped to 51.9% from 58.1% in the prior week, bears inched higher to 18.3% and correction is up to 29.8%. These readings are from May 23 and last week’s gains may have given a bump to the bulls. Aside from one week in March, bulls have been above 50% since last November. Back then was a great opportunity for new long positions, now is not.
Fundamental: Mixed. Corporate earnings are a bright spot as is the labor market, but there are still areas in need of improvement. Labor force participation is soft and economic growth seems to be hit or miss. Q1 GDP was a miss while Q2 is now forecast to be a hit with Atlanta Fed’s GDPNow model forecasting 3.8%. The Trump administration also remains a wild card. Will it come through on its campaign promises or at least some watered down version? At this point, it remains a coin toss and a potential major disappointment.
Technical: Topping? Last month it was NASDAQ and Russell 2000 that broke out to new highs. Now it is S&P 500 and NASDAQ. Since March 1, only NASDAQ has made a meaningful move higher and held the gains. S&P 500 is undoubtedly benefiting from its technology exposure, but absent DJIA, the transports and small-caps, NASDAQ will likely fail to continue much higher. Sporadic and marginal new highs by the indices look like the market is tracing out a possible top.
Monetary: 0.75-1.00%. At its May meeting, the Fed elected to hold rates steady, but the CME Group’s FedWatch Tool is currently indicating an 88.8% probability that the Fed funds rate will be going up after June’s meeting. Inflation running below target, tepid/sporadic economic growth and a massive balance sheet are major challenges the Fed is facing. Any misstep could have significant consequences to the market and the economy.
Seasonal: Neutral. June is the last month of NASDAQ’s “Best Eight Months.” NASDAQ’s Seasonal MACD Sell signal can occur as soon as June 1. In post-election years, June struggles. June is #10 DJIA and S&P 500 month with average losses of 1.2% and 0.7% respectively. June is #8 for NASDAQ and Russell 2000.
|
June Outlook: Worst Six Months Topping Process Underway
|
|
By:
Jeffrey A. Hirsch & Christopher Mistal
|
May 30, 2017
|
|
|
|
Our 5-Disciplines market timing analysis approach, detailed in the
Market at a Glance every month, is now indicating that the seasonal topping process is underway. Whether or not this next pullback or correction manifests into something more ominous like a bear market is too early to tell. But we are already in defensive mode with our
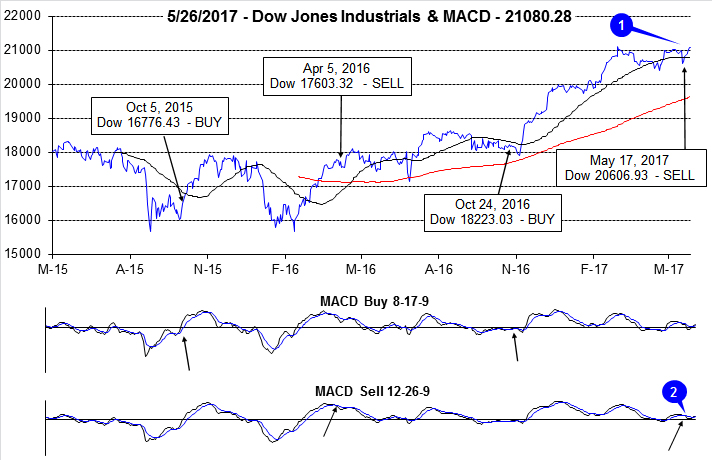
Best Six Months Seasonal MACD Sell Signal triggering on May 17.
As we enter the month of June we are prepared to take additional risk off and deploy additional defensive action as NASDAQ’s Best Eight comes to end. When NASDAQ’s Best Eight Months Seasonal MACD Sell Signal triggers it will be our cue to protect our portfolios further, selling more underperformers, implementing more downside protection and scouting for shorting opportunities in the Worst Four Months of the Year July-October.
The bulk of the seasonal summer/fall selloffs often come in August and September, the worst two months of the year, but we like being ready and positioned well beforehand. Plus June is no prize in post-election years (see below). Rhetoric on the geopolitical front is getting rather contentious and the prospects for any fast-track stimulative legislation coming out of Washington DC in the near term grow thin. The portfolio protection and house cleaning we have already been implementing and the rest we are poised for seems prudent at this juncture.
Now we also have the potential for the
Three Peaks and a Domed House Top Pattern (3PDH) we noted was in play again on April 18, to collide with the perennial summer doldrums and associated correction. We have updated the 3PDH here in the chart below. We have added a few question marks to the current points 15, 20, 21 and 23 and the pattern is still evolving. If this 3PDH pattern does continue to develop and complete, points 1 through 14 look pretty set.
As you can see the beginning of the current 3PDH patter at point 1 (not labeled) corresponds to the points 10-14 of the previous 3PDH’s separating decline. The May 21, 2015 S&P 500 top is point 23 of the last one and point 5 (the middle peak) of the current pattern. And the ultimate bear market low in February 2016 is both point 28 of the last pattern and point 14 of the current 3PDH.
So, needless to say with all the diplomatic and political machinations brewing, the 5 Disciplines at DEFCON 4, tepid internals as described in the Pulse below and the ominous portent from the Three Peaks, we believe the time has come to be ready to move into risk off/defensive mode.
Pulse of the Market
After the close on May 17, we issued our Seasonal MACD Sell signal for DJIA and S&P 500 (1). Prior to that day, DJIA and S&P 500 had been slowly creeping higher keeping the sell signal at bay (2). The negative political news of that day was quickly shrugged off and DJIA has rebounded and reclaimed its 50-day moving average. S&P 500 and NASDAQ have since crept to new all-time highs, but DJIA is lagging and has thus far failed to best its March 1 closing high of 21,115.55.
As of last Friday’s close, DJIA was 0.67% higher for May following its best weekly performance of the month (3). After declining in four of six weeks from early March to mid-April, DJIA has been up four of the last six weeks. With the exception of the Down Friday/Down Monday (4) that occurred at the start of May, DJIA’s performance on Fridays has improved somewhat. Following seven straight Friday (or last trading day of the week) declines, DJIA has logged two positive Fridays in the last four. Mondays have been the most consistent source of gains for DJIA, up six of the last seven excluding today.
S&P 500 has advanced in four of the last six weeks (5) and NASDAQ has been up in five of the last six (6). S&P 500 and NASDAQ both finished last week at new all-time closing highs, but absent support from other major indices, their strength is likely to fade as typical summer slowdown in trading volume begins to take hold.
NYSE Weekly Advancers and Decliners (7) paint a tepid overall picture. Weekly Advancers have outnumbered Weekly Decliners during four of the past six weeks, but not by the healthy margin that would confirm or signal the market has successfully broken out and is in the midst of a new wave higher. More Weekly Advancers are needed. Even last week’s move had fewer than 2000. Broader participation appears to be lacking.
NYSE Weekly New Highs (8) have also been choppy at best having peaked at the end of April at 544. Last week’s reading interrupted a four-week down trend in New Highs and could prove to be fleeting. New Weekly Lows remain subdued, but are greater now. This is another sign that participation is fading and the rebound rally could be fizzling.
Because of the long holiday weekend, last week’s interest rate data is not yet available. The 90-Day Treasury rate reaching 0.90 two weeks ago is the highest reading since October 24, 2008 and is nearly double its level from early January (9). The 30-year Treasury bond yield remains right around 3%. This flattening of the yield curve is not going to help banks nor does it indicate any real inflation concerns over the longer-term.
|
June Almanac, Stats & Strategy Calendar: NASDAQ’s “Best Eight Months” End
|
|
By:
Jeffrey A. Hirsch & Christopher Mistal
|
May 25, 2017
|
|
|
|
The first month of summer has shone brighter on NASDAQ stocks over the last 46 years as a rule ranking sixth with a 0.7% average gain, up 25 of 46 years. This contributes to NASDAQ’s “Best Eight Months” which ends in June. June ranks near the bottom on the Dow Jones Industrials just above September since 1950. S&P 500 performs similarly poorly, ranking tenth.
In post-election years since 1953, June still ranks poorly and its average loss for DJIA and S&P 500 increases to –1.2% and –0.7% respectively compared to –0.3% and –0.03% in all years. DJIA in particular struggles, advancing in just three post-election year Junes (1977, 1985 and 1997). NASDAQ and Russell 2000 fare best in June, posting modest average gains.
The second Triple Witching Week of the year brings on some volatile trading with losses frequently exceeding gains. On Monday of Triple-Witching Week DJIA has been down twelve of the last twenty years. Triple-Witching Friday is better, up nine of the last fourteen years, but mixed over the past 20 years, up eleven, down nine with an average loss of 0.3%. Full-week performance is choppy as well, littered with greater than 1% moves in both directions. Weeks After Triple-Witching Day are horrendous. This week has experienced Dow losses in 24 of the last 27 years with average losses of 1.1%.
June’s first trading day is the Dow’s best day of the month, up 22 of the last 29 years. Gains are sparse throughout the remainder of the month until the last three days when NASDAQ and Russell 2000 stocks begin to exhibit strength. The last day of the second quarter is a bit of a paradox as DJIA has been down 17 of the last 26 while the NASDAQ and Russell 2000 have nearly the opposite record, although, since 2003 technology and small-caps indices have been dragged down by their large-cap brethren.
| June (1950-2016) |
| |
DJI |
SP500 |
NASDAQ |
Russell
1K |
Russell 2K |
| Rank |
|
11 |
|
10 |
|
8 |
|
11 |
|
8 |
| #
Up |
|
31 |
|
35 |
|
25 |
|
22 |
|
23 |
| #
Down |
|
36 |
|
32 |
|
21 |
|
16 |
|
15 |
| Average
% |
|
-0.3 |
|
-0.03 |
|
0.7 |
|
0.2 |
|
0.6 |
| 4-Year Presidential Election Cycle Performance
by % |
| Post-Election |
|
-1.2 |
|
-0.7 |
|
0.5 |
|
0.1 |
|
0.9 |
| Mid-Term |
|
-1.7 |
|
-1.9 |
|
-1.6 |
|
-1.4 |
|
-1.6 |
| Pre-Election |
|
0.8 |
|
1.2 |
|
1.9 |
|
1.1 |
|
1.4 |
| Election |
|
0.9 |
|
1.3 |
|
1.6 |
|
0.8 |
|
1.4 |
| Best & Worst June by % |
| Best |
1955 |
6.2 |
1955 |
8.2 |
2000 |
16.6 |
1999 |
5.1 |
2000 |
8.6 |
| Worst |
2008 |
-10.2 |
2008 |
-8.6 |
2002 |
-9.4 |
2008 |
-8.5 |
2010 |
-7.9 |
| June Weeks by % |
| Best |
6/7/74 |
6.4 |
6/2/00 |
7.2 |
6/2/00 |
19.0 |
6/2/00 |
8.0 |
6/2/00 |
12.2 |
| Worst |
6/30/50 |
-6.8 |
6/30/50 |
-7.6 |
6/15/01 |
-8.4 |
6/15/01 |
-4.2 |
6/9/06 |
-4.9 |
| June Days by % |
| Best |
6/28/62 |
3.8 |
6/28/62 |
3.4 |
6/2/00 |
6.4 |
6/10/10 |
3.0 |
6/2/00 |
4.2 |
| Worst |
6/26/50 |
-4.7 |
6/26/50 |
-5.4 |
6/29/10 |
-3.9 |
6/4/10 |
-3.5 |
6/4/10 |
-5.0 |
| First Trading Day of Expiration Week: 1990-2016 |
| #Up-#Down |
|
14-13 |
|
15-12 |
|
11-16 |
|
13-14 |
|
11-16 |
| Streak |
|
D2 |
|
D2 |
|
D2 |
|
D2 |
|
D2 |
| Avg
% |
|
-0.1 |
|
-0.1 |
|
-0.3 |
|
-0.2 |
|
-0.4 |
| Options Expiration Day: 1990-2016 |
| #Up-#Down |
|
16-11 |
|
17-10 |
|
14-13 |
|
16-11 |
|
16-11 |
| Streak |
|
D2 |
|
D2 |
|
D2 |
|
D2 |
|
D2 |
| Avg
% |
|
-0.2 |
|
-0.1 |
|
-0.04 |
|
-0.1 |
|
0.03 |
| Options Expiration Week: 1990-2016 |
| #Up-#Down |
|
16-11 |
|
15-12 |
|
12-15 |
|
13-14 |
|
13-14 |
| Streak |
|
D1 |
|
D1 |
|
D1 |
|
D1 |
|
D1 |
| Avg
% |
|
-0.05 |
|
0.001 |
|
-0.3 |
|
-0.07 |
|
-0.2 |
| Week After Options Expiration: 1990-2016 |
| #Up-#Down |
|
3-24 |
|
7-20 |
|
12-15 |
|
8-19 |
|
11-16 |
| Streak |
|
D4 |
|
D3 |
|
D2 |
|
D3 |
|
D2 |
| Avg
% |
|
-1.1 |
|
-0.8 |
|
-0.3 |
|
-0.7 |
|
-0.5 |
| June 2017 Bullish Days: Data 1996-2016 |
| |
1,
7, 14 |
1,
2, 14, 15, 22 |
1,
15, 19, 28-30 |
2,
15, 29 |
7, 15, 28-30 |
| |
|
|
|
|
|
| June 2017 Bearish Days: Data 1996-2016 |
| |
9,
22, 26, 30 |
12,
26, 27 |
12,
22, 26 |
12,
23, 26, 27 |
8, 9, 22, 26 |
| |
|
|
|
|
|
|
June 2017 Strategy Calendar
|
|
By:
Christopher Mistal
|
May 25, 2017
|
|
|
|
|
ETF Portfolio Update: Initial Defensive Positions Established
|
|
By:
Christopher Mistal
|
May 23, 2017
|
|
|
|
Last Wednesday, May 17, the market was walloped with the worst day of the year thus far. Prior to that day, VIX (CBOE Volatility Index) was at historic lows trading at less than 10 for four straight days and actually closed below 10 on May 8 & 9. VIX then slowly inched higher and closed at 10.65 on May 16. Today, VIX closed at 10.68. VIX and the broader market are essentially right back where they were one week ago, but it took four trading days to (nearly) recover that single day’s loss.
VIX’s 46.4% jump on May 17 could be the first sign that the seasonal low in volatility has already been reached this year. In the following chart, VIX weekly bars appear on top with its 1-year seasonal pattern appearing on the bottom. In a typical year, VIX typically finds a bottom sometime from mid-April to mid-July before briskly rebounding higher through frequently turbulent August and September (since 1950, September is the worst month for S&P 500 and August is second worst based upon average percent change) to a peak in early October. From then until the following April, during the “Best Six Months,” VIX is generally in decline as the market is climbing higher. If VIX has reached its seasonal low for 2017, then more days like last Wednesday could be on their way.
ETF Portfolio Updates
In accordance with the actions detailed in our
Seasonal MACD Sell Signal Alert emailed after the close on May 17, several positions have been closed out and several defensive positions have been added to the portfolio.
SPDR DJIA (DIA),
SPDR S&P 500 (SPY),
Vanguard REIT (VNQ),
iShares DJ Transports (IYT) and
SPDR Consumer Discretionary (XLY) were all closed out using their respective average daily prices on May 18. The average gain across these five positions was 8.8% excluding any dividends or trading fees.
ProShares UltraShort Silver (ZSL) and the short position in SPDR Gold (GLD) were exited using their average prices on May 19. ZSL and short GLD were exited for an average loss of 3.9%. A weakening U.S. dollar and a significant improvement in Stochastic, relative strength and MACD indicators applied to gold and silver prices were factors in reversing these positions. Long half-positions in iShares Silver (SLV) and GLD were established on May 18 when both traded below their buy limits. SLV and GLD longs are currently up an average 1.3%. GLD and SLV can still be considered on dips below their buy limits.
Other defensive positions for the “Worst Months,” iShares 20+ Year Bond (TLT), iShares Core US Aggregate Bond (AGG) and SPDR Utilities (XLU) have also been added to the portfolio. These are also half positions and they may be added to when we issue our Seasonal MACD Sell Signal for NASDAQ sometime on or after June 1. Our objective with the ETF portfolio at this time is to target a market neutral overall position. There are still long technology- and small-cap-related positions in the portfolio. Initial defensive positions are intended to offset the potential seasonal risks of continuing to hold long positions. TLT, AGG and XLU can all still be considered on dips below their buy limits.
Short positions in iShares DJ Transports (IYT) and SPDR Financials (XLF) have also been established. These trades are based upon historical sector weakness outlined on page 94 of the 2017 Almanac. Banks are frequently weak from the beginning of May until the beginning of July and transports can be weak from early May until mid-October. IYT and XLF short positions are on Hold.
All other positions not previously mentioned are on Hold. Please see updated ETF Portfolio table below for current suggested stop losses.
Disclosure Note: At press time, officers of the Hirsch Organization, or accounts they control held positions in AGG, FXB, GLD, IWM, QQQ, SLV, TLT, XLE, XLP and XLY.
|
Stock & ETF Portfolio Updates: Weaker Positions Culled
|
|
By:
Christopher Mistal
|
May 18, 2017
|
|
|
|
In just over a week it will be Memorial Day weekend. In recent years, this weekend has become the unofficial start of summer. Not long afterwards trading activity will likely begin to slowly decline (barring any external event triggers). We refer to this summertime slowdown in trading as the doldrums due to the anemic volume and uninspired trading on Wall Street. The individual trader, if they are looking to sell a stock, is generally met with disinterest from The Street. It becomes difficult to sell a stock at a good price. That is also why many summer rallies tend to be short lived and are quickly followed by a pullback or correction.
Below we have plotted the one-year seasonal volume patterns since 1965 for the NYSE and 1978 for NASDAQ against the annual average daily volume moving average for 2017 so far. The typical summer lull is highlighted in yellow. A surge in volume this summer, especially accompanied by gains, would be an encouraging sign that the bull market will continue. However, should traders lose their conviction and participate in the annual summer exodus from The Street, a market pullback or correction could quickly unfold.
Stock Portfolio Updates
Typically once we issue our Seasonal MACD Sell signal for DJIA and S&P 500, we would weed out the Almanac Investor Stock Portfolio by cutting weak or underperforming positions. This year existing stop losses have already been trimmed weaker positions. There is also an abundant supply of cash to deploy when new opportunities (long or short) come up.
In the four and a half weeks since last update, S&P 500 was 0.01% lower while Russell 2000 was down 0.8% as of yesterday’s close. The Almanac Investor Stock Portfolio’s blend of cash and long positions was weaker, down 1.4% over the same time period. Like the broader market, the bulk of the decline in the portfolio was the result of yesterday. Our Large-Cap portfolio performed best, up 0.4% while Small-Caps shed 1.2% and Mid-Caps tumbled 3.1%.
Once again, Almanac Investor Large-Caps were supported by a 6.8% gain by Arista Networks (ANET). Shares were trading at new all-time highs, above $148, as recently as Tuesday, May 16. Even after yesterday’s $5-plus decline, ANET’s chart is still bullish and its uptrend is still intact. ANET is on Hold.
UnitedHealth (UNH) also contributed to Large-cap gains. The healthcare industry is facing numerous uncertainties, but one thing that seems to not change is the rapidly escalating costs. The higher costs keep getting passed along to the consumer in the form of higher premiums and higher deductibles. Until this cycle slows or gets broken, UNH is likely headed higher. UNH is on Hold.
Although up just 0.7% since being added to the portfolio, Hershey Company (HSY) was a bright spot yesterday. As the broader market was struggling, HSY moved higher and reclaimed its 50-day moving average on above average volume. Today, HSY is continuing to advance. A close above $110 would further reinforce near-term bullishness. HSY is on Hold.
Our Mid-cap stocks were struggling somewhat even before yesterday’s declines. Scotts Miracle-Gro (SMG) reported Q2 earnings that failed to meet expectations on May 2. Both revenue and earnings missed. Management cited weather as a contributing factor. That’s the past and SMG appears to be an interesting way to gain exposure to the world of cannabis investment. One positive in an otherwise tepid earnings report was the 22% year-over-year growth in SMG’s hydroponics product line. SMG’s recent selloff looks overdone given the magnitude of its Q2 miss and solid growth in hydroponics. SMG is on Hold.
On May 16, Sabra Healthcare REIT (SBRA) closed below its stop loss of $23.46 and was closed out of the portfolio. A downgrade and a proposed merger, paid for with shares of SBRA, appear to be the key negatives that knocked shares down so abruptly. We will let this one go at least until after the ink dries on the merger.
After being the star of the Small-cap portfolio for the last few updates, Pressure Biosciences (PBIO) momentum faded and it closed below its stop loss of $0.25 on May 16. Having already sold half of the original position in late March, PBIO was closed out for a 78.1% gain.
IES Holdings (IESC) was also stopped out when it closed below $16.29 yesterday. For tracking purposes it was closed out using today’s opening price of $15.75. A disappointing second quarter earnings report on May 5 appears to have been the catalyst for the selloff.
All other positions, not mentioned above, are currently on Hold. Please refer to the updated portfolio table below for Current Advice about each specific position. Please note that some stop losses have been updated as a result of yesterday’s Sell signal.
ETF Portfolio Correction
In yesterday’s
Seasonal MACD Sell signal Alert, two new long trades in
SPDR Gold (GLD) and
iShares Silver (SLV) were presented. We intended to cancel and close out the positions in gold and silver that were
presented on May 4.
ProShares UltraShort Silver (ZSL) was added to the ETF Portfolio on May when it traded below $35.40.
Sell ZSL. GLD was shorted on May 5 using its average price of $116.94.
Cover GLD short trade. For tracking purposes, ZSL and short GLD will be closed out using their respective average prices on May 19.
A corrected version of yesterday’s ETF Portfolio table follows. A complete update is scheduled for next Tuesday, May 23.
Disclosure Note: At press time, officers of the Hirsch Organization, or accounts they control held positions in AGG, ANET, BUSE, CCS, FXB, GLD, HSY, IESC, IWM, MHO, PBIO, QQQ, RMCF, SBRA, SLV, TLT, XLE, XLP and XLY.
|
Tactical Seasonal Switching Strategy Update
|
|
By:
Jeffrey A. Hirsch & Christopher Mistal
|
May 17, 2017
|
|
|
|
As of today’s close, both the slower moving MACD indicators applied to DJIA and S&P 500 are negative (arrows in charts below point to a crossover or negative histogram on the slower moving MACD used by our Seasonal Switching Strategy to issue a sell). At this time, we are issuing our official Best Six Months MACD Seasonal Sell signal for DJIA and S&P 500. NASDAQ’s “Best Eight Months” last until June.
SELL SPDR DJIA (DIA), SPDR S&P 500 (SPY), Vanguard REIT (VNQ), iShares DJ Transports (IYT), SPDR Consumer Discretionary (XLY). For tracking purposes these positions will be closed out of the portfolio using their respective average prices on May 18.
Continue to HOLD technology and small cap related ETFs as NASDAQ’s “Best Eight Months” ends in June.
Consider BUYING half positions in iShares 20+ Year Treasury (TLT) on dips with a Buy Limit of $123.50 and iShares Core US Aggregate Bond (AGG) on dips with a Buy Limit of $109.50.
Open short trade ideas in iShares DJ Transports (IYT) and SPDR Financials (XLF) can be shorted. IYT could be shorted on a bounce near $159.74 or on a breakdown below $156.60. XLF could be shorted on a bounce to $23.50 or on a breakdown through $22.90.
Half positions could also be considered on dips in SPDR Utilities (XLU), iShares Silver (SLV) and SPDR Gold (GLD). Buy limits are in table below.
Traders/investors following the Best 6 + 4-Year Cycle switching strategy detailed on page 62 of the Stock Trader’s Almanac 2017 should heed this signal.
For positions not previously mentioned, please see table below for latest advice. Also note, several stop losses have been raised as a result of today MACD Seasonal Sell signal. The Almanac Investor Stock Portfolio will be updated tomorrow, May 18.
Disclosure Note: At press time, officers of the Hirsch Organization, or accounts they control held a position in FXB, IWM, IYT, QQQ, SPY, VNQ, XLE, XLP, XLV and XLY.
|
MACD & Mid-Month Update: Diverging Market at Inflection Point
|
|
By:
Christopher Mistal
|
May 16, 2017
|
|
|
|
As of the today’s close, the slower moving MACD “Sell” indicator applied to S&P 500 is still positive. DJIA’s slower moving MACD “Sell” indicator turned negative on the close on Friday, May 12th. To turn S&P 500’s slower moving MACD “Sell” indicator negative, a signal day loss exceeding 3.08 points (0.13%) is needed. DJIA’s MACD Sell indicator will remain negative tomorrow unless DJIA can gain at least 48.80 points (0.23%).
Continue to hold long positions associated with DJIA’s and S&P 500’s “Best Six Months.” We will issue our Seasonal MACD Sell signal when corresponding MACD Sell indicators applied to DJIA and S&P 500 both issue a sell signal.
Possible Major Inflection Point
As of yesterday’s close DJIA was up 6.2% year-to-date. S&P 500 was up 7.3% and NASDAQ was up an impressive 14.2%. S&P 500 and NASDAQ are well above historical average performance compared to past post-election years. DJIA is also above average, but by a lesser degree. The magnitude of outperformance can be seen in the following charts.
Although the major indices have clearly diverged from historical post-election year tendencies up until this point, there is still a possibility that they could revert to the mean before long. All three of the above charts have three distinct patterns that reasonably tracked one another until sometime in the second quarter of the year. S&P 500’s patterns converged in mid-April, DJIA’s patterns converged in April too and move in relative unison until mid-May. NASDAQ’s historical patterns also converged in mid-April and remain intertwined until mid-June.
This would seem to indicate that the market could be at a major inflection point. At this point in the past, all post-election years, on average, tended to see the market move sideways. Newly elected Democrats historically enjoyed continued market gains while newly elected Republican presidents were not as fortunate as early gains where surrendered.
Further evidence of a possible major inflection point is the developing divergences between the major indices now. NASDAQ and S&P 500 have been trading at and closing at new all-time highs, but DJIA and Russell 2000 have not. The Dow Jones Transports Index is also struggling. The Transports last closed at an all-time high on March 1 and have been struggling to reclaim their 50-day moving average since mid-March. Without the support and confirmation of other major indices, NASDAQ and S&P 500 are not likely to move much higher.
Market breath has also weakened recently. The broadest of the most widely tracked, the NYSE Composite A/D Line, has been moving sideways since late-April. The S&P 500 A/D has also been flat. NASDAQ Comp and Russell 2000 A/D lines peaked at the end of April and are lower now. When A/D Lines move inversely to their related index or average this is usually an indication that the benchmark is about to change course as the bulk of its constituents are already moving in a different direction.
Recent developments on the political and geo-political stages are also beginning to pile up in front of the market. North Korea’s seemingly endless missile launches could easily trigger a response and escalation from the West while the Trump administration cannot seem to get out of its own way and stay focused on its goals and objectives. Each passing day seems to bring less and less confidence in any kind of major tax policy reform which was a major catalyst behind the markets gains since Election Day.
At this juncture the market could go either way. DJIA and Russell 2000 could catch up to S&P 500 and NASDAQ and trade at new all-time highs. This would confirm the upside breakout is for real and the rally still has some legs. In this situation our Seasonal MACD Sell signal would most likely be delayed further. If the market should decide to go the other way and DJIA and Russell 2000 pull S&P 500 and NASDAQ back down, then our Seasonal MACD Sell signal would arrive much sooner. It has also been 460 calendar days since S&P 500 had a 10% or greater correction which is close to the average duration between corrections since 1949 of 514 calendar days.
Based upon incoming data and news, our
Base Case Annual Forecast odds are probably closer to 75% or 80% today than the 65% it was last December. The odds of Worst Case are unchanged at 5%, but the Best Case is now at 15-20%. The Trump Administration appears to be unable to stay focused and is still struggling to unite the Republican majority needed to achieve many of its goals.
|
MACD Update & Setting the Record Straight on “Sell in May”
|
|
By:
Jeffrey A. Hirsch & Christopher Mistal
|
May 11, 2017
|
|
|
|
As of the today’s close, the slower moving MACD “Sell” indicators applied to DJIA and S&P 500 are still positive. Recent mild losses are adding up and MACD is on the verge of issuing a sell signal. To turn S&P 500’s slower moving MACD “Sell” indicator negative, a single day loss exceeding 12.02 points (0.50%) is needed. DJIA’s MACD Sell indicator will turn negative tomorrow if DJIA fails to gain at least 12.33 points (0.06%).
Continue to hold long positions associated with DJIA’s and S&P 500’s “Best Six Months.” We will issue our Seasonal MACD Sell signal when corresponding MACD Sell indicators applied to DJIA and S&P 500 both issue a sell signal.
For the Record
Our Best Six Months Switching Strategy or “Sell in May” works. Any research to the contrary that goes back to 1900 on the DJIA (or even further back), is way too far back. Sell in May is an old British saw, soundly based on inherent behavioral finance patterns and the collective cultural behavior of the investment community, but it did not truly become a tradable investment strategy until after WWII.
The issue with starting way back then is the world is a much different place now than 100-plus years ago. Prior to about 1950, farming was a major portion of the U.S. economy and from 1901-1950, August was the best performing month of the year, up 36 times in 49 years (market closed in August 1914 due to World War I) with an average gain of 2.3%. July was the second best month, up 31 of 50 with an average gain of 1.5%. June was fourth best, averaging 0.9%. Why, you may ask? Simply: planting, sowing, reaping and harvesting. As crops were planted and then brought to market and sold, cash began to move and so did the stock market.
Agriculture’s share of GDP began to shrink post World War II as industrialization created a growing middle class that moved to the suburbs where hard-earned salaries would be spent filling new homes with all the modern conveniences we all take for granted now. Farming became more efficient and fewer and fewer people worked on the farm.
Suddenly, summer was less about the hard work of harvesting crops and more about vacations and relaxing. As the economy evolved and peoples’ lives changed, the market evolved. June and August went from being top performing months to bottom performing months. August went from #1 to #10 in 1950-2016 with an average DJIA loss of 0.2%. June went from #4 to #11 (–0.3% average loss). The shift in DJIA’s seasonal pattern is clear in the following chart. “Sell in May” is a post WWII pattern, prior to then it would have been “Buy in May”.
![[DJIA 1 Year Pattern]](/UploadedImage/AIN_0617_20170511_DJIA-1-Yr_Seasonal.jpg)
Back in 1986 we showed how most of the market’s gains were made in the “Best Six Months (BSM)” from November to April and that the market went sideways in the “Worst Six Months (WSM)” from May to October and is most susceptible to major declines during the Worst Six Months. From April 1950 to October 2016 the S&P 500 has gained 2420.72 points versus 264.31 points in the WSM. These six months combined have produced an average DJIA gain of 7.6% since 1950 compared to an average gain of just 0.4% during the months May to October.
We have improved the results of the strategy using the MACD technical indicator. Back in 1999 the late Sy Harding enhanced the BSM strategy by employing Gerry Appel’s MACD to improve entries and exits and dubbed it, “the best mechanical system ever.” Over the years we have refined the strategy further by corroborating more than one MACD, looking for confirmation across major market indices and taking MACD triggers earlier in the month.
While we never condone completely going away, we will be using our Seasonal MACD Sell signal as a call to action. We will let our winners run, trim weak and/or underperforming positions from the Almanac Investor Stock and ETF Portfolios and seek to begin adding some downside protection and/or defensive positions. When NASDAQ’s Seasonal Sell Signal triggers sometime on or after June 1 we will likely further strengthen our defensive posture.
|
Best & Worst Sectors of the “Worst Six Months”
|
|
By:
Christopher Mistal
|
May 09, 2017
|
|
|
|
As of the today’s close, both the faster moving MACD “Buy” and slower moving MACD “Sell” indicators applied to DJIA and S&P 500 are still positive. Recent sideways trading is putting pressure on the positive trends of the MACD indicators, but they still remain positive. To turn the slower moving MACD “Sell” indicator negative, single day losses by DJIA and S&P 500 would need to equal or exceed 1.09% (228.21 points) and 1.29% (31.03 points) respectively.
Continue to hold long positions associated with DJIA’s and S&P 500’s “Best Six Months.” We will issue our Seasonal MACD Sell signal when corresponding MACD Sell indicators applied to DJIA and S&P 500 both crossover and issue a sell signal.
Best & Worst Sectors
Because we already know that the market tends to post the majority of its gains from November through April and does very little from May to October using data from 1950 to present, we are not going to bother debating whether one should actually sell in May or not. Instead, let’s focus on what tactical changes can be made in portfolios to take advantage of what actually does work during the “Worst Six Months” while either shorting or outright avoiding the worst of the worst.
In the following table, the performance of the S&P 500 during the “Worst Six Months” May to October is compared to fourteen select sector indices or sub-indices, gold and the 30-year Treasury bond. Nine of the fourteen indices chosen were S&P Sector indices. Gold and 30-year bond are continuously-linked, non-adjusted front-month futures contracts. With the exception of two indices, 1990-2016, a full 27 years of data was selected. This selection represents a reasonably balanced number of bull and bear years for each and a long enough timeframe to be statistically significant while representing current trends. In an effort to make an apple-to-apple comparison, dividends are not included in this study.
![[Various Sector Indices & 30-Year Treasury Bond versus S&P 500 during Worst Six Months May-October Since 1990 table]](/UploadedImage/AIN_0617_20170509_Best-Worst_Sectors_Worst-6-Months.jpg)
Using the S&P 500 as the baseline by which all others were compared, seven indices outperformed during the “Worst Six Months” while nine underperformed based upon “AVG %” returned. At the top of the list are Biotech and Healthcare with average gains of 8.83% and 4.64% during the “Worst Months.” But, before jumping into Biotech positions, only 22 years of data was available and in those years Biotech was up just 50% of the time from May through October. Some years, like 2014, gains were massive while in down years losses were frequently nearly as large.
Runner-up, Healthcare with 27 years of data and a 63% success rate is probably a safer choice than Biotech. Its 4.64% AVG % performance comes by way of one less loss in five additional years of data and just two double-digit losses, both in bear markets during 2002 and 2008.
Other “Worst Six” top performers consisted mostly of the usual suspects when considering defensive sectors. Consumer Staples, 30-year Treasury bonds, gold and Utilities all bested the S&P 500. Information Technology also performed surprisingly well, but appears to be highly correlated with S&P 500 (losing years in bear markets and similar monthly performance figures). Although not the best sector by AVG %, Consumer Staples advancing 81.5% of the time is the closed thing to a sure bet for gains during the “Worst Months.”
At the other end of the performance spectrum we have the sectors to short or avoid altogether. The Materials sector was the worst over the past 27 years, shedding an average 2.31% during the “Worst Six.” PHLX Gold/Silver, Transportation, and Industrials also recorded average losses. However, based solely upon the percentage of time up, the stocks only, PHLX Gold/Silver index is the most consistent loser of the “Worst Six” advancing just 40.7% of the time.
![[PHLX Gold/Silver mini-table]](/UploadedImage/AIN_0617_20170509_Gold-Silver-Stocks.jpg)
Also interesting to note is the fact that every sector, gold and 30-year bonds are all positive in May, on average. It’s not until June when things begin to fall apart for many sectors of the market and the market as a whole. July tends to see a broad bounce, but it tends to be short-lived as August and September tend to be downright ugly on average. It is this window of poor performance that has given October a lift in the past 27 years. Only Biotech, 30-year bonds, gold (futures & gold& silver stocks), natural gas stocks and Utilities manage to post gains in both August and September.
Based upon % Up during the “Worst Six Months,” Consumer Staples and Utilities look like the best place to be while Gold/Silver mining stocks (XAU), Transports and Materials could be shorted or avoided. May also looks like a great time to rebalance a portfolio as you will likely be closing out long positions into strength and short trade ideas are worth considering given June’s nearly across-the-board poor performance.
|
MACD Update & Seasonal Sector Trades: Gold & Silver Break Down
|
|
By:
Christopher Mistal & Jeffrey A. Hirsch
|
May 04, 2017
|
|
|
|
As of the today’s close, both the faster moving MACD “Buy” and slower moving MACD “Sell” indicators applied to DJIA and S&P 500 are still positive. Recent sideways trading is putting pressure on the positive trends of the MACD indicators, but they still remain positive. To turn the slower moving MACD “Sell” indicator negative, single day losses by DJIA and S&P 500 would need to exceed 1.90% (397.62 points) and 1.68% (40.19 points) respectively.
Continue to hold long positions associated with DJIA’s and S&P 500’s “Best Six Months.” We will issue our Seasonal MACD Sell signal when corresponding MACD Sell indicators applied to DJIA and S&P 500 both crossover and issue a new sell signal.
Sinking Silver
Silver has a strong tendency to peak or continue lower in May, bottoming in mid to late June. Traders can look to sell silver on or about May 12 and maintain a short position until on or about June 23. In the past 44 years this trade has seen declines 29 times for a success rate of 65.9%. Prior to 2014, this trade had been successful for eight years in a row. Two years ago, this trade was successful while last year silver bottomed in early June resulting in a loss. This trade has been successful in 9 of the last 11 years. In the second chart below, the 44-year historic average seasonal price tendency of silver as well as the decline typically seen from mid-May until the low is posted in late June into early July is shown. This May silver short trade captures the tail end of silver’s weak seasonal period (shaded yellow) that typically begins in late February or early March.
![[May Short Silver Futures Contract – Trade History]](/UploadedImage/AIN_0617_20170504_SI_History.jpg)
![[Silver Continuous Contract Daily Bar Chart & 1-Yr Seasonal Pattern]](/UploadedImage/AIN_0617_20170504_SI_Seasonal.jpg)
ProShares UltraShort Silver (ZSL) corresponds to two times the inverse of the daily performance of silver. However, ZSL is not tracking spot silver price, rather it is tracking the U.S. dollar price for delivery in London. Nonetheless, ZSL has a solid history of rising when silver price declines. ZSL could be bought on dips below $35.40. If purchased, an initial stop loss of $32.21 is suggested. If ZSL then rises and closes above $38.95 switch to a 5% trailing stop loss. Use ZSL’s daily close to update its stop loss. This trade will be tracked in the Almanac Investor ETF Portfolio.
Gold’s Fading Appeal
Gold also tends to post seasonal bottoms in late June or early July, as demand increases when jewelers again stock up ahead of a the seasonal wedding event in India. Gold prices are also subject to spikes in demand from the investment community, as a hedge or protection from concerns over inflation or during times of economic instability or uncertainty. It is valued in terms of the U.S. dollar, so periods of dollar weakness can support gold’s value.
Shorting an August gold futures contract on or about May 19 and holding until the end of June has been fruitful in 27 of the last 42 years for a success rate of 64.3%. This trade’s best year was 2013 when stocks put up their best yearly performance in more than a decade. This trade has worked in 8 of the last 11 years.
The success of this trade and/or silver’s trade will likely depend on the Fed, what it does or does not do with interest rates and whether or not the Trump Administration can come through on tax reform. Traditional jewelry and industrial demand is likely to follow historical patterns but investment demand is the wildcard. Gold is an appealing store of wealth when the U.S. dollar is weakening and gold is clearly competitive with cash, especially in countries with negative interest rates. Those negative rates are no different than having to pay a storage fee for physical gold or an expense ratio for holding an ETF consisting of gold.
Instead of using a leveraged, inverse gold ETFs or ETNs a basic short position in SPDR Gold (GLD) will be the path taken to execute a trade. GLD could be shorted now as it has broken down through support with confirming negative stochastic, MACD, and relative strength indications. An initial stop loss of $120.00 is suggested. For tracking purposes, a GLD short position will be established in the Almanac Investor ETF Portfolio using GLD’s average trading price on May 5, 2017.
|
Seasonal MACD & ETF Portfolio Update: Double-Digit Gains Abound
|
|
By:
Christopher Mistal
|
May 02, 2017
|
|
|
|
As of the today’s close, both the faster moving MACD “Buy” and slower moving MACD “Sell” indicators applied to DJIA and S&P 500 are still positive. Recent sideways trading is beginning to put pressure on the positive trends of the MACD indicators, but they still remain positive. To turn the slower moving MACD “Sell” indicator negative, single day losses by DJIA and S&P 500 would need to exceed 2.64% (over 553 points) and 2.5% (nearly 60 points) respectively.
Continue to hold long positions associated with DJIA’s and S&P 500’s “Best Six Months.” We will issue our Seasonal MACD Sell signal when corresponding MACD Sell indicators applied to DJIA and S&P 500 both crossover and issue a new sell signal.
ETF Portfolio Update
Since issuing our Seasonal MACD “Buy” Alert on October 24, 2016, core Best Months Switching Strategy positions in SPDR DJIA (DIA), iShares Russell 2000 (IWM), PowerShares QQQ (QQQ) and SPDR S&P 500 (SPY) have all advanced an average of 14.1% as of yesterday’s close. All four positions have achieved above historical average returns for the current “Best Months” period. Other positions added on the same date are also performing well, up 14.2% on average.
On April 25,
SPDR Materials (XLB) traded above $53.45 for the first time. Per last month’s
ETF Trades Alert, the existing long position was sold (for a 14.1% gain) and a short position was established (as of yesterday’s close, a modest 0.7% gain was present).
Direxion Daily Jr. Gold Miners 3x (JDST), another trade idea from early last month has run away and this trade is cancelled. The original trade price of $13.00 has been adjusted to $52.00 due to a recent 1-for-4 reverse split.
Other short trade ideas from last month in SPDR Financials (XLF) and iShares DJ Transports (IYT) have not been executed yet. If the short IYT trade reaches its buy limit before we issue our Seasonal Sell Alert, the existing long position will be closed out at the same time the short position is established.
Seasonal strength in copper typically runs from mid-December to mid-April or early May. This year copper appears to have peaked in February and has been weak since. Sell iPath Bloomberg Copper ETN (JJC). For tracking purposes, JJC will be closed out using its average daily price on May 3.
All long positions remain on hold. Please see table below for updated stop losses and current advice.
Disclosure Note: At press time, officers of the Hirsch Organization, or accounts they control held positions in FXB, IWM, IYT, QQQ, SPY, VNQ, XLB, XLE, XLP, XLV and XLY.