|
Market at a Glance - 1/27/2022
|
|
By:
Christopher Mistal
|
January 27, 2022
|
|
|
|
1/27/2022: Dow 34160.78 | S&P 4326.51 | NASDAQ 13352.78 | Russell 2K 1931.29 | NYSE 16152.12 | Value Line Arith 9017.79
Seasonal: Neutral. February is part of the “Best Six Months,” but it is historically the poorest performing month of the six. February ranks #8 for DJIA, #11 S&P 500 and #10 for NASDAQ. Russell 2000 tends to outperform in February most likely due to carry over of the January Effect. Midterm Februarys have historically been better, but still only mid-pack for DJIA and S&P 500.
Fundamental: Mixed. Initial Q4 GDP came in at a solid 6.9% annualized pace, much better than estimates. Inflation rose 7% on a year-over-year basis in December, the highest reading since June 1982 while “core” inflation was up 5.5%. Supply chain disruptions persist and are likely to continue to elevate inflation readings as demand outpaces supply. Omicron continues to spread, but the pace appears to be slowing. Earnings have been fair but the monster numbers of last year make for tough comparisons.
Technical: Correcting. DJIA, S&P 500, NASDAQ & Russell 2000 have all fallen below their respective 50- and 200-day moving averages. Russell 2000 has satisfied the 20% decline from its closing high used by many sources as the definition of a bear market, down 20.9%. NASDAQ is not far behind, down 16.8% from its November closing high through today’s close. S&P 500 is down 9.8% while DJIA is holding up best, down 7.2%.
Monetary: 0 – 0.25%. Following the first Fed meeting of 2022, QE is scheduled to end just ahead of mid-March and the first rate increase could come then as well. Our guess for rate increases would be one 0.25% increase at each meeting in March, June, September and December this year which would put Fed funds at 1-1.25% at year’s end. There has been no real rush to end QE and the Fed has tolerated year-over-year inflation above 5% since last June. This measured pace of rate increases is also rather consistent with their repeated dependency on data.
Psychological: Sliding. According to
Investor’s Intelligence Advisors Sentiment survey Bullish advisors have retreated to 34.9%. Correction advisors stand at 38.4% while Bearish advisors are at 26.7% as of their January 26 release. Even though this is a significant shift away from the elevated bullish levels last seen in November, overall sentiment has not yet reached levels that have historically been seen at substantial buying opportunities. When Bearish advisors begin to swell, that could indicate a bottom is near.
|
February Outlook: Heightened Volatility Expected to Continue Through the Midterm Elections
|
|
By:
By Jeffrey A. Hirsch & Christopher Mistal
|
January 27, 2022
|
|
|
|
In our 2022 Annual Forecast last month we were candid about our less than sanguine outlook for 2022 and that we were expecting a reversion to the mean in annual returns and a decent correction. We shared the many obstacles and hurdles we felt the market would be facing in 2022. First and foremost are the forces of the 4-Year Cycle and the impact the midterm elections have on the market.
Midterm election years are notoriously volatile as the two political parties battle it out with the opposing party hammering the incumbent president publically, politically and legislatively to control Congress. And this is particularly pronounced for first term presidents like Joe Biden. We have added 2022 year-to-date performance to our chart here of the “S&P 500 Midterm Election Year Seasonal Pattern” and it’s not pretty.
The market has already exceeded the average midterm low this year. But we might find some solace from the table on page 34 in the 2022 Almanac on “Why A 50% Gain in the Dow Is Possible from Its 2022 Low to Its 2023 High.” In the table on that page you will note that of the 27 midterm lows since 1914 the month with the most midterm year lows is January with six. That’s not to say we believe the low for the year is in as the midterm low as you can see in the chart usually comes during the weak spot of the 4-Year Cycle during Q2 or Q3.
Selling Climax Finding Support
The current volatile selloff is disconcerting for the market with several technical support levels already having been breached and support near the October 2021 low around the S&P 500 4300-level currently under attack. Interestingly though, the old stodgy DJIA has been holding up best finding some support for now around 34000. DJIA has not closed below its December closing low of 34022.04 reached on December 1, which means the “December Low Indicator” (2022 Almanac page 36) has not been triggered.
Technical damage has been done, with the major averages breaking through the old uptrend line from the October 2020 low, falling below their 200-day moving averages and now finding resistance at those 200-DMA levels. But we may have seen an Advance/Decline Ratio Selling Climax when more than 70% of total issues traded declined on January 18 and 21 with less than 20% advancing. If the market can find some support here at least in the short-term we could see the market rally into the end of the Best Six Months in April.
But the market still faces obstacles beyond the adverse midterm year forces and the technical breakdown. Geopolitically, pressures have not abated as the situation with Russia and Ukraine remains fluid and the diplomatic dance with China on Taiwan and other fronts continues as well as the usual hot button issues in the Mideast and with North Korea. Rich valuations have come down a bit but they are still elevated. Corporations will have difficulty beating last year’s results with 2021 year-over-year comparisons being a hard act to follow in 2022. Then there is inflation and the Fed shifting from its longtime extremely accommodative stance to a neutral/tightening bias.
And of course there are the discouraging results from our January Indicator Trifecta. The Trifecta started the year on a positive note with the Santa Claus Rally (SCR) coming in with a gain on the second trading day of the year. But that was quickly squashed as the S&P 500
declined for the First Five Days (FFD) of January. And with only two trading days left in January it is highly unlikely our January Barometer (JB) will be positive. S&P 500 would need to rally 10.2% or 439.68 points to overtake the 2021 close of 4766.18 – a tall order indeed. Years when SCR was up but the FFD and the JB were down were not bullish. Only one of the eight occurrences (2014) saw full year gains. A Down January is not a positive indication for the year (
2022 Almanac page 22).
But there are some positives. The economy is booming with the full-year 2021 GDP number the best reading in three decades since we came out of the double dip recession in 1984. And while the market is suffering from Fed phobia we expect the Fed to be in no rush to quell inflation with a major tightening cycle. They have not been in any hurry up to now so why would they suddenly speed up. They will most likely remain data dependent and maintain their wait-and-see attitude. We expect 4 rate hikes this year and for them to occur at the FOMC meetings associated with their Summary of Economic Projections in March, June, September and December. But most importantly, even after the anticipated increases, rates will remain historically low.
All in all we expect the market to find support here in February and then rally back toward the recent highs by the end of the Best Six Months in April. After that we expect a retest of the current lows and perhaps lower lows in the Worst Six Months of 2022, the weak spot of the 4-Year Cycle, followed by a Q4 rally at the beginning of the sweet spot of the 4-Year Cycle in line with our
2022 Annual Forecast Base Case Scenario with S&P 500 and DJIA finishing 2022 up 5-10% and NASDAQ slightly weaker.
Pulse of the Market
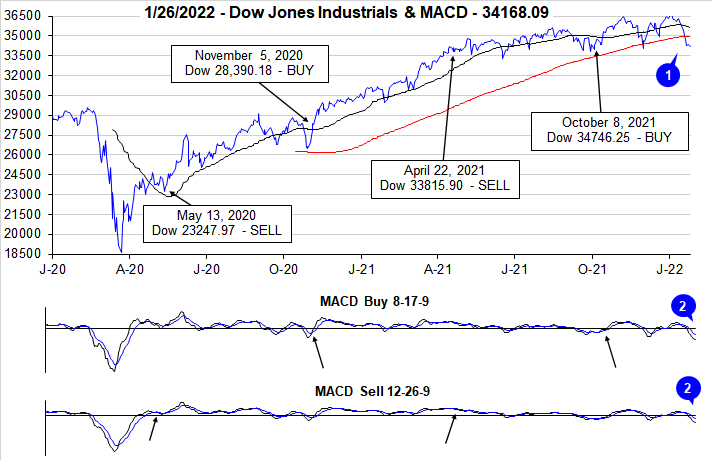
For the second time in as many months, DJIA has fallen below its 200-day moving average (1). DJIA’s last excursion in early December lasted just one day while it’s currently been six days, including today. Now that this key support level has failed, it is increasingly likely to be ever more challenging to reclaim the 200-day moving average level. At yesterday’s close DJIA was down 6.0% and on course for its eighth worst January since 1901 based upon percent. DJIA’s brisk retreat is confirmed by negative readings from both the faster and slower MACD indicators (2).
DJIA (3), S&P 500 (4), and NASDAQ (5) have all declined for three weeks in a row and since the second week of November DJIA and NASDAQ have only advanced in three weeks of eleven weeks. S&P 500 has a slightly better record with four weekly gains over the same time period. During this market retreat, DJIA has logged three Down Friday/Down Monday (DF/DM) occurrences with two landing in January. Historically, DF/DM occurrences have frequently been a warning as numerous occurrences were followed by further declines sometime during the next 90 calendar days.
NYSE Weekly Advancers and Weekly Decliners (6) have been consistent with the market’s move. Decliners have outnumbered Advancers during losing weeks while the opposite occurred in advancing weeks. Last week’s 3262 NYSE Weekly Decliners suggests there is broad participation in the current market correction. A week of solid gains accompanied by a solid number of Weekly Advancers that exceed Weekly Decliners could be an early indication that the market is on the verge of or has changed its course. Baes upon historical seasonal pattern for Midterm years, this may happen anytime between now and around mid-February. But, for this to transpire, the market first needs to accept the fact that the Fed is ending QE and will be raising rates.
With major indexes falling every week this year, Weekly New Highs (7) continued to contract after a brief reprieve during the last week of 2021. New Lows have ballooned to their highest level since the start of the pandemic in March of 2020. When major indexes find support and begin to turn the corner, the number of New Lows should be the first to turn.
Even after another inflation reading came in at a multi-decade high and the Fed essentially laid out its path to rising rates, the 30-year Treasury yield (8) has only risen to just above 2%. Although higher than any reading in the last 20 weeks, the 30-year Treasury yield still has not exceeded its own high yield from last March. Yields across the curve have been on the increase, but compared to historical levels all remain low.
Click for larger graphic…
|
February Almanac: Historical Performance Improves in Midterm Years
|
|
By:
Jeffrey A. Hirsch & Christopher Mistal
|
January 27, 2022
|
|
|
|
Even though February is right in the middle of the Best Six Months, its long-term track record, since 1950, is rather tepid. February ranks no better than sixth and has posted meager average gains except for the Russell 2000. Small cap stocks, benefiting from “January Effect” carry over; historically tend to outpace large cap stocks in February. The Russell 2000 index of small cap stocks turns in an average gain of 1.1% in February since 1979—just the sixth best month for that benchmark. With Russell 2000 lagging this January, prospects for February outperformance appear slim.
In midterm years, February’s performance generally improves with average returns all increasing. Here again it is the Russell 2000 small-cap index that shines brightest gaining 1.4% on average since 1982. Russell 1000 is second best, averaging gains of 0.8% since 1982. DJIA and NASDAQ average gains of 0.7% (since 1950 & 1974) while S&P 500 lags with average advance of 0.5% (since 1974).
![[Midterm Year February Performance Table]](/UploadedImage/AIN_0222_20220127_Mideterm_February_2022_Stats_mini.jpg)
The first trading day is bullish for DJIA, S&P 500 and NASDAQ. Average gains on the first day over the last 21-year period are right around 0.4%. Strength then tends to fade after that until the stronger fourth, sixth, ninth, ten and eleventh trading days. Expiration week had a spotty longer-term record but had been improving recently. Russell 1000 and Russell 2000 have advanced 10 of the last 12 years during options expiration week. Declines occurred in 2020 & 2021. The week after also had a clear negative bias that appears to be fading even though average losses remain across the board for the past 32 years.
Presidents’ Day is the lone holiday that exhibits weakness the day before and after (Stock Trader’s Almanac 2022, page 100). The Friday before this mid-winter three-day break can be treacherous and average declines persist for three trading days after the holiday going back to 1980. In recent years, trading before and after the holiday has been more bullish. S&P 500 has been up 10 of the last 11 years on the day before and NASDAQ has been up 7 of the last 9 years on the day after.
|
February 2022 Strategy Calendar
|
|
By:
Christopher Mistal
|
January 27, 2022
|
|
|
|
|
Stock Portfolio Updates: Free Lunch Spoiled, But Banks & Defense Shine
|
|
By:
Christopher Mistal
|
January 20, 2022
|
|
|
|
Today’s market reversal further diminishes the prospects for a rebound and positive reading from our January Barometer. There have been some recent and brisk rallies but with seven trading days remaining in the month and S&P 500 needing a gain of at least 6.32% to get back to break even for the year the likelihood of such a rally is shrinking by the minute and the odds of a more typical (and challenging) midterm year are increasing.
![[S&P 500 Midterm Seasonal Pattern Chart]](/UploadedImage/AIN_0222_20220120_SP500_Seasonal.jpg)
Looking at the familiar chart above of various midterm year scenarios that are all in play this year compared to All Years, we can see it is not unusual for January to be a tough month in midterm years. The magnitude of the decline this year is greater than the historical average, but the S&P 500 appears to be following the historical pattern rather closely. If this is the case, then weakness could persist into February before the market finds footing and possibly rallies through the remainder of the first quarter into early Q2. If you missed yesterday’s webinar, this pattern was covered as well as the buying opportunities that have historically occurred in midterm years. You can access the
slides and recording here.
Free Lunch Update
Recent market weakness was not kind to the
Free Lunch stocks selected in December. Typical small-cap outperformance frequently seen from around mid-December through January and often into February did not materialize this year. Instead the Russell 2000 is the worst performing index year-to-date. As result, only four of the 26 stocks selected are still active in the
Almanac Investor Portfolio, below. All 26 were added to the portfolio using their respective average daily prices on December 20. All suggested guidelines in the Free Lunch Alert were applied to the basket. The 8% trailing stop loss proved effective in limiting losses with numerous positions closed out at better levels than now.
As a reminder, Free Lunch stocks are not intended to be held for long. As witnessed this year, many of these stocks were down for good reasons and can easily go much lower especially when the market is also in decline. We will continue to hold the four remaining positions with the 8% trailing stop loss based on closing prices.
Stock Portfolio Updates
Over the last six weeks since last update through yesterday’s close, S&P 500 declined 3.6% while Russell 2000 dropped 9.2%. Over the same time period the entire portfolio gained 0.9%, excluding dividends and any fees. Our Small- and Large-cap positions were responsible for the portfolio’s gain. In the Small-cap portfolio, the steepening yield curve lifted Atlantic Union Bankshares (AUB), WSFS Financial (WSFS) and Customers (CUBI). In the Large-cap portfolio, utilities and energy-related stocks were the leaders.
On the other end of the performance spectrum, three positions outside of the Free Lunch stocks, were stopped out since last update. Entravision Communications (EVC) closed below its stop on January 5 and has been closed out. Aaon Inc (AAON) and Green Brick (GRBK) were also stopped out this month in the Mid-cap portfolio.
As per our last Stock Portfolio update, half of existing positions in BKH, AEE, DTE, DUK, EXC and SO were sold on December 10. It was anticipated that rising interest rates would put pressure on these positions, but due to their defensive nature they have held up well with respectable gains over the last six weeks even as rates have moved higher. The remaining positions in BKH, AEE, DTE, DUK, EXC and SO are on Hold.
Another area of the portfolio that has enjoyed success recently in the face of a challenging market has been AT&T (T) and Verizon (VZ). Both T and VZ are now positive in the portfolio and on Hold. Their dividend was the main draw when they were originally presented and that is still true now.
Shortly after the last update, Kansan City Southern (KSU) and Canadian Pacific Railway (CP) completed their merger. For each share of KSU held, $90 and 2.884 shares of CP were received. KSU has been removed from the portfolio and the new shares of CP have been added. CP is on Hold.
Please see the table below for updated stop losses and current advice for positions not covered above.
|
ETF Trades & Portfolio Updates: Winter Temps Often Boost Natural Gas
|
|
By:
Christopher Mistal
|
January 13, 2022
|
|
|
|
Based upon the NYSE ARCA Natural Gas Index (XNG) there is a seasonal tendency for natural gas companies to enjoy gains from the end of February through the beginning of June. Detailed in the Stock Trader’s Almanac 2022 on page 94, this trade has returned 13.8%, 11.5%, and 19.3% on average over the past 15, 10, and 5 years respectively. Seasonal strength can be seen in the following chart, highlighted in yellow.
One of the factors for this seasonal price gain is consumption driven by demand for heating homes and businesses in the cold weather northern areas in the United States. In particular, when December and January are colder than normal, we can see drawdowns in inventories through late March and occasionally into early April. This has a tendency to cause price spikes lasting through mid-April and beyond. Crude oil also has a tendency to rise during this timeframe in anticipation of the summer driving season.
First Trust Natural Gas (FCG) is an excellent choice to gain exposure to the company side of the natural gas sector. FCG could be bought near current levels with a buy limit of $19.75. Once purchased, consider using an initial stop loss of $17.78 and take profits at the auto sell, $26.97. As a reminder the auto sell price is based upon FCG’s buy limit plus the sector’s average price return over the last 15 years with an additional 20% added. Top five holdings by weighting as of yesterday’s close are: Western Midstream Partners, ConocoPhillips, DCP Midstream, Occidental Petroleum and EOG Resources. The net expense ratio is reasonable at 0.6% and the fund has approximately $508.8 million in assets.
Sector Rotation ETF Portfolio Update
Broad market strength in late-December did continue into the New Year but proved short-lived as Fed Minutes released last week revealed the Fed was ready to be more aggressive in its efforts to control inflation. A quicker end to QE and a brisker rate hike cycle is something the market apparently is still struggling to come to terms with. Thus far, growth stocks and small caps have been hit the hardest. Many positions in the Sector Rotation portfolio are off of their respective recent highs, but with the exception of SPDR S&P Biotech (XBI) every open position in the portfolio is positive.
Today XBI closed below its suggested stop loss. Instead of closing out the position we are going to officially add to the existing position. New purchases of XBI can be considered up to a buy limit of $100.00. We intend to make XBI a core holding in the portfolio and will continue to accumulate on dips. For tracking purposes, we will add to the existing XBI position using its average price on January 14.
Per the December 2 update, iShares DJ US Telecom (IYZ) was sold and closed out of the portfolio using its average price on December 3 of $31.16. Telecom’s seasonally favorable period has historically ended in December and IYZ’s failure to deliver heading into to December were the reasons for its sale.
November’s Seasonal Sector Trades ideas targeting seasonal strength in copper now appear in the portfolio. United States Copper (CPER) and Global X Copper Miners (COPX) were added in mid-November. CPER and COPX are on Hold.
With the exception of FCG and XBI, all other positions in the portfolio are currently on Hold. Many positions have enjoyed respectable gains and the broad market is in a seasonally soft patch that can last from now into February. Please see table for updated buy limits and stop losses.
Tactical Seasonal Switching Strategy Portfolio Update
As of yesterday’s close, the Tactical Seasonal Switching Strategy portfolio had an average gain of 4.2% since our Seasonal Buy Signal. SPDR S&P 500 (SPY) was the top performing position in the basket, up a solid 7.7%. Second place belonged to Invescos QQQ (QQQ), up 7.4% while iShares Russell 2000 (IWM) is the laggard of the bunch, down 2.7%. All positions in the portfolio are on Hold.
Please note, positions in the Tactical Switching Strategy portfolio are intended to be held until we issue corresponding Seasonal MACD Sell Signals after April 1. As a result, no stop loss is suggested on these positions.
|
First Five Days Were Down, but a Positive January Barometer Could Salvage Trifecta
|
|
By:
Jeffrey A. Hirsch & Christopher Mistal
|
January 07, 2022
|
|
|
|
Having failed to recover Wednesday’s losses by today’s close, the S&P 500 is now down 1.9% year-to-date and thus our First Five Day (FFD) early warning system is negative. This is the first down FFD since 2016 when the period slide 6.0%. However, the S&P 500 finished that year with a 9.5% gain. Additionally, the FFD indicator does not have a great track record in midterm election years. In the last 18 midterm election years only 8 full years followed the direction of the FFD and of the seven down FFDs in midterm years just two full years were down, 1962 & 1974.
Earlier this week the Santa Claus Rally was positive, but today the FFDs was negative. At this juncture there are two possible outcomes remaining for our January Indicator Trifecta. Our January Barometer can either be positive or negative. The historical results of both are visible in the following tables.
A positive January Barometer would certainly boost prospects for full-year 2022 even after today’s down FFD. Following the previous six occurrences when the SCR was positive, the FFD were negative and the January Barometer was positive, S&P 500 advanced five times over the remaining eleven months and for the full year with average gains of 9.7% and 11.8% respectively. The December Low Indicator (2022 STA, page 36) should also be watched with the line in the sand at the Dow’s December Closing Low of 34022.04 on 12/1/2021.
|
Yale Hirsch’s Incredible January Barometer: Only 13 Major Errors in 84 Years
|
|
By:
Jeffrey A. Hirsch & Christopher Mistal
|
January 06, 2022
|
|
|
|
Devised by Yale Hirsch in 1972, the January Barometer (JB) has registered 12 major errors since 1950 for an 83.3% accuracy ratio. This indicator adheres to propensity that as the S&P 500 goes in January, so goes the year. Of the twelve major errors Vietnam affected 1966 and 1968. 1982 saw the start of a major bull market in August. Two January rate cuts and 9/11 affected 2001.The market in January 2003 was held down by the anticipation of military action in Iraq. The second worst bear market since 1900 ended in March of 2009 and Federal Reserve intervention influenced 2010 and 2014. In 2016, DJIA slipped into an official Ned Davis bear market in January. 2018 was the tenth major error overall as a hawkish Fed, a trade war and slowing global growth concerns resulted in the worst fourth quarter performance by S&P 500 since 2008. Covid-19 impacted 2020 & 2021. Of the 12 major errors, nine have occurred since 2001. Including the eight flat years yields a .722 batting average.
As the opening of the New Year, January is host to many important events, indicators and recurring market patterns. U.S. Presidents are inaugurated and present State of the Union Addresses. New Congresses convene. Financial analysts release annual forecasts. Residents of earth return to work and school en masse after holiday celebrations. On January’s second trading day, the results of the official Santa Claus Rally are known and on the fifth trading day the First Five Days “Early Warning” system sounds off, but it is the whole-month gain or loss of the S&P 500 that triggers our January Barometer.
And yet for some reason, every February or sooner if January starts off poorly our January Barometer gets raked over the coals. It never ceases to amaze us how our intelligent and insightful colleagues, that we have the utmost professional respect for and many of whom we consider friends, completely and utterly miss the point and relentlessly argue the shortcomings of the January Barometer. However, this year we are not waiting until this happens again. Instead, here is why the January Barometer is still highly relevant and why it should not be dismissed so quickly.
1933 “Lame Duck” Amendment—Why JB Works
Many detractors refuse to accept the fact the January Barometer exists for one reason and for one reason only: the Twentieth “Lame Duck” Amendment to the Constitution. Passage of the Twentieth Amendment in 1933 created the January Barometer. Since then it has essentially been “As January goes, so goes the year.” January’s direction has correctly forecasted the major trend for the market in many of the subsequent years.
Prior to 1934, newly elected Senators and Representatives did not take office until December of the following year, 13 months later (except when new Presidents were inaugurated). Defeated Congressmen stayed in Congress for all of the following session. They were known as “lame ducks.”
Since 1934, Congress convenes in the first week of January and includes those members newly elected the previous November. Inauguration Day was also moved up from March 4 to January 20.
January’s prognostic power is attributed to the host of important events transpiring during the month: new Congresses convene; the President typically gives the State of the Union message, presents an annual budget and sets national goals and priorities.
These events clearly affect our economy and Wall Street and much of the world. Add to that January’s increased cash inflows, portfolio adjustments and market strategizing and it becomes apparent how prophetic January can be. Switch these events to any other month and chances are the January Barometer would become a memory.
JB vs. All
Over the years there has been much debate regarding the efficacy of our January Barometer. Skeptics never relent and we don’t rest on our laurels. Disbelievers in the January Barometer continue to point to the fact that we include January’s S&P 500 change in the full-year results and that detracts from the January Barometer’s predicative power for the rest of the year. Others attempt to discredit the January Barometer by going further back in time: to 1925 or 1897 or some other random year.
After the Lame Duck Amendment was ratified in 1934 it took a few years for the Democrat’s heavy congressional margins to even out and for the impact of this tectonic governing shift to take effect. In 1935, 1936 and 1937, the Democrats already had the most lopsided Congressional margins in history, so when these Congresses convened it was anticlimactic. Hence our January Barometer starts in 1938.
In light of all this debate and skepticism we have compared the January Barometer results along with the full year results, the following eleven months results, and the subsequent twelve months results to all other “Monthly Barometers” using the Dow Jones Industrials, the S&P 500 and the NASDAQ Composite.
Here’s what we found going back to 1938. There were only 13 major errors. In addition to the 12 major errors detailed above: in 1946 the market dropped sharply after the Employment Act was passed by Congress, overriding Truman’s veto, and Congress authorized $12 billion for the Marshall Plan.
Including these 13 major errors, the accuracy ratio is 84.5% for the 84-year period. Including the 9 flat year errors (less than +/– 5%) the ratio is 73.8% — still effective. For the benefit of the skeptics, the accuracy ratio calculated on the performance of the following 11 months is still solid. Including all errors — major and flat years — the ratio is still a fair 66.7%.
Now for the even better news: In the 51 up Januarys there were only 4 major errors for a 92.2% accuracy ratio. These years went on to post 16.0% average full-year gains and 11.5% February-to-December gains.
Let’s compare the January Barometer to all other “Monthly Barometers.” For the accompanying table we went back to 1938 for the S&P 500 and DJIA — the year in which the January Barometer came to life — and back to 1971 for NASDAQ when that index took its current form.
The accuracy ratios listed are based on whether or not the given month’s move — up or down — was followed by a move in the same direction for the whole period. For example, in the 84 years of data for the S&P 500 for the January Barometer, 62 years moved in the same direction for 73.8% accuracy.
The Calendar Year ratio is based on the month’s percent change and the whole year’s percent change: i.e., we compare December 2021’s percent change to the change for 2021 as a whole. By contrast the 11-month ratio compares the month’s move to the move of the following eleven months. February’s change is compared to the change from March to January. The 12-month change compares the month’s change to the following twelve months. February’s change is compared to the change from March to the next February.
Though the January Barometer is based on the S&P 500 we thought it would clear the air to look at the other two major averages as well. You can see for yourself in the table that no other month comes close to January in forecasting prowess over the longer term.
There are a few interesting anomalies to point out though. On a calendar year basis DJIA in January is slightly better than the S&P. 2011 is a perfect example of how the DJIA just edges out for the year while the S&P does not. For NASDAQ April, September and November stick out as well on a calendar year basis, but these months are well into the year, and the point is to know how the year might pan out following January, not April, September or November. Plus, no other month has any basis for being a barometer. January is loaded with reasons.
Being the first month of the year it is the time when people readjust their portfolios, rethink their outlook for the coming year and try to make a fresh start. There is also an increase in cash that flows into the market in January, making market direction even more important. Then there is all the information Wall Street has to digest: The State of the Union Address in most years, FOMC meetings, 4th quarter GDP data, earnings, and the plethora of other economic and market data.
Myths Dispelled
In recent years new myths and/or areas of confusion have come to light. One of the biggest errors is the notion that the January Barometer is a stand-alone indicator that could be used to base all of your investment decisions for the coming year on. This is simply not true and we have never claimed that the January Barometer should or could be used in this manner. The January Barometer is intended to be used in conjunction with all available data deemed relevant to either confirm or call into question your assessment of the market. No single indicator is 100% accurate so no single indicator should ever be considered in a vacuum. The January Barometer is not an exception to this.
Another myth is that the January Barometer is completely useless. Those that believe this like to point out that simply expecting the market to be higher by the end of the year is just as accurate as the January Barometer. Statistically, they are just about right. In the 84-year history examined in this article, there were only 24 full-year declines. So yes, the S&P 500 has posted annual gains 71.4% of the time since 1938. What is missing from this argument is the fact that when January was positive, the full year was positive 88.2% of the time and when January was down the year was down 54.5% of the time. These are not the near perfect outcomes that some statisticians prefer, but once again, the January Barometer was not intended to be used in a vacuum.
January Indicator Trifecta
Combining our three January indicators, the Santa Claus Rally (SCR), First Five Days (FFD) and January Barometer (JB), into the January Trifecta has proven to be an especially reliable gauge for future market performance. When all three are positive, as was the case in 2019, the next eleven months have been up 87.1% of the time with an average gain of 12.3% and the full year advanced 90.3% of the time with an average S&P 500 gain of 17.5%. The worst full-year decline in a year with a positive January Trifecta was 13.1% by S&P 500 in 1966.
With one day remaining in the First Five Days, S&P 500 will need to gain more than 70.13 points (1.49%) to keep the bullish January Indicator Trifecta alive in 2022. Wednesday’s market decline was triggered by a much more hawkish Fed perception following the release of last month’s FOMC Meeting minutes. A more aggressive removal of Fed liquidity could aid in pulling back inflation and it could pressure stocks as bond yields rise. We will withhold final judgement until the final results of the January Barometer arrive. Our base case scenario from our
2022 Annual Forecast is still our pick at this juncture.
|
Santa Claus Rally Results: January Indicator Trifecta 1 for 1
|
|
By:
Jeffrey A. Hirsch & Christopher Mistal
|
January 04, 2022
|
|
|
|
As defined in the Stock Trader’s Almanac, the Santa Claus Rally (SCR) is the propensity for the S&P 500 to rally the last five trading days of December and the first two of January an average of 1.3% since 1950.
The lack of a rally can be a preliminary indicator of tough times to come. This was certainly the case in 2008 and 2000. A 4.0% decline in 2000 foreshadowed the bursting of the tech bubble and a 2.5% loss in 2008 preceded the second worst bear market in history.
After the best first day gain since 2000-2001, S&P 500 held its ground and finished the current seven-day trading span defined by the Santa Claus Rally with a 1.4% gain. Including this year, Santa has paid Wall Street a visit 58 times since 1950. Of the previous 57 occasions, January’s First Five Days (FFD) and the January Barometer (JB) were both up 31 times. When all three indicators were positive, the full year was positive 28 times (90.3% of the time) with an average gain of 17.5% in all years.
A positive SCR is encouraging, and further clarity will be gained when January’s First Five Days Early Warning System (page 16, STA 2022) gives its reading later this week and when the January Barometer (page 18, STA 2022) reports at month’s end. A positive First Five Days and January Barometer would certainly boost prospects for full-year 2022. The December Low Indicator (2022 STA, page 36) should also be watched with the line in the sand at the Dow’s December Closing Low of 34022.04 on 12/1/2021.