With one trading day left in October it looks as though the market has resisted Octoberphobia and averted the feared crashes or massacres that have given the month its bad reputation. More significantly for us though is the continuation of the return to normal seasonal patterns we began to see last month that had been off kilter through much of the pandemic. As you can see in the chart of the typical October pattern over the recent 21-year period stocks have tracked the seasonal pattern rather closely this month, but with above average gains ranging from 4.2% for Russell 2000 to 6.9% for NASDAQ.
![[Typical October Chart]](/UploadedImage/AIN_1121_20211028_Typical_October.jpg)
November leads the strongest seasonal period for stocks, kicking off the best consecutive 3-months, the Best Six Months for DJIA and S&P 500 and the Best Eight Months for NASDAQ. It benefits from “Fourth Quarter Market Magic” as detailed on page 102 of the 2021 Almanac. Trading around Thanksgiving has been lifted by the holiday spirit for many years, but the best short-term trading strategy in recent years has been to come into the week long and exit into strength on the shortened trading day the Friday after.
Since we issued our
Best Months Seasonal MACD Buy Signal on October 8 the market has done quite well with DJIA up 2.8%, S&P 500 up 4.7% and NASDAQ up 6.0% as of today’s close. This is already a good chunk of the typical Best Months with MACD timing historical average gains of 8.9% for DJIA and 13.4% for NASDAQ. We do not expect the blowout performance we had last year during the Best Months with DJIA up 19.1% and NASDAQ up 18.3%.
This is in keeping with our expectation for a reversion to the mean for overall market returns. Back in March on the one-year anniversary of the pandemic low when the S&P was up 75% for the rolling 1-year period we ran the numbers on the 1-year rolling returns for the S&P 500 back to 1949. While these giant spikes do come at the early stages of extended bull runs, gains of this magnitude have not been sustained and the market has tended to revert to the mean. The arithmetic mean or average rolling 1-year return since 1949 is 9.4%, which isn’t bad either.
As you can see in the chart the market is already heading quickly toward that mean. So we expect modest gains over the next several months in keeping with historical seasonal patterns. If we tack on a 1% gain on average each month over the next six-eight months that will be in keeping with the mean reversion to average rolling 1-year returns and overall historical market performance.
We expect the positive support from seasonal forces, solid corporate earnings, improving market internals and technical momentum to outweigh negative inputs from nagging transitory inflation, supply chain bottlenecks, the flattening yield curve and decelerating growth for the time being.
So we are bullish through yearend and into Q1 of 2022 when optics from midterm election campaigning and mudslinging are likely to make the market more susceptible to the headwinds it’s been able to stave off with support from easy money from the Federal Reserve and free money from the Federal Government. For now enjoy the yearend rally and Best Months of the year.
Pulse of the Market
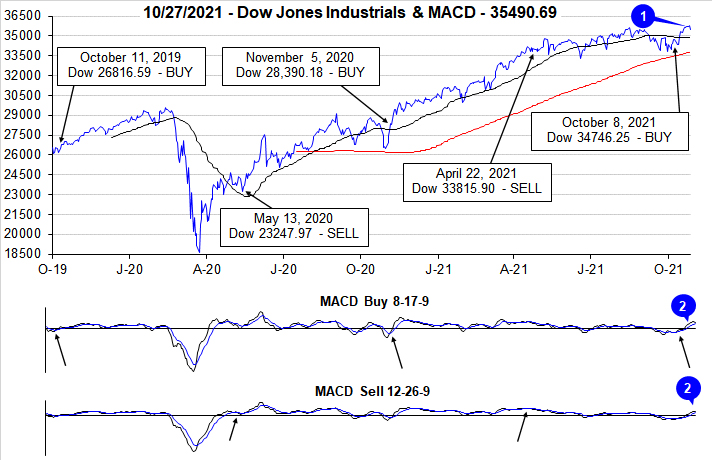
Following a rather typical and volatile September, the market regained its footing in early October and on the close of trading on October 8 the criteria to issue our Seasonal MACD Buy Signal for DJIA, S&P 500 and NASDAQ was satisfied. Since that day through yesterday’s close, DJIA has gained 2.1%, S&P 500 has climbed 3.7% and NASDAQ has jumped 4.5%. These gains have resulted in new all-time closing highs from DJIA (1), S&P 500 and NASDAQ (as of today). The shift in market direction and momentum has been confirmed by both the faster and slower moving MACD indicators (2). Both indicators remain positive and are trending bullishly higher. The “Best Months” have officially begun, and they are off to a solid start.
Once again, we must note the importance of keeping track of how DJIA trades on Friday and the following Monday. Historically Down Friday/Down Monday (DF/DM) occurrences have frequently proved to be important inflection points for the market. Many have foreshadowed further market declines, but others, most notably following a period of weakness and a shift in sentiment have occurred near market bottoms. The most recent and sixth DF/DM of the year (3) that was completed on October 11 thus far appears to the bullish type. DJIA, S&P 500 (4) and NASDAQ (5) have all advanced for three weeks straight with the majority of gains coming in the last two weeks after the DJIA DF/DM.
Bullishly, the markets gains have been supported by positive breadth metrics with NYSE Weekly Advancers outnumbering NYSE Weekly Decliners over the last two weeks (6). Historically, a larger number of Weekly Advancers has confirmed broad participation in the rally and has typically been associated with the greatest gains. The exact opposite occurred in September; Weekly Decliners outnumbered Weekly Advancers, with the exception of one week.
Further confirmation that the rally is underway and gaining momentum can be seen in the expanding number of Weekly New Highs and steadily shrinking Weekly New Lows (7). Current readings would appear to support further gains as New Highs are still below their peak of 951 reached in March of this year while New Lows can still decline further. Should the current trend in New Highs and New Lows continue, additional new all-time closing index highs are increasingly likely.
Despite all the attention headline inflation metrics have received lately, the current surge in inflation still does appear to be transitory in nature. The duration of this transitory period is likely to be longer than first anticipated, but with the weekly 30-year Treasury yield (8) hovering around 2%, the bond market appears to be signaling elevated inflation is not going to persist. For some context, using data provided by https://fred.stlouisfed.org, the weekly 30-year Treasury yield was over 15% in October 1981 when CPI (year-over-year) was at 10.3%. And last year in April the weekly 30-year Treasury yield sank to 1.19% when CPI came in at just 0.3%. It would seem that if inflation was expected to persist at current levels indefinitely, 30-year Treasury bond yields would not be at current levels.
Click for larger graphic…