YALE HIRSCH (1923-2021)
It is with great sadness that we inform you that our beloved founder, Yale Hirsch, creator of the Stock Trader’s Almanac passed away earlier this month after an amazing 98-year run. He was a Wall Street legend and iconic thinker who put market seasonality, cycles, trends and patterns in every investor’s and trader’s arsenal. Yale discovered the “January Barometer,” “Santa Claus Rally,” the “Best Six Months Switching Strategy” (beyond “Sell in May”), as well as many of the other seasonal and cyclical patterns we all rely on. We proudly stand on his ample analytical shoulders. Rest in peace Pop!
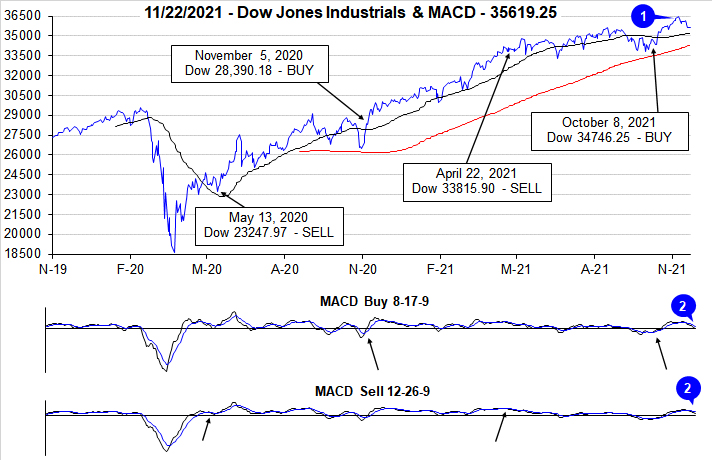
Seasonal patterns continue to reassert themselves and that is positive for new highs by yearend. Typical September and early October weakness created a solid set up for our
October 8 Seasonal MACD Buy Signal. Then late-October seasonal strength carried into early November before the usual pre-Thanksgiving weakness ensued. As we head into the holiday the market seems to be finding its footing and we look for the market to shake off its current funk as it usually does and rally into the Black Friday shopping spirt.
As the S&P 500 is up rather impressively, 24.9% year-to-date this year through today’s close on the Tuesday before Thanksgiving, we ran the numbers on the 33 previous years with double digit year-to-date gains at this juncture since 1950. There are a few blemishes, but in general market gains continued into yearend.
Most importantly, there are no major selloffs on this list. The big December decline of -9.2% in 2018 came after the S&P 500 was down -1.2% at this point in the year. After double-digit YTD gains the S&P 500 was up 70% of the time from the Tuesday before Thanksgiving to yearend for an average gain of 2.3%.
Also of note is that the Santa Claus Rally suffered only four losses in these years. But these four down SCRs in 1955, 1968, 1999 and 2014 were followed by flat years in 1956 and 2015 and down years in 1969 and 2000. As Yale’s famous line states (2021 Almanac page 116 and 2022 Almanac page 118): “If Santa Claus Should Fail To Call, Bears May Come to Broad and Wall.”
December typically starts out weak as tax-loss selling ramps up and with the big gains this year we would expect that early December weakness to materialize. Then as you can see in the typical December chart here stocks begin to takeoff around mid-month led by small caps and the Russell 2000.
This is what used to be known as the “January Effect:” small caps outperforming large caps in the month of January. Nowadays most of the so-called January Effect takes place in the last half of December (2021 Almanac pages 110 & 112, 2022 pages 112 & 114). The January Effect is not to be confused with the January Barometer (2021 Almanac page 16, 2022 page 18), which states as the S&P 500 goes in January, so goes the year.
After mid-December we serve up our “Free Lunch” stock picks from the lists of stocks making new 52-week lows on December Triple-Witching Friday which lands on December 17 this year and present the basket to subscribers over the weekend before the open the following Monday (see 2021 Almanac page 114, 2022 page 116). This strategy is built to capitalize on the January Effect and the Santa Claus Rally.
The Santa Claus Rally was defined by Yale Hirsch in 1972 as the last five trading days of the year and the first two trading days of the New Year. This short, sweet rally is usually good for about 1.3% on the S&P 500, but as we alluded to before the real significance of the SCR is as an indicator.
It is our first seasonal indicator of the year ahead. Years when there was no Santa Claus Rally tended to precede bear markets or times when stocks hit significantly lower prices later in the year. We get an even better indication of the New Year when we combine SCR with the First Five Days Early Warning System (2021 Almanac page 14, 2022 page 16) and the full-month January Barometer reading. We call this the “January Indicator Trifecta.”
When all three are up the S&P 500 has been up 90% of the time, 28 of 31 years, with an average gain of 17.5%. When any of them are down the year’s results are reduced and when all three are down the S&P was down 3 of 8 years with an average loss of -3.6% with bear markets in 1969 (-11.4%), 2000 (-10.1%) and 2008 (-38.5%), flat years in 1956 (2.6%), 1978 (1.1%) and 2005 (3.0%). Down Trifecta’s were followed by gains in 1982 (14.8%) and 2016 (9.5%).
Our outlook remains bullish for the remainder of 2021 and as long as Covid cases don’t explode again and many places go on lockdown or ramp up restrictions majorly, new highs are likely before yearend and we would not be surprised to see the S&P 500 encroach upon the big round number of 5000. 2022 will likely be a different case and we will address that thoroughly in our 2022 Annual Forecast next month.
Pulse of the Market
Momentum from October’s strong rally continued into early November and propelled DJIA to new all-time closing highs just below the upper boundary of our chart at 36,500 (1). At its closing high on November 8, DJIA was a mere 6.55% from our projected Super Boom level of 38,820 first published in the 2010 Almanac. However, globally rising covid-19 cases and persistent inflation have since stalled DJIA’s rise. DJIA’s loss of positive momentum earlier this month is currently confirmed by faster and slower moving MACD indicators that are negative (2). This year’s mid-November weakness is consistent with the full month’s typical seasonal pattern over the past 21 years.
After five straight weeks of gains running from early October through early November, DJIA (3) has declined for two consecutive weeks. S&P 500 (4) and NASDAQ (5) followed a similar pattern except for last week. Once again it appears rising covid-19 cases buoyed technology stocks at the expense of industrials and other reopening sectors. This trend is likely to persist until case numbers show signs of plateauing.
Over the last four weeks, NYSE Weekly Advance/Decline metrics (6) have been largely as one would expect. In positive weeks Weekly Advancers outnumbered Weekly Decliners and vice versa in down weeks. Last week’s mixed performance where DJIA declined while S&P 500 and NASDAQ advanced would be the exception as NYSE Weekly Decliners outnumbered Weekly Advancers by around 2.4 to 1. This would seem to suggest more weakness hidden behind the weekly index gains. How the balance of this week unfolds may likely determine how the rest of November and December unfold. Should typical Thanksgiving strength materialize then a typical yearend rally seems most likely.
Weekly New Highs (7) appear to have peaked along with the major indexes earlier this month. Weekly New Lows have expanded as well. This is typical behavior for the bout of weakness the market is currently enduring. The magnitude of New Highs or New Lows has not reached levels that are consistent with a major market top or bottom. This would suggest current weakness is likely just a pause in the rally provided further deterioration does not unfold.
Even with seemingly steadfast inflation metrics, the 30-year Treasury bond yield (8) continues to linger on either side of 2% in a relatively narrow range. It would seem that the bond market believes inflation will be transitory and growth is also likely to be subpar over the long-term. The key here being long-term, on a three-decade time horizon. Hopefully it is correct when it comes to inflation, but incorrect when it comes to economic growth.
Click for larger graphic…