As we enter the last month of the Best Six Months, the market logged its first down quarter in two years since the beginning of the pandemic. Going back to 1930 when our S&P 500 data begins Q1 was positive 55 years and negative 37 times over the 92-year span. Overall, years that advanced in Q1 were up 46 of the 55 years or 83.6% of the time with an average gain of 13.2% for S&P 500. Years when Q1 was down, were positive only 16 of the 37 years or 43.2% of the time for an average loss of -0.1%.
What jumped out at us were the midterm years that had losing first quarters. In the table we compiled here, the events during these years have an eerie resonance to what’s happening today in 2022. War, conflict, inflation, recession, and rate hikes were common themes in these midterm years. Only three of these 10 midterm years had sizable gains: 1938 (War in Europe), 1942 (WWII) and 1982 (Secular Bull). Losses carried over into Q2 in all but 3 years: 1938, 1942 and 2018. Third quarters rebounded in all but three years: 1966 (Vietnam), 1974 (Oil Embargo/Watergate) and 2002 (Iraq). The only real Q4 blemish was 2018 when the Fed hiked rates too briskly.
![[Down Midterm Q1 Table]](/UploadedImage/AIN_0422_20220331_Down_Q1_Midtern_S&P.jpg)
In general, after a down midterm Q1, losses tended to carry over into Q2 and the market began to find its footing in Q3 and rally into Q4. Protracted crises in 1962, 1966, 1970, 1974, and 2002 delivered the most negative results though all had significant bear market bottoms. At the Q1 crossroads in 2022 we are faced with similar conditions. Persistent hyper inflation (Jeff’s large iced black coffee is up 29% in the last month from $3.02 to $3.89), a rising rate environment that’s stoking inverted yield curve/recession fears, the brutal war in Ukraine and the new
Cold War 2.0 with Russia are threatening a bear market on the backdrop of the
heightened volatility we have been warning of since our
Annual Forecast in December.
War Low Support Holding
Technically we are encouraged by the fact that the intraday low on February 24, the day Russia invaded Ukraine, has held and survived at least one solid test on March 14. We have been using the NASDAQ 100 Index (NDX), which is tracked by the Invesco QQQ Trust (QQQ), as our benchmark of late as it has been leading the market in both directions for several years. As we have illustrated in the chart here the lows on February 24 and March 14 with the late-February/early-March rally in between has created a potential W-123 swing bottom. The 14300 level around point 2 becomes support, which is also right at the 50-day moving average. NDX has bumped into resistance around 15000 and the 200-day moving average.
![[NDX Chart]](/UploadedImage/AIN_0422_20220331_NDX.jpg)
It was also encouraging that the market had rallied back up to and through the 200-day moving average. Reclaiming the 200 DMA again would be most constructive. Market internals are also improving with advancers recently outpacing decliners and new highs beating new lows. Continued improvement technically and internally is needed for the rally to have staying power. Barring any major escalation in Ukraine, we suspect the market to log additional gains in April as the Best Six Months come to a close and then move sideways during much of Q2 and Q3. Likely testing the lows before rallying in Q4 and into 2023.
Recession Not Forgone Conclusion.
Financial pundits, market analysts and economists have been debating when and if the economy will go into recession and what that means for the stock market. We’ve all heard the stats that bear markets lead recessions by 8 months or so. But the dire warnings that the slightly inverted yield curve or the negative yield spread that has recently occurred will definitely lead to recession may be an exaggeration and a fear tactic to get attention. Yes, a solidly inverted yield curve or negative spread is an indication of recession. But this slight inversion can also remedy itself before becoming recessionary. In addition, these inversions of the past everyone is citing came from much higher interest rate levels and none have occurred from anywhere near the historically low rates we have now. It’s a big difference going from 4.75 to 5.50 as we did in 1999 than going from Zero to 1.0.
Many have pointed out that the lead time from these negative spreads or inversions to recessions has been years in many instances. There is also something odd with the negative yield spreads this time around. Unlike any previous period, while the spread between the 10-year and the 2-year is going down toward zero the 10-year/Fed Funds spread is rising.
Perhaps a recession is not such a foregone conclusion or at least it may only happen years down the road. We will suffer another recession, someday. But it is hard to fathom a recession in the near future with the unemployment rate and claims so low and states flush with cash, infrastructure spending and the massive proposed federal budget currently on the table.
Worst Six Months Prep
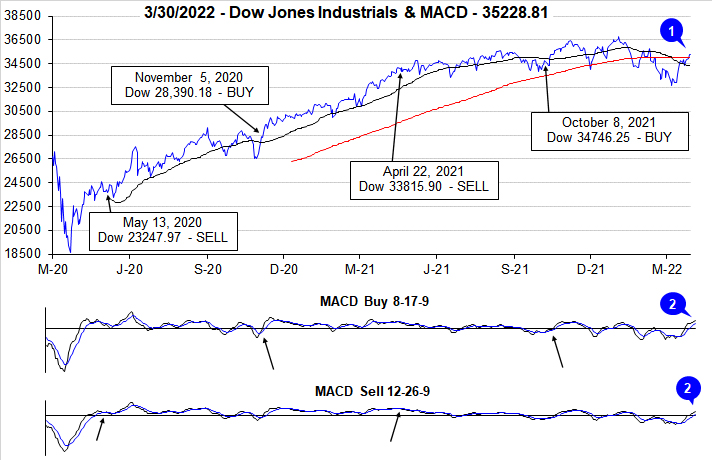
It’s time to be on the lookout for our Best Six Months MACD Seasonal Sell Signal for DJIA and S&P 500. So, here’s a reminder to longtime subscribers and a synopsis for new subscribers. We do not simply “Sell in May and go away.” We employ a more nuanced and subtle approach to how we implement our Best & Worst Months Switching Strategies. We are not issuing the signal at this time.
As we prepare for our upcoming Best Six Months Seasonal MACD Sell Signal that can occur any time on or after April 1 there are several factors and aspects of the strategy, we’d like to be sure you’re up to speed on. DJIA’s and S&P 500’s “Worst Six Months” are May through October. NASDAQ’s “Worst Four Months” are June through October. We begin tracking DJIA and S&P 500 for our “Best Six Months” MACD Seasonal Sell Signal on or after April 1. We begin tracking NASDAQ for its “Best Eight Months” MACD Sell Signal on or after June 1.
We will issue our Seasonal MACD Sell Signal when corresponding MACD Sell indicators applied to DJIA and S&P 500
both crossover and issue a new sell signal on or after April 1. We will not be issuing our NASDAQ Best Eight Months MACD Sell Signal until on or after June 1. Historical dates for the “Sell Signal” can be seen in the tables under the “
Our Strategy” tab on the website.
When we issue our DJIA and S&P 500 Seasonal Sell Signal you will receive an email Alert after the close that day. At that time, we will either sell associated positions outright or implement tight trailing stop losses. Additional bearish and defensive positions as well as other protective strategies may also be considered. All current stock and ETF holdings will be reevaluated at that time. Weak or underperforming positions can be closed out, stop losses can be raised, new buying can be limited, and we will evaluate the timing of adding positions in sectors that perform well in the Worst Six Months and presenting you with a new basket of defensive stocks.
The news flow on the war, the Fed, oil prices and inflation will drive the daily volatility. So, we will be sticking to our playbook guided by our seasonal, fundamental, technical, monetary and market psychology disciplines.
Pulse of the Market
After struggling throughout much of the year DJIA appears to have found support in March just above 32500. At its closing low on March 8, DJIA was down –10.2% year-to-date and down –3.71% for March. From that low through yesterday’s close DJIA was up 3.94% for March and its year-to-date loss has been trimmed to –3.05%. DJIA has reclaimed both its 50- and 200-day moving averages (1). The robust rally is also confirmed by positive readings from both the faster and slower moving MACD indicators (2) applied to DJIA. However, despite the recent brisk rally, DJIA still needs to reverse the death cross that was formed earlier in March when its 50-day moving average fell below its 200-day moving average.
DJIA’s recent rally and back-to-back winning weeks (3) snapped its five consecutive week losing streak. S&P 500 (4) and NASDAQ (5) have also advanced for two straight weeks. More gains by all three are needed to fully undo the damage already done this year. DJIA has fallen in 8 of the 12 weeks so far this year with five Down Friday/Down Monday occurrences throughout. S&P 500 and NASDAQ have just one less weekly loss. A third week of gains would certainly test the stamina of the bears.
NYSE Weekly Advancers and Weekly Decliners (6) have been consistent with the market’s overall move. Decliners have outnumbered Advancers during losing weeks while the opposite occurred in advancing weeks. Two exceptions were the last full week in February and last week when weekly gains were logged even as Weekly Decliners outnumbered Weekly Advancers. Last week’s meager number of Weekly Advancers is concerning as it would appear that participation in the rally has already started to wane.
On a somewhat bullish note, Weekly New Highs (7) have begun to tick higher while Weekly New Lows have declined rather quickly. For the rally to continue New Highs will need to continue to climb and New Lows should also continue to fall. Considering all the uncertainty the market faces, it could be a choppy trend in either direction.
After briefly dipping in late-February and early-March, the 90-day and 30-year Treasury rates have resumed their climbs higher (8). Both are still significantly lower than headline CPI which would seem to suggest that the bond market still does not expect the elevated levels of inflation that have been prevalent for nearly a year to persist indefinitely. Depending on how aggressive the Fed moves on rates, the 90-day rate could climb quicker than the 30-year rate pushing the yield curve ever closer to a full inversion. The Fed certainly has a significant challenge in front of them and their pace of tightening is likely still the biggest threat to the market along with any escalation in Russia’s invasion of Ukraine.