Before we get into our updated outlook and analysis of market conditions, we are happy to announce the launch of our new podcast. Jeff is now hosting the weekly show WealthWise on Biz Talk Today TV. He records Fridays after the close and it gets posted over the weekend. Listen to the podcast on the Evergreen Podcast Network & all major platforms or watch it on YouTube. The inaugural show featured Jeff’s interview with legendary trader Larry Williams and in show 2 he discussed the outlook for bitcoin and crypto with crypto guru, Adrian Aduncyzk, CMT @crypto_birb. This week Barry Ritholtz is on the show to talk about his just-released new book How Not To Invest and other musings. Here are links to the first two shows. Hope you enjoy.
We took some flak last week in the Twittersphere for two seemingly contradictory posts. One featured our typical March performance chart that you are all familiar with from the
March Almanac issue last month. We pointed out that the “Ides of March bounce” had room to run. And it did. A couple days later, as noted on page 30 of the
Stock Trader’s Almanac in the “March Almanac,” we posted that the last three or four days of March and Q1 are prone to weakness.
March is a volatile month for the market, especially at the end of the month, frequently with wild swings in both directions. The mid-month bounce did continue, but now stocks have struggled the past two days as the month nears the close. This week after March quarterly Quadruple Witching has been weak with the Dow down 22 of Last 37, and the end of Q1 has been prone to volatility and weakness as well since 1990 with the S&P 500 down 21 of 35 years the last 3 or 4 days of March.
End-of-quarter portfolio restructuring likely plays a role as managers lock in any gains and look to establish positions for the next quarter. This has all been exacerbated by the continued shake-up in DC, which is typical of the post-election Q1 weak spot. The new Trump 2.0 administration’s challenging tariff negotiation tactics along with the unprecedented actions to cut waste in the federal government have created a high degree of uncertainty on Wall Street. This has the first quarter of 2025 on the verge of being negative with S&P down -3.2% at today’s close.
Post-Election Year Woes Persist
There’s no way to sugarcoat it, unless the market can get back into the green for the year in April, our more bullish base case scenario for 8-12% gains for 2025 becomes harder to achieve. Currently, the S&P 500 is tracking the weaker post-election patterns of republican administrations and after incumbent party losses. This action has increased the odds of our annual forecast worst case scenario.
2025 is tracking the old school weak republican president post-election year performance noted on page 28, Stock Trader’s Almanac 2025. The market is concerned the new republican administration and Congress may be implementing too many drastic measures, which tends to lead to flat to negative full-year performance. Unless the market can rebound substantially next month, we are likely in store for some tough sledding through the third quarter.
When Q1 Is Down It Can Lead to More Trouble
Adding to our concerns that the market in 2025 continues to track some of the less bullish post-election year scenarios is the history of market performance following down first quarters, especially in post-election years. From the table below of all down Q1s for the S&P 500 since 1950 several things are apparent. First the good news. April has been up on average and about 63% of the time. Q4 has been even stronger. Though both April and Q4 have taken some hits as well.
But unfortunately, Q2 and Q3 have been weak overall and Q3 especially in post-election year. Q1 and Q3 post-election-year weakness is something we discussed in our annual forecast back in December and have continued to warn you of. What we find most compelling from this data is that if the market had already achieved bear market levels when Q1 was down it was usually near a bottom or low point from which the market rallied substantially. Conversely, if Q1 is negative and the market has not reached bear market status or is not far from a recent all-time high, then we have more often than not experienced further market trouble and downside action over the subsequent nine months.
Election year 1968 seems to be the outlier as the bull market ran from October 1966 to November 1968. The infamous Tet Offensive from January to April 1968 helped knock the market down in 1968 Q1 as Johnson dropped out of the presidential race on March 31. The end of the Tet Offensive and the beginning of Paris Peace Accords in May 1968 helped keep the bull market going until November 1968 despite a host of other negative events, including the assassination of Martin Luther King, Jr. and Robert F. Kennedy who was leading a tight three-way race for the democratic candidacy.
Several of the weak republican post-election years we have discussed from page 28 of the 2025 Almanac also standout: 1953, 1957, 1969, 1973, 1981 as well as 1977, Jimmy Carter’s difficult first year. There are several other non-post-election years of concern, most recently 2022. The most impressive turnarounds from down Q1s occurred at or near the ends of bear markets in 1980, 1982, 2003, 2009 and 2020 after Covid-19 induced the shortest bear market on record.
End Best Six Months – Prepare for the Worst
While we expect a bounce in April the words of late, great analyst Edson Gould (Findings & Forecasts, 1902-1987) loom large: “If the market does not rally, as it should during bullish seasonal periods, it is a sign that other forces are stronger and that when the seasonal period ends those forces will really have their say.”
With the Best Six Months currently in the red, it suggests to us the there are other more powerful forces other than seasonality impacting the market presently. While the changes in DC may lead to a healthier debt level, a leaner, more efficient government and greater prosperity in the near future, it is all rather murky at the moment. CEOs, money managers and analysts have been scrambling to figure out how to reposition their firms, portfolios and recommendations.
If this level of uncertainty persists the market will be hard pressed to make any significant headway. Technically, the market has some work to do to find support for any sustainable tradable rally to take hold. We have highlighted in yellow this area of resistance between the old July highs and the orange circle election gap breakout roughly between 5670 and 5775. S&P closed today at 5693.31. The 200-day MA (curvy blue line) is also proving formidable at 5756.
We have added a new trend line from the April 2024 low to the August 2024 low that extends up toward the recent March 2025 low around 5500 circled in red. If the market tests and holds the March lows and then rallies though the 5775 resistance we would have ourselves the makings of potential “W-1-2-3” Swing Bottom. This would be quite constructive and increase the odds of the market, shaking off this malaise and put our Base Case Scenario of 8-12% gains for 2025 back in play. Until then we remain cautious.
Pulse of the Market
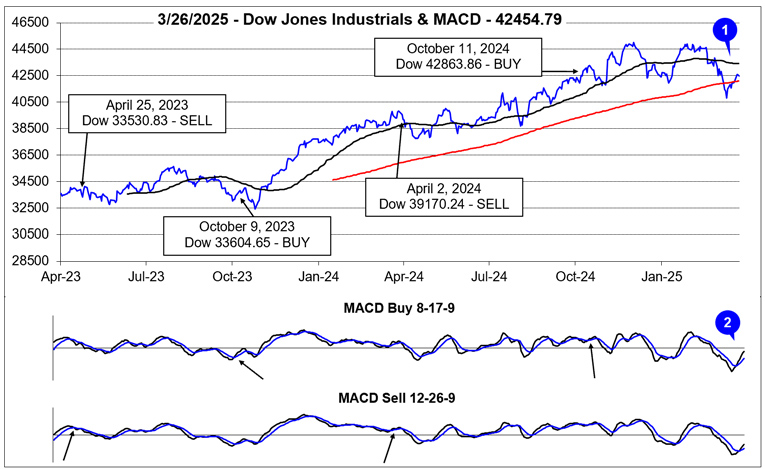
March already had a history of being somewhat challenging in post-election years. This March is on track to further amplify that poor record. With two trading days remaining in March, DJIA is down 3.5% as of its March 27 close. DJIA’s rebound from its March closing low has lifted it back above its key 200-day moving average (1) and trimmed its decline nearly in half, but the bounce has come under pressure in recent trading sessions. DJIA’s bounce has turned its slower and faster moving MACD indicators positive (2) but they are beginning to confirm the recent loss of momentum.
Since registering its first Down Friday/Down Monday (DF/DM) of 2025, DJIA has declined in four of seven weeks. Three of the weekly declines exceeded 1000 DJIA points (3). As gloomy as this seems, DJIA’s recent record is actually better than S&P 500 (4) and NASDAQ (5) as both declined in five of the last seven weeks. S&P 500 and NASDAQ did both fall into a correction, down 10% or more from their respective highs. NASDAQ remains in a correction, down 11.7% as of today’s close (March 27).
Weekly market breadth has remained reasonably consistent with the major indexes’ ups and downs over the last four weeks. With the exception of week ending February 28, Weekly Decliners have outnumbered Weekly Advancers during down weeks (6) and vice-a-versa. Even though there have been sizable weekly declines, the biggest weekly declines have only had Decliners outnumber Advancers by a little more than 2 to 1. Historically, longer rallies have been observed after Weekly Decliners exceed Advancers by 3 to 1 or more. This most recently occurred during the week ending January 10. The ratio was also reached near the end of the market’s August to October 2023 correction.
Weekly New 52-week Highs and Lows (7) have been rather choppy and uninspiring. The rather limited number of New Lows, still below their December peak of 377, suggests that selling has been selective thus far. Based upon this selective selling, perhaps the current market pullback may turn out to just be a garden variety correction. There have been some streaks of rotation towards defensive sectors, but that also appears to be lacking full commitment from traders and investors.
Short-term interest rates have hovered around 4.20% since the Fed’s last interest rate cut in December. Recent inflation metrics have improved somewhat yet remained elevated while economic activity does appear to be softening. This has likely allowed the 30-year Treasury bond yield (8) to ease and stabilize. Tomorrow’s Personal Consumption Expenditures (PCE) will be the next major release that could move Treasury bond yields.