As we put the finishing touches on the manuscript for the 2026 Stock Trader’s Almanac, our 59th annual edition, this week and formulate our advanced outlook for 2026, we have been assessing how our 2025 forecast has fared. We underestimated the voracity with which the Trump 2.0 administration would prosecute its trade policy and tariff negotiations. But we did nail the heightened volatility and first quarter weakness that ran over into early April.
Back in December we gave our Base Case
Annual Forecast scenario a 65% probability for gains of 8-12% for 2025. Inflation risks tempered our bullish outlook, but we expected Trump 2.0 policy initiatives to stir the animal spirits and boost business, the economy and markets in line with the more recent bullish history of post-election years. The year sure started out that way climbing to new highs, but the President’s “art-of-the-deal” shock and awe style was a bit too shocking causing a spike in volatility and a steep correction.
Market volatility has been bullishly crushed since the April 8 low and in the process the rally has triggered a host of other bullish technical readings we detailed in the
Mid-Month Update two weeks ago. As you can see from the S&P 500 chart below several resistance levels have been cleared over the past four weeks: 5500 and 5670, the 50-day moving average (pink line), and the 200-day moving average (blue line).
Still 50/50
Despite the face-ripping rally S&P 500 is still flat on the year, up a mere 0.53% at today’s close. It is also tracking the two least bullish scenarios in the Post-Election Year Seasonal Pattern Chart below. The green line illustrates how closely 2025 is tracking this dubious pattern of old school Republican Administration Since 1950. The red line shows how in the year after Incumbent Party Losses markets tend to mark time as they adjust to the new sheriff in town and the new agenda.
On page 28 of the 2025 Almanac, we discuss the tendency of Republican Presidents to get down to brass tacks right out of the blocks whereas the Dems tend to hem and haw and not get around to big policy changes until the midterm year. President Trump has implemented more policy initiatives faster than any president we can remember. If this pace of shock-and-awe-and-pause-and-negotiate continues, the market is likely to chop around and go sideways until we get some real deals and the economy and/or market leaders knock some results out of the park.
It is this year’s rollercoaster and flat year-to-date performance that has shifted our outlook to 50/50 Base Case/Worst Case. If we can solidify some trade deals and log some good economic and corporate hard data points and continue to build on the constructive market action, then the odds of significant new highs increases. If the Trump Administration’s agenda flounders and data disappoints our flat to negative scenario for the year becomes more likely.
Big May Gains Are Good
With one trading day left, May is delivering some very merry gains once again. The table below shows all the years since 1950 when May logged a gain of 3% or more on the S&P 500. This is the second year in a row this has occurred and last year finished quite strong. All post-election years like 2025 are highlighted in orange. The next seven months of these years have done quite well, up 13, down 5 with an average gain of 8.7%, which would be right on target for our Base Case Annual Forecast scenario. June is the weak link in this dataset, up only 11 of the 18 years with a paltry average gain of 0.5% which aligns well with June’s historical lackluster performance. Q4 stands out here with some solid numbers and only two losses at the outset of the GFC in 2007 and during the 1957 bear market and recession.
NASDAQ Best 8 Months MACD Sell Criteria
Our NASDAQ Best 8 Months MACD Sell has NOT triggered. The market’s sideways trading the past two weeks has put NASDAQ’s Best 8 Months MACD Sell indicator close to the triggering criteria. If the NASDAQ Composite does not gain more than 95.72 points tomorrow, our NASDAQ MACD Sell indicator will get reset.
We calculate MACD using daily closing prices with a short exponential moving average (EMA) of 12 days, a long EMA of 26 days and a 9-day period EMA for the signal line, frequently written as 12-26-9. A sell signal is triggered when the signal crosses below the MACD line on or after the first trading day of June. We require a NEW Sell Signal after the first trading day of June. If the 9-day signal line comes into the month below the MACD line, then it must rise above and cross below it again after the first trading day of June.
The market has become somewhat desensitized to President Trump’s tariffs and trade war and continues to shrug off other corporate, economic and geopolitical setbacks rather summarily. We find it hard to get bearish here yet hard to get super bullish. With the Worst Six Months upon us, the ominous post-election pattern behavior we are witnessing and flat YTD performance, plus the technical resistance at Election gap we see no reason to overextend ourselves. Besides, the Fed is not doing anything until there is a fire to put out or it gets more clarity on fiscal policy, trade, the tax bill and immigration.
Pulse of the Market
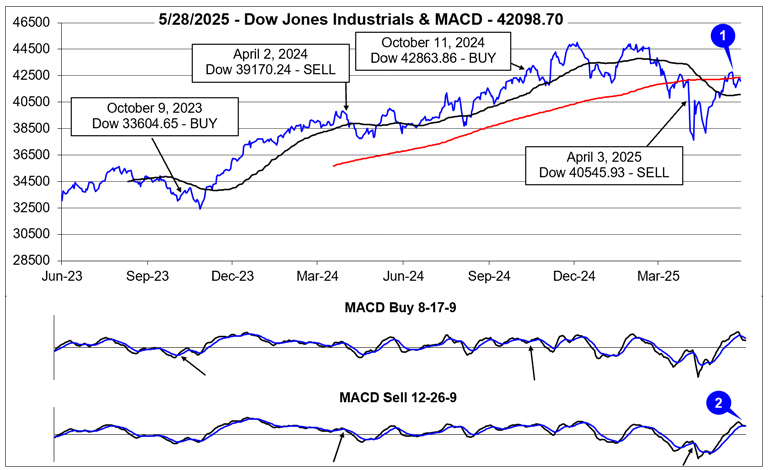
April’s rebound rally continued in May and DJIA reclaimed its 50-day moving average and briefly its 200-day moving average (1) around mid-month. As of the close on May 28, DJIA was up 3.5% in May which is well above its average post-election year May average performance of 1.3% since 1950. However, DJIA is still down year-to-date 1.0%. Since mid-month, DJIA has modestly retreated and the shift in momentum has turned both the faster and slower moving MACD indicators negative (2). Historically, June has been a tepid month in post-election years and DJIA appears to be heading in that direction.
Despite the impressive gains since the April lows, weekly performance confirms the volatile and choppy nature of the recovery rally. Over the last seven full weeks, DJIA has advanced four times and declined three times (3). Three of the weekly gains were in excess of 1000 DJIA points while two of the weekly losses were also in excess of 1000 points. S&P 500 (4) and NASDAQ (5) have the same number of weekly gains and losses but with even larger gains and weekly swings. Sizable weekly and daily swings are likely to persist as uncertainty over the economic impact of tariffs remains elevated.
Weekly market breadth over the last five weeks has largely been in line with the magnitude of weekly moves. Weekly Advancers have outnumbered Weekly Decliners (6) in four of the past five weeks, most notably during the week ending May 9, when the major indexes all recorded mild weekly declines. However, the streak of four straight weeks of Advancers outnumbering Decliners abruptly ended last week. This sharp reversal also suggests more volatility is likely heading into June and possibly beyond.
Looking at the number of New 52-week Highs over the last five weeks (7), there was an encouraging pattern. New Highs were slowly expanding until declining last week. New 52-week Lows have declined substantially after spiking to nearly 1500 in the first half of April but have been unable to maintain a clear path much lower. New Highs and Lows are likely to continue to bounce around in the near-term as the market remains headline driven.
Apparently fueled by Federal debt concerns, the 30-year Treasury bond (8) yield climbed above 5% during the week ending May 23. On a weekly basis, the last time the 30-year Treasury bond exceeded 5% was in October 2023, for two consecutive weeks. Prior to then, the last time it was above 5% was way back in the spring and summer of 2006. A sustained move above 5% would likely weigh on stocks.