2/21/2018: Dow 24797.78 | S&P 2701.33 | NASDAQ 7218.23 | Russell 2K 1531.84 | NYSE 12695.53 | Value Line Arith 6040.95
Psychological: Stunned. Bullish sentiment was running at multi-decade highs in late January according to Investor’s Intelligence Advisors Sentiment survey. This is no longer the case. Bulls have retreated to less than 50% and correction advisors have increased to nearly 37%. Bears are still scarce at just under 15%. In late January, the “wall of worry” that the market climbs was essentially nonexistent. This appears to no longer be applicable. The easing of extremely bullish sentiment does give the market some room to recover.
Fundamental: Firm. Unemployment is low, corporate earnings are growing and GDP is currently forecast to be running right around 3%. These are all fair data points, but clear signs of economic overheating are still absent. The recent uptick in some inflation metrics and bond yields was once considered a positive. It was confirmation that the economy was on firm(er) footing, not a warning that a recession was imminent.
Technical: Mixed. Markets went from overbought to oversold in seemingly record time. Bullishly support was found above DJIA, S&P 500, NASDAQ and Russell 2000 200-day moving averages. The current rebound is struggling with resistance around the 50-day moving averages. Stochastic and relative strength indicators have all improved and there is still some room left. NASDAQ’s chart looks the best having cleared its 50-day moving average. Similar moves by DJIA, S&P 500 and NASDAQ would be welcome confirmation that the bull market is still alive and well.
Monetary: 1.25-1.50%. It would seem the greatest fear is the possibility that the Fed may be chasing after inflation and may need to raise rates quicker than previously expected. Inflation was well below the Fed’s stated 2% target for a rather lengthy amount of time and could easily overshoot on the high side. Should inflation overshoot, the Fed may still take its time raising rates considering all the effort (trillions of $ in QE) that went into stimulating it.
Seasonal: Bullish. Normally a solid performing month, March typically enjoys even better results in midterm years. The month’s overall ranking improves due to increase in average gains. DJIA and S&P 500 rank #4 while NASDAQ, Russell 1000 and Russell 2000 rank third best overall.
The return of volatility over the past four weeks has been quite a reality check for the market and its participants. However, it has not shaken our resolve and our bullish outlook for 2018. Economic data and forecast remain robust, but improving economic conditions are a double-edged sword for the market.
Historically stocks tend to struggle in rising rate environments, but these levels are still well below historical averages for the 10-Year Treasury yield and below the lower end for the benchmark yield of around 4% prior to 2008. The uptick in growth, inflation, wages and corporate profits stoked fears of an accelerated run up in interest rates, which spooked traders and investors and heralded in a
return of volatility that began at the end of January.
This influx of real volatility – larger daily and intraday market index price swings – caused a run on the latest Wall Street invention: low volatility derivatives, especially inverse VIX Exchange-Traded Products (ETPs). The long-awaited 10.2% correction that appears to have found support at the February 8 close – at least for now – has brought valuations, stock prices and the overbought conditions back in line to less overextended levels.
It’s been 2 full years since the last 10% correction, so make no mistake; this was a warning shot that market volatility has returned and the days of super easy gains being long and strong stocks and the broad market and short the VIX are likely over. This makes the historical time-tested seasonal trading trends and pattern for frequency and magnitude detailed in the Stock Trader’s Almanac for 51 years, continually updated and verified in this newsletter, even more imperative to include in your trading and investing arsenal.
The fact that this correction happened in classic fashion in February, the weak link in the Best Six Months, where big January gains often correct or consolidate, lends support to the efficacy of and return of market seasonality. This looks like a textbook setup for midterm Worst Six Months market soft patch and perhaps further correction during the May-October period.
March remains strong in midterm years, but April, May and June are weaker in midterm years, so we suspect the rally to resume higher toward the January highs in March. Volatility is likely to continue, but we don’t expect another meaningful pullback until the end of the Best Six Months. Midterm election campaign machinations and political rhetoric are likely to heat up already heightened tensions in Washington, fanning any market jitters from the new Fed, higher rates and market gyrations.
Bullish sentiment has come down considerably and technically the market is going through a constructive consolidation. The market is attempting to reclaim the middle of the uptrend channel that has been in place since mid-November 2016 just after the post-election rally consolidated. After blowing through the upper-end in mid-January, the market pendulum swung quickly through the lower-end during the nine-trading-day 10.2% S&P 500 correction. Then it bounced firmly off the red 200-day moving average intraday the next day. Last week’s rebound delivered a positive crossover in our MACD indicator.
![[CHART: AIN_0318_20180222_SPXuptrendChannel.jpg]](/UploadedImage/AIN_0318_20180222_SPXuptrendChannel.jpg)
As the market hit its low on February 8 we noticed an encouraging technical reading. The market may have formed a “W” 1-2-3 swing bottom with the February 6 intraday low. Clearing the middle of the “W” high at point 2 (the February 7 intraday high) and closing above it (which it did on February 15 and 16) would be encouraging. In addition, the VIX was significantly lower at the February 8 low than it was at the February 6 low.
This week’s trading action brings us back below that crucial intraday high level reached on Wednesday, February 7. This is also right at the green dotted monthly pivot point support level and the pink 50-day moving average. Keep a close eye on these important technical levels. And also be on the lookout for typical end-of-February weakness.
Watch Out for End of February Weakness
Over the most recent 22-year time span the end of February has been prone to weakness. The bulk of the weakness appears to land on the last trading day of the month or the penultimate trading day, but it can begin as early as the fourth to last trading day. This weakness has been evident in Februarys with a gain or a loss. Perhaps it is the winding down of earnings season that triggers weakness in some years. This weakness can be seen graphically on page 20 of the
Stock Trader’s Almanac 2018 or in our post last month “
February’s performance generally improves in midterm years,” and in the table below.
Finally, while midterm March is historically strong, like Julius Caeser: beware The Ides of March as well as the week after March Triple Witching and the end Q1. The market tends to come into March strong, but then after mid-month is prone to weakness and big end-of-Q1 hits.
Pulse of the Market
DJIA peaked on January 26 (1) when it closed it 26616.71. Although it never went any higher, January 2018 still closed with a 5.8% DJIA gain and the best single-month point gain on record. This was just the fifth month to ever gain 1000 or more points. However, any cheers quickly faded and fear took over in early February as DJIA and the rest of the market rapidly sank into a correction. DJIA did take out its December Closing low on February 8, but quickly rebounded the following day.
The nosedive from record highs turned both the faster and slower moving MACD indicators applied to DJIA negative. As a result of recent strength the faster moving, MACD “Buy” indicator (2) turned positive on Friday, February 16. DJIA’s slower moving indicator is currently trending in a positive direction, but has yet to issue a bullish crossover confirmation. Today’s gains moved it closer, but more is still needed.
After advancing in nine of ten weeks, DJIA’s streak of success ended with a thud and the first Down Friday/Down Monday (DF/DM) of 2018. Monday February 5th’s DJIA decline (3) was the worst daily point loss ever, but it was only a 4.6% drop. DJIA’s worst ever single day was October 19, 1987 when it plunged 22.6%. Like most other DF/DM’s in recent history, this occurrence did precede further declines as DJIA went on to decline another 1000-plus points on Thursday of the same week. S&P 500 (4) and NASDAQ (5) also suffered similar magnitude declines in the week as DJIA.
NYSE Weekly Advancers and Decliners data also plummeted (6). Weekly Advancers were outnumbered by Weekly Decliners by nearly ten to one. The last time this level was neared was in July 2011 while it was last exceeded in May of 2010.
New Highs evaporated and New Lows exploded (7) during the two week correction as expected. Last week’s solid gains ended that trend, but a full recovery is not likely until the major indexes return to and exceed their respective previous all-time highs.
A tight labor market, fears that the Fed may be moving too slowly to tighten monetary policy and swelling Federal deficits have finally started to put pressure on Treasury bond yields. The most notable increase occurred with 10-year yields while 30-year yields have only risen modestly. At 3.14% last week (8), 30-year yields are just below their peak in December 2016 of 3.16%.
Click image to view full size…
Tempestuous March markets tend to drive prices up early in the month and batter stocks at month end. Julius Caesar failed to heed the famous warning to “beware the Ides of March” but investors have been served well when they have. Stock prices have a propensity to decline, sometimes rather precipitously, during the latter days of the month.
March packs a rather busy docket. It is the end of the first quarter, which brings with it Triple Witching and an abundance of portfolio maneuvers from The Street. March Triple-Witching Weeks have been quite bullish in recent years. But the week after is the exact opposite, DJIA down 20 of the last 30 years—and frequently down sharply for an average drop of 0.54%. Notable gains during the week after for DJIA of 4.9% in 2000, 3.1% in 2007, 6.8% in 2009, and 3.1% in 2011 are the rare exceptions to this historically poor performing timeframe.
Normally a solid performing market month, March improves modestly in midterm-election years (see Vital Statistics table below). In midterm years March ranks: 4th best for DJIA and S&P 500 and 3rd best for NASDAQ, Russell 1000 and Russell 2000. DJIA, S&P 500 and Russell 1000 have been up for five straight midterm Marchs.
Saint Patrick’s Day is March’s sole recurring cultural event. Gains the day before Saint Patrick’s Day have proved to be greater than the day itself and the day after. Perhaps it’s the anticipation of the patron saint’s holiday that boosts the market and the distraction from the parade down Fifth Avenue that causes equity markets to languish. Or maybe it’s the fact that Saint Pat’s usually falls in Triple-Witching Week. With the holiday falling on a Saturday this year (but also the day after Triple-Witching), the day before could be weaker than usual as some traders may look to stretch the holiday into a three-day weekend.
Whatever the case, since 1950, the S&P 500 posts an average gain of 0.21% on Saint Patrick’s Day (or the next trading day when it falls on a weekend), a gain of 0.13% the day after, but the day before averages a 0.24% advance.
Good Friday and Easter have landed in the month 16 times in the last 68 years like they do this year. On the day before Good Friday S&P 500 has logged gains averaging 0.16% in the previous sixteen March Easters. Because the holidays are near month-end, the trading day after Easter has been weak.
| March (1950-2017) |
| |
DJI |
SP500 |
NASDAQ |
Russell
1K |
Russell 2K |
| Rank |
|
5 |
|
4 |
|
6 |
|
4 |
|
4 |
| #
Up |
|
44 |
|
44 |
|
30 |
|
26 |
|
28 |
| #
Down |
|
24 |
|
24 |
|
17 |
|
13 |
|
11 |
| Average
% |
|
1.1 |
|
1.2 |
|
0.9 |
|
1.2 |
|
1.4 |
| 4-Year Presidential Election Cycle Performance
by % |
| Post-Election |
|
0.3 |
|
0.6 |
|
-0.2 |
|
0.7 |
|
1.1 |
| Mid-Term |
|
1.3 |
|
1.3 |
|
1.7 |
|
2.0 |
|
2.8 |
| Pre-Election |
|
2.0 |
|
1.9 |
|
3.1 |
|
2.0 |
|
3.1 |
| Election |
|
1.0 |
|
1.2 |
|
-0.9 |
|
0.1 |
|
-1.1 |
| Best & Worst March by % |
| Best |
2000 |
7.8 |
2000 |
9.7 |
2009 |
10.9 |
2000 |
8.9 |
1979 |
9.7 |
| Worst |
1980 |
-9.0 |
1980 |
-10.2 |
1980 |
-17.1 |
1980 |
-11.5 |
1980 |
-18.5 |
| March Weeks by % |
| Best |
3/13/09 |
9.0 |
3/13/09 |
10.7 |
3/13/09 |
10.6 |
3/13/09 |
10.7 |
3/13/09 |
12.0 |
| Worst |
3/16/01 |
-7.7 |
3/6/09 |
-7.0 |
3/16/01 |
-7.9 |
3/6/09 |
-7.1 |
3/6/09 |
-9.8 |
| March Days by % |
| Best |
3/23/09 |
6.8 |
3/23/09 |
7.1 |
3/10/09 |
7.1 |
3/23/09 |
7.0 |
3/23/09 |
8.4 |
| Worst |
3/2/09 |
-4.2 |
3/2/09 |
-4.7 |
3/12/01 |
-6.3 |
3/2/09 |
-4.8 |
3/27/80 |
-6.6 |
| First Trading Day of Expiration Week: 1990-2017 |
| #Up-#Down |
|
20-8 |
|
20-8 |
|
15-13 |
|
18-10 |
|
16-12 |
| Streak |
|
D1 |
|
U1 |
|
U5 |
|
U1 |
|
U1 |
| Avg
% |
|
0.2 |
|
0.1 |
|
-0.2 |
|
0.07 |
|
-0.2 |
| Options Expiration Day: 1990-2017 |
| #Up-#Down |
|
14-14 |
|
17-11 |
|
12-16 |
|
15-13 |
|
11-16 |
| Streak |
|
D1 |
|
D1 |
|
U3 |
|
D1 |
|
U3 |
| Avg
% |
|
0.2 |
|
0.1 |
|
-0.1 |
|
0.07 |
|
-0.07 |
| Options Expiration Week: 1990-2017 |
| #Up-#Down |
|
21-7 |
|
21-7 |
|
18-10 |
|
20-8 |
|
16-12 |
| Streak |
|
U6 |
|
U6 |
|
U6 |
|
U6 |
|
U6 |
| Avg
% |
|
1.1 |
|
0.9 |
|
0.05 |
|
0.8 |
|
0.3 |
| Week After Options Expiration: 1990-2017 |
| #Up-#Down |
|
10-18 |
|
7-21 |
|
13-15 |
|
7-21 |
|
13-15 |
| Streak |
|
D3 |
|
D6 |
|
D5 |
|
D6 |
|
D6 |
| Avg
% |
|
-0.3 |
|
-0.2 |
|
0.1 |
|
-0.2 |
|
0.03 |
| March 2018 Bullish Days: Data 1997-2017 |
| |
1,
7, 15, 19 |
1,
5, 7, 13 |
1,
5, 13, 19 |
1,
5, 7, 13 |
1, 13, 23, 29 |
| |
|
15,
19 |
20,
23 |
15,
19 |
|
| March 2018 Bearish Days: Data 1997-2017 |
| |
21,
22, 26, 29 |
2,
14, 21, 26 |
2,
7, 26 |
2,21,
26 |
12, 26 |
| |
|
|
|
|
|
Click here to download printer friendly pdf file of March Strategy Calendar...

|
Stock & ETF Portfolio Updates: Bouncing Back
|
|
By:
Christopher Mistal
|
February 15, 2018
|
|
|
|
Over the past four weeks the ETF portfolio has been on a roller coaster ride. Immediately after last update, the majority of positions were higher, but that all changed in early February. S&P 500’s first 10% correction since the start of 2016 transpired in the matter of a few quick trading sessions. Some sectors fared better than the major indexes while others were worse.
As a result of broad weakness, iShares DJ Transports (IYT), iShares PHLX Semiconductor (SOXX), Vanguard REIT (VNQ) and SPDR Energy (XLE) were all stopped out. Each position was closed out in the following trading session using that day’s average price.
Mid-January’s new ETF Trade ideas in the natural gas sector, First Trust Natural Gas (FCG) and United States Natural Gas (UNG), were both added to the portfolio and then stopped out. The combination of warmer weather and broad weakness triggered the quick declines.
DB Gold Double Short (DZZ) was added to the portfolio yesterday when it traded below its buy limit. DZZ is on Hold. ProShares UltraShort Silver (ZSL) has not yet traded below its buy limit and can still be considered on dips. It is worth noting that gold and silver did not really respond to broad market declines that were at least partially fueled by rising inflation expectations. If market volatility continues to decline, then gold and silver could easy succumb to weak underlying demand.
Core “Best Months” positions in SPDR DJIA (DIA), iShares Russell 2000 (IWM), PowerShares QQQ (QQQ) and SPDR S&P 500 (SPY) have all given back a portion of their respective gains, but only IWM is currently in the red (using February 14, 2018 closing price). All four positions remain on Hold. During times of turmoil and volatility it is best to stick to the time-tested strategy and avoid making rash, emotional decisions that more often than not turn out to be wrong.
All other positions not previously mentioned are on Hold.
Disclosure Note: At press time, officers of the Hirsch Organization, or accounts they control held positions in IWM, QQQ, XLP and XLV.
Stock Portfolio Updates
Over the four-plus weeks since last update, S&P 500 is only down 1.8% while Russell 2000 is off 2.4% as of yesterday’s close. The Almanac Investor Stock Portfolio’s blend of cash and long positions slipped 3.5% over the same time period excluding dividends and any trading costs. Our Mid-Cap portfolio was the worst performer and responsible for the majority of the overall decline.
Once a top performer, Scotts Miracle-Gro (SMG) delivered a disappointing earnings report just as the market began to weaken. Their business is seasonal and winter generally is not a great period for them, but no punches were pulled and shares were slammed on January 30. SMG then closed below its stop loss on February 5 and was closed out of the portfolio the next day.
II-VI (IIVI) was another mid-cap position that suffered a sizable decline, dropping from over $50 per share in mid-January to under $40 now. What was a solid performing position turned into a minor loss when it was closed out of February 6.
Per last month’s update, positions in KBH, LGIH, MTH, ORBK and PATK were established on January 12 using the day’s average trading price for entry. This ultimately proved to not be the timeliest of purchases. LGIH was stopped out on February 8 and closed out of the portfolio the next day while KBH, MTH and PATK are currently all negative.
On a positive note, remaining Free Lunch stocks, shaded in grey have nearly all been closed out. A tight 8% trailing stop loss was in use and this ensured that nearly all of the positions were closed out for a gain. Only CECE was negative. Network-1 Technologies (NTIP) is the sole remaining Free Lunch stock and it should also be closed out. Sell NTIP. For tracking purposes it will be closed out using its average daily price on February 16.
Bank stocks and the oldest holdings in Large-Cap Portfolio are other bright spots. ABCB, WAL, UNH, SCCO, ANET and CBG are all higher today than in mid-January. ANET is by far the top performer, up approximately $50 since then.
All other positions in the Stock Portfolio are on hold. Please see following table for current advice, buy limits and stop losses.
Disclosure Note: At press time, officers of the Hirsch Organization, or accounts they control held positions in, ANET, BUSE, FAF, G, HII, LGIH, LII, MHO, OC, ORBK, SMG, SNX and TOL. They did not hold any positions in the other stocks mentioned in this Alert, but may buy or sell at any time.
|
Volatility Returns. Market Reverts to Low End of Uptrend. Stick to the Strategy.
|
|
By:
Jeffrey A. Hirsch
|
February 08, 2018
|
|
|
|
The blame for this selloff has been placed on a plethora of circumstances. Last Friday’s employment report finally showed wages on the rise, which is good news for the economy, but it stoked inflation fears. Interest rates in turn moved a bit higher, also a positive sign of the U.S. economy’s improving condition, but this also spooked investors and traders that the Fed would speed up the rate tightening cycle, conveniently forgetting how historically low rates remain.
Unrestrained crypto currency trading and a tidal wave of Initial Coin Offerings (ICOs) has been compared to the 1999-2000 dotcom bubble IPO craze. A massive short cover in low volatility derivatives, especially inverse VIX Exchange-Traded Products (ETPs), driven by algorithmic trading programs has also been held responsible. Back in our
November Outlook we warned, “
This market is so robust at the moment that it will likely take some systemic market event. Perhaps it will be triggered by a run in the mushrooming ETF arena….”
Market’s also notoriously like to test new Fed chairs and Jerome Powell was confirmed by the Senate on January 23 and sworn in and took office on Monday February 5 just as this selloff ensued. The continuing political battle of the federal budget and debt ceiling and the threat of another shutdown has also given the market jitters. The list goes on.
The past five days of large intraday market swings and declines has now delivered the long awaited first 10% correction at today’s close since the February 11, 2016 mini-bear-market bottom, nearly 2 years ago to the day.
But the bottom line is rather quite simple. This market got way ahead of itself in typical euphoric frenzy. This confluence of triggers and market rattling events appears to have swung the market pendulum firmly in the other direction in the near-term reverting equity prices to the low end of the uptrend. As you can see in the chart below, since just after the election in 2016 and the initial pop the S&P 500 has been trending higher in a sane uptrend channel.
![[UPTREND CHART]](/UploadedImage/AIN_0318_20180208_SP500-VIX_Trend.jpg)
Then in January it spiked far above the upper end of that channel as investors piled into the market not wanting to miss out. At today’s close we have returned to the low of this uptrend channel. We still may dip below this low end of the channel, but there are a few encouraging technical readings. As we reached the low end of the channel at today’s close, the market may have formed a “W” 1-2-3 swing bottom with Tuesday’s intraday low. If we can clear the middle of the “W” high at point 2 (Wednesday’s intra-day high) and close above it that would be encouraging. In addition, the VIX was significantly lower at today’s low than it was at Tuesday’s low.
At times like these it is crucial to remember that emotion is our worst enemy and not to succumb to fear and greed and react hastily to current events. Stick to the strategy that has stood the test of time. Our January Indicator Trifecta came in positive this year reinforcing our bullish outlook from our Annual Forecast. And as you all know, February is the weak link in the Best Six Months and
large January gains tend to correct or consolidate in February as they recently did in 2016, which was followed by a resumption of the rally. So let’s not make any rash moves and stay the course.
|
DJIA Closes Below December Low
|
|
By:
Christopher Mistal
|
February 08, 2018
|
|
|
|
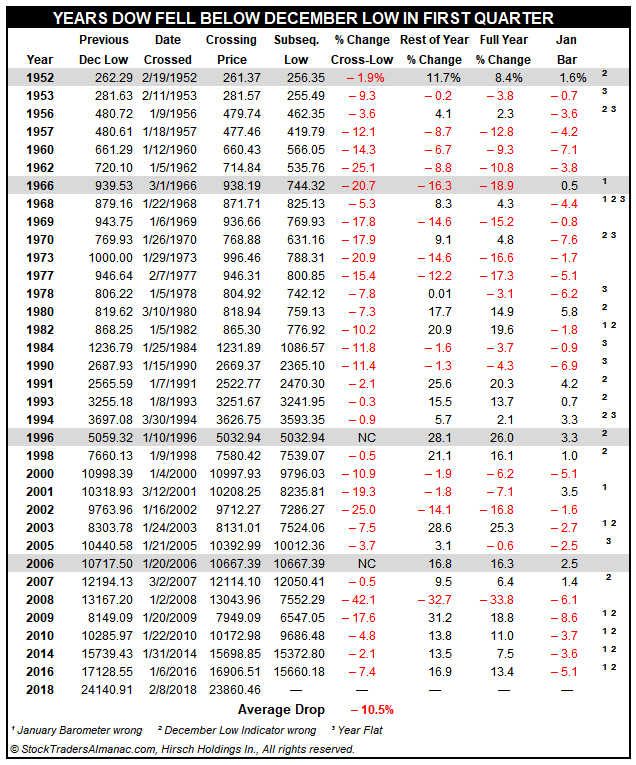
Historically, when DJIA closes below its December closing low in the first quarter of the New Year it was frequently an excellent warning sign. Since 1950, this has occurred 35 times, including today. Of the previous 34 occurrences, all but two of the instances experienced further declines, as DJIA fell an additional 10.5% on average. The two years where DJIA did not fall further were 1996 and 2006 (see page 38 of Stock Trader’s Almanac 2018).
All instances of DJIA closing below its December low are in the following table. “Rest of the Year % Change,” “Full Year % Change” and January Barometer (“Jan Bar”) are also included. Twenty of the years still logged gains for the rest of the year while eighteen full years finished positive. Years where the January Trifecta was also positive are shaded in grey. Escalation in Vietnam with U.S. planes bombing Hanoi likely contributed to losses in 1966. Increased Federal spending also pushed interest rates and inflation modestly higher that year. There is the possibility that this year could see some further declines, but as long as economic data remains on firm footing then the current pullback is likely to be just a reversion to the trend that has been in place since November 2016. Markets had gotten ahead of the trend in January and are now below it.
|
Gold & Silver Bounce Appears To Be Stalling
|
|
By:
Jeffrey A. Hirsch & Christopher Mistal
|
February 01, 2018
|
|
|
|
Historically silver has peaked in February, most notably so in 1980 when the Hunt Brothers’ plot to corner the silver market was foiled. Our seasonal analysis shows that going short on or about February 20 and holding until about April 25 has worked 34 times in the last 45 years for a win probability of 75.6%. As you can see in the short silver table, the usual February silver break was trumped by the overarching precious metal bull market of 2002–2011 just four times in ten years.
After suffering losses for two years in a row in 2010 and 2011, this trade returned to success with its second best performance in 2012 as precious metals in general fell out of favor. This trade was then successful in 2013, 2014 and 2015. A shaky start for stock markets in early 2016 combined with multi-year lows for silver sparked fresh demand for the metal resulting in a loss that year, but this trade returned to success in 2017.
In the above chart, silver’s weekly price bars appear in the top half of the chart and silver’s seasonal trend since 1972 appears in the bottom half. Typical seasonal weakness is highlighted in yellow. Historically, silver has declined from late-February/early-March until the end of June. This year, typical seasonal weakness has yet to materialize, but silver is struggling to exceed $17.50 per ounce. After bouncing off mid-December lows, silvers rise has stalled in 2018.
![[ProShares UltraShort Silver Daily Bar Chart]](/UploadedImage/AIN_0318_20180201_ZSL.jpg)
ProShares UltraShort Silver (ZSL) is an inverse (bearish) ETF that seeks to return two times the inverse of the daily performance of silver bullion priced in U.S. dollars for delivery in London and is one choice to trade this seasonality in the Almanac Investor ETF Portfolio. Average daily trading volume can be light, but when silver does make a move lower, trading activity in ZSL generally does expand quickly. ZSL can be considered on dips below $30.20 or when silver trades above $17.50 per ounce. If purchased, employ a stop loss of $28.15.
Gold’s Sympathy Slide
Seasonally, there is also a weak price period for gold from mid-February until mid to late June. Entering a short position on or about February 20 and holding until March 15 has been a successful trade 26 times in the past 43 years for a success rate of 60.5% with a cumulative profit of $43,800 per futures contract. However, in recent years holding onto the short position established in February longer has been the more profitable trade.
The chart below is a weekly chart of the price of gold with the exchange-traded note (ETN) known as DB Gold Double Short (DZZ) overlaid to show the inverse price correlation between the two trading vehicles. The line on the bottom section is the 43-year average seasonal tendency showing the market’s directional price trend with seasonal weakness highlighted in yellow. DZZ trades 2x the inverse of the daily price change of a single gold futures contract.
As you can see in this next chart, DZZ may have found a bottom in mid-December. Gold’s rally appears to be stalling around $1350 per ounce. DZZ could be considered on dips below $5.00. If purchased a stop loss of $4.75 is suggested.
Both of today’s new trade ideas will be tracked in the Almanac Investor ETF Portfolio.
Disclosure Note: At press time, officers of the Hirsch Holdings Inc., or accounts they control did not hold a position in ZSL or DZZ, but may buy or sell at any time.