|
Market at a Glance - February 27, 2025
|
|
By:
Christopher Mistal
|
February 27, 2025
|
|
|
|
Please take a moment and register for our members’ only webinar, March 2025 Outlook & Update on Wednesday March 5, 2025, at 2:00 PM EST here:
Please join us for an Almanac Investor Member’s Only discussion of recent market action with time for Q & A at the end. Jeff and Chris will cover their outlook for March 2025, review the Tactical Seasonal Switching Strategy ETF, Sector Rotation ETF, and Stock Portfolio holdings and trades. We will also share our assessments of the economy, Fed, inflation, geopolitical events as well as relevant updates to seasonals now in play.
If you are unable to attend the live event, please still register. Within a day of completion, we will send out an email with links to access the recording and the slides to everyone that registers.
After registering, you will receive a confirmation email containing information about joining the webinar and a reminder message.
Market at a Glance
2/27/2025: Dow 43239.50 | S&P 5861.57 | NASDAQ 18544.42 | Russell 2K 2139.66 | NYSE 19808.15 | Value Line Arith 10944.07
Seasonal: Neutral. Usually a solid performing month, March has tended to be softer in post-election years as it is the last month of the historically weak Q1. In post-election years since 1950, March ranks #7 for DJIA and S&P 500, #9 for NASDAQ. Average performance slips to a low of –0.1% from NASDAQ to a best of 0.8% by S&P 500. In the recent 21-year period, March has tended to open softly but then suffer weakness through mid-month before rallying to its finish. Post-election year Marchs tend to open well and exhibit strength until just after mid-month before struggling to close out the month.
Fundamental: Mixed. Inflation remains a major issue for the market. Growth is cooling as the revised Q4 GDP was essentially unchanged earlier today at 2.3%. Slowing growth has allowed longer-term interest rates to retreat modestly, but they are not likely to fall much further without a reversal in recent inflation data trends. Tariffs and rapid-fire changes by the new administration only further sour the market’s mood.
Technical: Testing Support. DJIA, S&P 500, and NASDAQ have all slipped below their respective 50-day moving averages. NASDAQ’s chart is weakest as it has fallen through its January low. S&P 500 appears to be headed toward a retest of its January low. DJIA is least bad with the greatest breathing room until its January low. Key levels to watch first are around DJIA 42300, S&P 500 5835, NASDAQ 18350. Should these levels break, the odds of a Q1 correction (at least a 10% pullback from recent highs) increase.
Monetary: 4.25 – 4.50%. The Fed has struggled to contain inflation, and progress appears to have stalled. January’s reading of Personal Consumption Expenditures (PCE), due out tomorrow, February 28, could easily be hotter than expected and could further stress the market and the Fed. Current market expectations for the next Fed interest rate cut are not until its June meeting. At this juncture, this seems a bit optimistic given the recent trend in inflation data.
Sentiment: Souring. According to
Investor’s Intelligence Advisors Sentiment survey Bullish advisors stand at 44.3%. Correction advisors are at 31.1% and Bearish advisors number 24.6% as of their February 26 release. Patience may be wearing thin for the market. A feeble and failed break-out attempt has many traders and investors reassessing the overall market. Should technical support fail, sentiment is likely to become even darker. It is important to note that the sentiment extremes associated with historical market lows still have not materialized. Current sentiment suggests caution remains a prudent course.
|
March Outlook: Hang Tight It’s All About Inflation Expect Post-Election Chop
|
|
By:
Jeffrey A. Hirsch & Christopher Mistal
|
February 27, 2025
|
|
|
|
President Trump is shaking things up like never before. As promised Trump 2.0 has the put federal government, domestic politics and global affairs on their heels. His transactional, art-of-the-tariff tactics has the market on edge. But the reality is that the S&P 500 and NASDAQ 100 just hit new all-time highs last week. Yes, we have sold off since, but S&P is down just 4.6% at today’s close, but the intraday January 13 lows have held.
While the Trump administration may have the world on the run and stocks nervous at the moment, inflation is still the likely main driver of the market. That January low was triggered by inflation fears from a blowout jobs report. All eyes will be on tomorrow’s PCE inflation number. In addition to the tariffs and federal government overhaul, traders are also jittery over Nvidia and the mega cap techs. Some reality is hitting home that AI boom stocks are too rich. Rotation is healthy but for now folks are selling willy-nilly in the short term.
But it’s all about inflation. Expectations for tomorrow’s release are that headline PCE inflation rose 0.3% on a monthly basis for January and 2.5% on an annual basis. Core PCE is expected to come in the same on a monthly basis, but 2.6% annually, down from 2.8% in December. Anything more than that will likely spook stocks further. If we hit those numbers or come in lower that could put the low in for this selloff. That doesn't mean we are out of the woods though. We have warned that a 10% correction is possible this year, but perhaps not at this juncture.
We have updated our PCE Inflation Projection chart and as long as we stay at 0.3% or better on a monthly basis annual inflation is projected to trend down over the next five months. This will also keep the Fed on track for one or two rate cuts in the second half of the year. Tamer inflation will increase the likelihood of more cuts earlier. But for now, we don’t expect a cut before June.
Post-Election Years Plague Republicans
The fear on The Street is palpable and it’s hitting levels associated with interim lows and rebounds. We have warned all year that this type of chop and volatility is to be expected in post-election years, especially in Q1. With the S&P 500 dipping into the red for the year today, we turn to page 28 of the 2025 Stock Trader’s Almanac, “Post-Election Year Performance by Party.” Historically, more bear markets and negative market action have plagued Republican administrations in the post-election year whereas the midterm year has been worse for Democrats.
New republican administrations tend to come in and get down brass tacks more so than new democrats. This generates market uncertainty and Trump 2.0 has moved faster and further and covered more ground than any we can remember. Since 1985 post-election years have been the best year of the 4-year cycle with the S&P 500 averaging 18.1%, up 9, down 1. The third year, the pre-election year, ranks #2 up 16.4% on average, up 8, down 2. But as you can see on page 28 of the 2025 Almanac the market was down 5 years in a row under republican presidents in post-election years from 1953 to 1981.
So, in addition to updating the S&P 500 Post-Election Year Seasonal Pattern chart we have been tracking we have two addition analogs to examine. First note that at today’s close S&P fell into negative territory down -0.34% for the year. But that is right near the typical level for all post-election years at this point in the year as shown in the black line.
In the second chart we have added a line that is an average of those 5 down years in a row under republican presidents in post-election years from 1953 to 1981. Yes, it is rather disconcerting, but we want to be looking at the market with our eyes wide open as the headwinds continue to mount on several fronts.
In the last chart we have taken a two-year look at the three worst republican post-election years from page 28 of the 2025 Almanac: 1957, 1969, 1973. Election year 2024 had many similarities with election year 1968. The market trend was similar, notably the summer and December pullbacks. Both years had sitting Democratic presidents drop out of the race followed by republicans winning back the White House. The late 1960s had the Nifty-Fifty stocks and today we have the Mag 7.
The 1972-1973 pattern is also similar, while 1956-1957 is less so. But both were second term republicans with complex geopolitical and economic environments: Vietnam and the Cold War, turmoil in the Mideast, oil embargos and recessions. The current economy remains resilient and does not appear to be heading toward recession. These charts should help us identify a change in the health of the bull market. Should the market retreat further at this juncture that could bring the incumbent party loss and negative Republican Administration lines and our
Annual Forecast Worst Case scenario into play, which we gave a 10% probability.
If the market fails to recover soon, we may be in store for some old school weak Republican President post-election year performance. For now, the January 13 S&P 500 intraday low at 5773.31 has held. The market remains in an uptrend with major support at the 200-day moving average around 5734, which is still only a 6.7% correction. Hang tight, honor the stops and we look forward to going over the PCE numbers and the subsequent market action during the members’ webinar next Wednesday.
Pulse of the Market
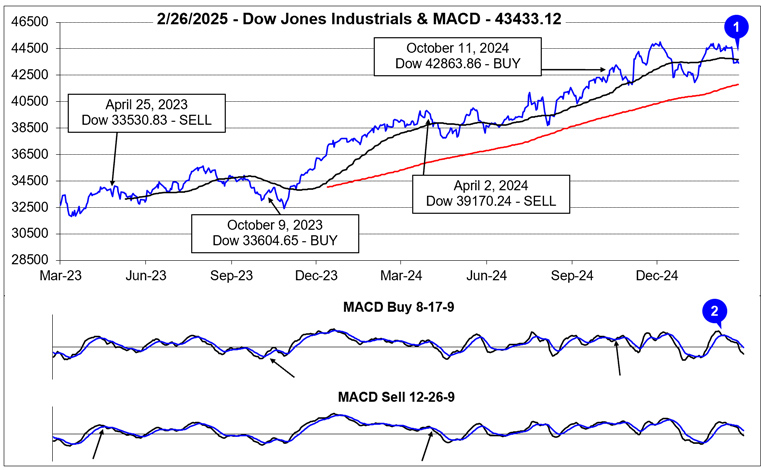
Market confidence has taken a hit here in the latter half of February, but for all the headline-driven concerns, DJIA has held up fairly well, slipping just below its 50-day moving average (1) over the past four trading sessions through February 26. After failing to break out to new all-time closing highs in early February, both the faster and slower moving MACD indicators applied to DJIA (2) confirmed the loss of bullish momentum by turning and heading lower. Gains in February would have been welcome, but it appears this February is turning out to not only be the weak link of the Best Months, but also in line with typical post-election year Q1 and February weakness. Bullishly, support at DJIA’s January lows and its 200-day moving average has held.
For all the chop and volatile swings, the market has endured thus far in 2025, DJIA remains positive year-to-date, up 2.1% as of its close on February 26. DJIA has logged one Down Friday/Down Monday (DF/DM) this year during the final week of January and the first trading day of February. Damage has been heavy on Fridays (DJIA down 6 of the last 8), but Mondays have been strong, DJIA up six of the last eight (3). Should the trend of strength on Mondays persist, it would not be surprising to see Fridays begin to improve which would be encouraging.
S&P 500 (4) and NASDAQ (5) have been modestly weaker in 2025 with each down a total of five weeks. S&P 500 slid into negative territory year-to-date today, down 0.34%. NASDAQ is now down 3.97%. A return to strength across all three indexes (and Russell 2000) would also be encouraging, but this may not happen until sometime later in March of even after Q1 ends.
Weekly market breadth has remained reasonably consistent with the major indexes’ ups and downs. With the exception of week ending February 7, Weekly Decliners have outnumbered Weekly Advancers during down weeks and last week’s sizable retreat also saw the greatest number of Weekly Decliners (6). A significant improvement in Weekly breadth metrics does not seem likely, while the new administration maintains a fast and furious pace of changes. Stability with a slow and moderate pace of change has historically been a better backdrop for market gains.
Absent a breakout or breakdown, Weekly New 52-week Highs and Lows (7) are also likely to continue to churn as the market chops along. No new clear trend has been successful in asserting itself this year. A handful of weeks with expanding New 52-Week Highs associated with a corresponding decrease in New Lows, would be positive and potentially indicate the resumption of the bull market.
Short-term interest rates have hovered around 4.20% since the Fed’s last cut in December. Recent inflation metrics have remained stubbornly elevated, but economic activity does appear to be softening, which has allowed the 30-year Treasury bond yield (8) (and 10-year Treasury not shown) to retreat. Tomorrow’s Personal Consumption Expenditures (PCE) has the potential to move rates in a meaningful manner. Any reading hotter than expected could easily send interest rates higher once again.
|
March Almanac & Vital Stats: Not as Strong in Post-Election Years
|
|
By:
Jeffrey A. Hirsch & Christopher Mistal
|
February 20, 2025
|
|
|
|
As part of the Best Six/Eight Months, March has historically been a respectable performing month with DJIA, S&P 500, NASDAQ, Russell 1000 & 2000, advancing more than 64% of the time with average gains ranging from 0.7% by Russell 2000 to 1.1% by S&P 500. Over the recent 21-year period (2004-2024), March has tended to open positively with gains accumulating over the first three trading days. A bout of weakness has followed (solid arrow below) before all indexes begin moving higher around mid-month through month’s end.
In post-election years since 1950, March has also tended to open strongly, but strength has generally persisted until shortly after mid-month (dashed arrow below). At which point, the major indexes lost momentum and closed out March with some choppy trading. One possible reason for stronger performance in post-election-year Marchs is the historically tough time the market has had in past post-election-year Februarys. Despite today’s (February 20) market retreat, this February is still above its historical average performance which could limit or weigh on early March gains.
![[Recent 21-Year March Seasonal Pattern Chart]](/UploadedImage/AIN_0325_20250220_March_2025_Seasonal_Chart.jpg)
March packs a rather busy docket. It is the end of the first quarter, which brings with it quarterly Quadruple Witching and an abundance of portfolio maneuvers from The Street. March Quad-Witching Weeks have been quite bullish in recent years. But the week after has been nearly the exact opposite, DJIA down 22 of the last 37 years—and often down sharply. In 2018, DJIA lost 1413 points (–5.67%) Notable gains during the week after for DJIA of 4.88% in 2000, 3.06% in 2007, 6.84% in 2009, 3.05% in 2011, and a staggering 12.84% in 2020, are the rare exceptions to this historically poor performing timeframe.
Post-election year payments to the Piper have exacted a toll on March as average gains are trimmed. (see Vital Statistics table below). In post-election years March ranks: #7 for DJIA and S&P 500; # 8 for Russell 1000 and Russell 2000; and #9 for NASDAQ. NASDAQ also has the largest change in its average performance, dropping from +0.8% in all Marchs since 1971 to a loss of 0.1% in 13 post-elections years. NASDAQ’s massive 14.5% drop in 2001 is only partially offset by its impressive 10.9% advance in 2009.
Saint Patrick’s Day is March’s sole recurring cultural event. Gains on Saint Patrick’s Day have been greater than the day before and the day after. Perhaps it’s the anticipation of the patron saint’s holiday that boosts the market and the distraction from the parade down Fifth Avenue that causes equity markets to languish. Or maybe it’s the fact that Saint Pat’s often falls in historically bullish Quad-Witching Week.
Whatever the case, since 1950, the S&P 500 posts an average gain of 0.27% on Saint Patrick’s Day (or the next trading day when it falls on a weekend), a gain of 0.07% the day after and the day before averages a 0.11% advance. S&P 500 median values are 0.17% on the day before, 0.23% on Saint Patrick’s Day and 0.07% on the day after. In the ten years when St. Patrick’s Day fell on a Monday, like this year, since 1950, the day before (Friday) produced an average gain of 0.04%, while Tuesday averaged 0.15% and the following Wednesday averaged 0.55%.
|
March 2025 Strategy Calendar
|
|
By:
Christopher Mistal
|
February 20, 2025
|
|
|
|
|
Stock Portfolio Updates: Exiting Free Lunch & Selective Buying
|
|
By:
Christopher Mistal
|
February 13, 2025
|
|
|
|
With each passing inflation data point, it is increasingly looking like the Fed was overly aggressive with cutting its key lending rate last year. Yesterday’s Consumer Price Index (CPI) report was hotter than expected with headline and core readings above estimates. Today’s Producer Price Index (PPI) was also higher than forecast but was largely shrugged off as some details of the report apparently suggested a more benevolent inflation outlook. Perhaps, but with headline CPI at 3.0% and PPI at 3.5% year-over-year, both are well above the Fed’s stated 2% target.
From a historical perspective, above average inflation metrics for the month of January do not appear to be all that uncommon. Using monthly percent change in CPI and PPI from 1947 to present broken down by month, we find January’s average CPI reading to be the third highest, behind June and September. January PPI readings have on average been the largest. Please note, we used the “All Commodities” PPI from the St. Louis Fed Fred database as the current PPI “Final Demand” only dates back to late 2009.
Without going too deep into the differences between the two PPIs, the newer Final Demand version apparently measures price changes for goods, services, and construction sold for personal consumption, capital investment, government, and export while the older All Commodities generally captures pricing data along various steps in the production process. Given a choice, the older version is likely a better indicator of where prices are likely headed at the consumer level.
The final inflation metric Personal Consumption Expenditures (PCE), due out later this month on February 28, is reported to be the Fed’s preferred inflation gauge. Based upon its historical average monthly change in January, and the higher-than-expected readings for CPI and PPI, we would not be surprised if PCE was also hotter than current estimates.
If that is the case, then more of the same choppy but still generally higher trading we have been experiencing is likely. Market expectations for the next Fed rate cut have already adjusted out to September based upon the CME Group’s
FedWatch Tool today. The Fed is likely going to be keeping rates higher for longer, but we do remain bullish for full-year 2025 and our Base Case scenario is in play with full-year S&P 500 gains in a range of 8-12%.
Should S&P 500 hold onto its gains this month, odds further improve as its historical performance after a positive January and a positive February has been quite solid with just one fractional loss in 32 years since 1938 and only two declines in the last 10 months of the year.
Stock Portfolio Updates
Small cap stocks have not been able to hold any positive momentum during their current seasonally favorable period. Inflation and 10-year Treasury bond yields continue to be a dark cloud overhanging the market and small caps in particular. Our Small Cap stocks are mixed. Older holdings have been holding up, like Navigator Holdings (NVGS) and Mama’s Creations (MAMA). NVGS has been relatively quiet while MAMA has traded in its usual choppy manner, but remains our best small-cap, up 101.1% since addition. NVGS and MAMA are on Hold. Willdan Group (WLDN) has not fared as well and was stopped out on February 3 when it closed below its stop loss.
Healwell AI (HWAIF) is down about 16.4% as of today’s close, most likely due to the dilution associated with the private placement financing deal to acquire Orion Health. When all the units and warrants are exercised it will add 100 million shares to the float. The warrants are not exercisable for 3 years and at a price of $2.50 per share. This brings total fully diluted shares outstanding to 331.8 million and the market cap to $388.2 million.
The Orion deal is expected to close April 1. Orion is a considerably larger operation than Healwell and in addition to adding a host of technological synergies, Orion will add $100 million in annual revenue and $20 million to the bottom line, keeping the company on track to profitability this year. Healwell currently reaches about 20 million patients, the Orion acquisition adds over 150 million patients.
Orion also increases the company’s commercial footprint with its 20-year history of operating with public and private healthcare systems around the world. It provides a beachhead in the USA into several mid-tier healthcare systems in the West and Midwest as well as several longstanding partnerships in Saudi Arabia, UAE, the UK, Ireland, Scotland, Spain, France, Australia and New Zealand, including several NHS locations in England, Northern Ireland and Scotland.
In addition, Healwell’s Pentavere recently published a study in the Journal of Liquid Biopsy, validating DARWEN AI as a leading artificial intelligence clinical decision support tool in oncology. The study found that the DARWEN AI platform achieved a 100-fold improvement in time savings versus traditional manual processes. Buy HWAIF at current prices with a Buy Limit of $1.25.
In anticipation of further volatile and choppy trading, potentially throughout the balance of February, we have put every position in the Mid Cap and Large Cap sections of the portfolio on a buy, except Leonardo DRS (DRS). A possible end to conflict in Ukraine could temporarily knock defense stocks down. Should this happen to DRS, we have raised its stop loss. DRS is on Hold.
Sterling Infrastructure (STRL) did close below its stop loss today. We are not going to close this position out instead we are going to implement a new lower stop loss. The recent sell-off in construction and infrastructure companies looks way overdone with technical indicators near or at oversold levels.
If you do not have an existing position(s) or are considering adding to an existing position(s), any additional February weakness could be considered an opportunity to do so.
Free Lunch Fizzles – Close Remaining Positions
Our Free Lunch stocks had been performing reasonably well considering broader weakness exhibited by the Russell 2000 small-cap stock index. There also have been few signs of a typical “January Effect” of small-cap outperformance (pages 112 and 114 of the 2025 Almanac) so far this year. Without the “January Effect,” Free Lunch stocks have struggled. Not to mention the negative impacts of the 10-year Treasury bond yield remaining stubbornly elevated. As of the close on February 12, the entire Free Lunch portfolio was down 2.9%. Ten of the original 26 stocks have been stopped out and ten are still showing a gain. PBF Energy (PBF) closed below its trailing stop loss today and will be closed out on February 14.
As detailed on page 116 of the 2025 Almanac, and in the Free Lunch email Issue from
December 21, 2024, the time has arrived to close out all remaining Free Lunch positions. Performance has been deteriorating since around early/mid-January and today’s laggard Russell 2000 performance further suggests it is time to move on.
Sell all remaining Free Lunch stocks. For tracking purposes, all remaining Free Lunch stocks will be closed out of the portfolio using their respective average daily price on Friday, February 14.
Please see the table below for updated advice, stop losses and buy limits where applicable.
Disclosure note: Officers of Hirsch Holdings Inc hold positions in AMAL, CUK, CXDO, FIX, GRMN, IBN, IESC, MCY, NECB, OSIS, POWL, SPXC, STRL, TRN, and WLDN in personal accounts.
|
ETF Trades & Updates: Natural Gas Pullback Appealing
|
|
By:
Christopher Mistal
|
February 06, 2025
|
|
|
|
For those who were unable to attend the member’s only webinar on Wednesday, the slides and video recording are available
here (or copy and paste in a new browser window:
https://www.stocktradersalmanac.com/LandingPages/webinar-archive.aspx). Jeff kicked off the webinar with a review and reminder of post-election year historical trends and patterns. Important takeaways from the webinar included: the market is tracking historical patterns and Q1 in post-election years tends to be mixed and choppy. He also reiterated that the current market chop was expected and is likely to continue as the new administration is wasting no time rolling out a myriad of policy initiatives and changes.
After a quick review of market breadth data, Jeff then noted the absence of the typical “January Effect” of small-cap stock outperformance is a concern. Small caps have historically done well in February, but not as well in
post-election year Februarys. Should the market begin to retreat in February, key levels of support for S&P 500 and NASDAQ are around their respective Election Day gaps and last summer’s highs (slides 15 & 16).
Next topics covered included the retreating 10-year Treasury bond yield, most likely due to slowing economic growth, based upon initial Q4 GDP, as employment data appears to be holding up while inflation remains stubbornly above 2%. The next Fed rate cut is not likely until June, barring any major change in the data. Bitcoin’s seasonal pattern and historical Q1 strength were then covered before moving onto quick looks of gold, crude oil, and natural gas technicals.
Positive Januarys Show Greatest Outperformance
In addition to all of our numerous January indicators, the clearest reason why we place such importance on January is the fact that no other month in the year exhibits as much outperformance when the month is up versus when the month is down over the following 11-months and 12-months. Since 1938, when the S&P 500 was up in January, the next 11-months average a gain of 11.8%. When January is down, the next 11-months average plummets to just 1.2%. Years with a positive January have historically outperformed a down January by 10.6%. Over the following 12 months, the outperformance grew to 11.3%.
As you can see from the following bar chart, no other month comes close to the improvement in subsequent performance when the month is up versus when the month is down. We are sticking to our Base Case scenario from our
2025 Annual Forecast for average
full-year gains of 8-12% with chop and weakness continuing in Q1 and likely again sometime during Q3.
New February Sector Seasonality
Based upon the NYSE ARCA Natural Gas Index (XNG), there is a seasonal tendency for natural gas companies to enjoy gains from the end of February through the beginning of June. Detailed in the Stock Trader’s Almanac 2025 on page 94, this trade has returned 17.80%, 18.00%, and 19.09% on average over the past 25, 10, and 5 years respectively. Natural gas seasonal strength, the underlying commodity that drives shares of companies that comprise XNG, can be seen in the following chart, highlighted in yellow.
![[NG Weekly Bars (NG) and 1-Year Seasonal Pattern since 1990]](/UploadedImage/AIN_0325_20250206_NG_Seasonal.jpg)
One of the factors for this seasonal price gain is consumption driven by demand for heating homes and businesses in the cold weather northern areas in the United States. In particular, when December and January are colder than normal, we can see drawdowns in inventories through late March and occasionally into early April. This can result in price spikes lasting through mid-April and beyond. Crude oil also tends to rise during this timeframe in anticipation of the summer driving season and many of the companies also have exposure to crude oil.
Here in the Northeast, just outside of New York City, it certainly feels like winter has been colder than average thus far this year. Even though we have not seen substantial amounts of snow, there have been many days below freezing. The cold weather has increased demand for natural gas and inventories are now modestly below average when compared to the past five years. Beyond the near-term, natural gas demand is likely to grow as the new administration has resumed export permit processing for new liquified natural gas projects. Tariffs could impact exports, but the impact is likely to be limited to a small number of countries.
First Trust Natural Gas (FCG) is our top choice to gain exposure to the company side of the natural gas sector. FCG could be considered on dips below a buy limit of $24.54. Once purchased, consider using an initial stop loss of $21.33 and taking profits at the auto-sell price, $31.80. As a reminder the auto sell price is based upon FCG’s buy limit plus the sector’s average price return over the last 25 years with an additional 10% added. Additionally, should FCG reach the auto-sell, a tight trailing stop could be used in lieu of an outright sell.
The top five holdings by weightings as of yesterday’s close are: Hess Midstream, Western Midstream, EQT Corporation, ConocoPhillips, and Occidental Petroleum. The net expense ratio is reasonable at 0.6% and the fund has approximately $442.3 million in assets. For tracking purposes, we will add FCG to the Sector Rotation ETF portfolio if it trades below its buy limit.
Sector Rotation ETF Portfolio Updates
No sector seasonalities are scheduled to end during February. iShares Semiconductor (SOXX) is still on Hold, even though its historically seasonally favorable period ended in December. SOXX had broken out of its nearly 3-month long trading range in January and was nearly back to break even when it was crushed by news of DeepSeek. Strong support does appear to be right around its stop loss of $210.52. DeepSeek did trigger and expand AI discussions, but AI is here and is not likely to continue to advance without further research, development, and sales from the companies held in SOXX.
Per last month’s update, new positions have been established in SPDR Materials (XLB), Global X Copper Miners (COPX), SPDR Energy (XLE) and S&P Oil and Gas Equipment & Services (XES). All four positions were modestly positive at yesterday’s close. XLB, COPX, XLE and XES can all still be considered below their respective buy limit prices.
Other holdings in the Sector Rotation portfolio have a wide performance variation, but most have improved since our early January update. Excluding iShares Bitcoin (IBIT), SPDR Consumer Discretionary (XLY) is the best performer, up 16.3% as of its February 5, close. It would appear “never bet against the consumer” remains true to this day or at least as long as employment data and wages remain respectable. XLY is on Hold. iShares US Technology (IYW) is second best, up 12.1%. Most of this gain can be attributed to an earlier purchase as many of IYW’s holdings have retreated this year. IYW is on Hold.
With the 10-year Treasury bond yield retreating, SPDR Staples (XLP), SPDR Healthcare (XLV) and Vanguard REIT (VNQ) have been improving. Should rates continue to retreat, XLP, XLV and VNQ could easily continue to improve. XLP, XLV, and VNQ can be considered at current levels or on dips.
In anticipation of some seasonal weakness in February, most likely beginning after mid-month and/or Presidents’ Day, many positions in the Sector Rotation portfolio can be considered on dips below their respective buy limits in the table below. This applies if you do not have an existing position(s) or if you are looking to add to an existing position(s).
Please note some stop losses have been adjusted to account for recent gains.
Disclosure note: Officers of Hirsch Holdings Inc hold positions in IBB, IBIT, COPX, and XES in personal accounts.
Tactical Seasonal Switching Strategy ETF Portfolio Updates
Positions in the Tactical Seasonal Switching Strategy portfolio are now up 4.4% on average as of the close on February 5 compared to 1.0% on January 8. All four positions improved led by SPDR DJIA (DIA) as it swung from a mild loss of 0.9% to a 4.5% gain. At just over halfway through the Best Six Months for DJIA and S&P 500 and not even halfway through NASDAQ’s Best Eight Months, performance thus far is in line with historical average performance. All positions in the Tactical Seasonal Switching portfolio can be considered on dips if you do not have a position or are looking to add to an existing position. Please see the table below for suggested buy limits.
Disclosure note: Officers of Hirsch Holdings Inc hold positions in IWM, QQQ, and SPY in personal accounts.
|
January Barometer Positive: Base Case Forecast In Play
|
|
By:
Jeffrey A. Hirsch & Christopher Mistal
|
January 31, 2025
|
|
|
|
S&P 500 gained 2.7% in January and thus our January Barometer is positive for 2025. Devised by Yale Hirsch in 1972, the January Barometer has registered 12 major errors since 1950 (with full-year 2024 included) for an 84.0% accuracy ratio. This indicator adheres to propensity that as the S&P 500 goes in January, so goes the year. Of the 12 major errors, nine have occurred since 2001. Including the eight flat years yields a .733 batting average.
Our January Indicator Trifecta combines the Santa Claus Rally (SCR), the First Five Days Early Warning System (FFD) and our full-month January Barometer (JB). The predicative power of the three is considerably greater than any of them alone; we have been rather impressed by its forecasting prowess. It was certainly on the mark in 2023 when all three were positive and S&P 500 gained 24.2%. However, this year is just the fourth time that the SCR was down, while the FFD and the JB were positive.
Focusing on just the positive JB alone has a solid track record. Up Januarys are followed by up years, 88.9% of the time (40/45 years) with an average S&P 500 gain of 17.0%. 14 of 18 of the last post-election years followed January’s direction. When January is positive in post-election years (shaded in grey in table below), 8 of 9 full years were up with an average gain of 17.8%. 2001 was the exception. January was up 3.5%, but the full year was down 13.0%. (See STA 2025 page 18 for more.)
With our January indicators complete, we are affirming our
2025 Base Case scenario for average full-year gains of 8-12% with a lot of chop and weakness in Q1 and Q3. Seasonals continue to track, economic growth and the labor markets are holding up, but tariffs, additional rate cuts and AI costs remain significant concerns.