|
Market at a Glance – March 27, 2025
|
|
By:
Christopher Mistal
|
--
|
|
|
|
Please take a moment and register for our members’ only webinar, April 2025 Outlook & Update on Wednesday April 2, 2025, at 2:00 PM EST here:
Please join us for an Almanac Investor Member’s Only discussion of recent market action with time for Q & A at the end. Jeff and Chris will cover their outlook for April 2025, review the Tactical Seasonal Switching Strategy ETF, Sector Rotation ETF, and Stock Portfolio holdings and trades. We will also share our assessments of the economy, Fed, inflation, geopolitical events as well as relevant updates to seasonals now in play.
If you are unable to attend the live event, please still register. Within a day of completion, we will send out an email with links to access the recording and the slides to everyone that registers.
After registering, you will receive a confirmation email containing information about joining the webinar and a reminder message.
Market at a Glance
3/27/2025: Dow 42299.70 | S&P 5693.31 | NASDAQ 17804.03 | Russell 2K 2065.70 | NYSE 19534.72 | Value Line Arith 10661.44
Seasonal: Bullish. April is the #2 month for DJIA and S&P 500 (since 1950), and #4 NASDAQ month (since 1971). In post-election years, April is also second best for DJIA and S&P 500 but improves to third best for NASDAQ. Average gains also improve in post-election years. Tax deadline impact has faded. April historically firm start to finish over last 21 years. April is the final month of the “Best Six Months” for DJIA and S&P 500. Remain attentive as our Seasonal MACD Sell signal can occur on or after April 1.
Fundamental: Mixed. Q4 GDP was revised 0.1% higher to 2.4%, but the Atlanta Fed’s GDPNow model is estimating Q1 growth could decline 1.8% as of their March 26 release. The unemployment rate remains reasonably solid at 4.1%, a modest improvement from its recent peak, but the pace of monthly net job gains appears to be slowing. Inflation appears to have resumed its slow retreat but still remains above the Fed’s stated 2% target. Slowing growth and elevated inflation are raising concerns about possible stagflation. Beyond the mixed data, tariffs are the greatest uncertainty the market is currently facing. More tariff related announcements are expected.
Technical: Bounce fading? After finding support around last September’s lows, DJIA, S&P 500 and NASDAQ all bounced back. At the peak of the bounce, DJIA and S&P 500 had reclaimed their respective 200-day moving averages. With the bounce-back losing steam, the next best technical setup would be for the indexes to trace out a “W” bottom pattern. This would entail a test of the recent lows before rebounding higher once again. Should the retest fail, the levels to watch are around DJIA 40250, S&P 500 5390, and NASDAQ 16700.
Monetary: 4.25 – 4.50%. The Fed is in “wait and see” mode. They acknowledged the economy has continued to expand at a solid pace and inflation remains somewhat elevated. Two additional 0.25% interest rate reductions later this year remain on the table (perhaps as early as June for the first). But more progress reducing inflation is still needed and that is likely to take more time. Perhaps the biggest change in policy in March was the announcement that the Fed is going to slow the pace of quantitative tightening. Beginning in April, its monthly redemption cap on Treasury securities will decline from $25 billion to just $5 billion. This could modestly lower interest rates.
Sentiment: Improving. According to
Investor’s Intelligence Advisors Sentiment survey Bullish advisors stand at 30.5%. Correction advisors are at 40.7% and Bearish advisors were at 28.8% as of their March 26 release. Following three straight weeks where bears outnumbered bulls, the bulls have reclaimed a slim lead. However, correction advisors are up to 40.7%. With the overall majority of advisors anticipating weakness now, the contrarian view would likely begin to see current weakness as an opportunity. Until tariff uncertainty eases, volatility is likely to remain.
|
April Outlook: Market Set to Bounce But Down Q1 Troublesome
|
|
By:
Jeffrey A. Hirsch & Christopher Mistal
|
March 27, 2025
|
|
|
|
Before we get into our updated outlook and analysis of market conditions, we are happy to announce the launch of our new podcast. Jeff is now hosting the weekly show WealthWise on Biz Talk Today TV. He records Fridays after the close and it gets posted over the weekend. Listen to the podcast on the Evergreen Podcast Network & all major platforms or watch it on YouTube. The inaugural show featured Jeff’s interview with legendary trader Larry Williams and in show 2 he discussed the outlook for bitcoin and crypto with crypto guru, Adrian Aduncyzk, CMT @crypto_birb. This week Barry Ritholtz is on the show to talk about his just-released new book How Not To Invest and other musings. Here are links to the first two shows. Hope you enjoy.
We took some flak last week in the Twittersphere for two seemingly contradictory posts. One featured our typical March performance chart that you are all familiar with from the
March Almanac issue last month. We pointed out that the “Ides of March bounce” had room to run. And it did. A couple days later, as noted on page 30 of the
Stock Trader’s Almanac in the “March Almanac,” we posted that the last three or four days of March and Q1 are prone to weakness.
March is a volatile month for the market, especially at the end of the month, frequently with wild swings in both directions. The mid-month bounce did continue, but now stocks have struggled the past two days as the month nears the close. This week after March quarterly Quadruple Witching has been weak with the Dow down 22 of Last 37, and the end of Q1 has been prone to volatility and weakness as well since 1990 with the S&P 500 down 21 of 35 years the last 3 or 4 days of March.
End-of-quarter portfolio restructuring likely plays a role as managers lock in any gains and look to establish positions for the next quarter. This has all been exacerbated by the continued shake-up in DC, which is typical of the post-election Q1 weak spot. The new Trump 2.0 administration’s challenging tariff negotiation tactics along with the unprecedented actions to cut waste in the federal government have created a high degree of uncertainty on Wall Street. This has the first quarter of 2025 on the verge of being negative with S&P down -3.2% at today’s close.
Post-Election Year Woes Persist
There’s no way to sugarcoat it, unless the market can get back into the green for the year in April, our more bullish base case scenario for 8-12% gains for 2025 becomes harder to achieve. Currently, the S&P 500 is tracking the weaker post-election patterns of republican administrations and after incumbent party losses. This action has increased the odds of our annual forecast worst case scenario.
2025 is tracking the old school weak republican president post-election year performance noted on page 28, Stock Trader’s Almanac 2025. The market is concerned the new republican administration and Congress may be implementing too many drastic measures, which tends to lead to flat to negative full-year performance. Unless the market can rebound substantially next month, we are likely in store for some tough sledding through the third quarter.
When Q1 Is Down It Can Lead to More Trouble
Adding to our concerns that the market in 2025 continues to track some of the less bullish post-election year scenarios is the history of market performance following down first quarters, especially in post-election years. From the table below of all down Q1s for the S&P 500 since 1950 several things are apparent. First the good news. April has been up on average and about 63% of the time. Q4 has been even stronger. Though both April and Q4 have taken some hits as well.
But unfortunately, Q2 and Q3 have been weak overall and Q3 especially in post-election year. Q1 and Q3 post-election-year weakness is something we discussed in our annual forecast back in December and have continued to warn you of. What we find most compelling from this data is that if the market had already achieved bear market levels when Q1 was down it was usually near a bottom or low point from which the market rallied substantially. Conversely, if Q1 is negative and the market has not reached bear market status or is not far from a recent all-time high, then we have more often than not experienced further market trouble and downside action over the subsequent nine months.
Election year 1968 seems to be the outlier as the bull market ran from October 1966 to November 1968. The infamous Tet Offensive from January to April 1968 helped knock the market down in 1968 Q1 as Johnson dropped out of the presidential race on March 31. The end of the Tet Offensive and the beginning of Paris Peace Accords in May 1968 helped keep the bull market going until November 1968 despite a host of other negative events, including the assassination of Martin Luther King, Jr. and Robert F. Kennedy who was leading a tight three-way race for the democratic candidacy.
Several of the weak republican post-election years we have discussed from page 28 of the 2025 Almanac also standout: 1953, 1957, 1969, 1973, 1981 as well as 1977, Jimmy Carter’s difficult first year. There are several other non-post-election years of concern, most recently 2022. The most impressive turnarounds from down Q1s occurred at or near the ends of bear markets in 1980, 1982, 2003, 2009 and 2020 after Covid-19 induced the shortest bear market on record.
End Best Six Months – Prepare for the Worst
While we expect a bounce in April the words of late, great analyst Edson Gould (Findings & Forecasts, 1902-1987) loom large: “If the market does not rally, as it should during bullish seasonal periods, it is a sign that other forces are stronger and that when the seasonal period ends those forces will really have their say.”
With the Best Six Months currently in the red, it suggests to us the there are other more powerful forces other than seasonality impacting the market presently. While the changes in DC may lead to a healthier debt level, a leaner, more efficient government and greater prosperity in the near future, it is all rather murky at the moment. CEOs, money managers and analysts have been scrambling to figure out how to reposition their firms, portfolios and recommendations.
If this level of uncertainty persists the market will be hard pressed to make any significant headway. Technically, the market has some work to do to find support for any sustainable tradable rally to take hold. We have highlighted in yellow this area of resistance between the old July highs and the orange circle election gap breakout roughly between 5670 and 5775. S&P closed today at 5693.31. The 200-day MA (curvy blue line) is also proving formidable at 5756.
We have added a new trend line from the April 2024 low to the August 2024 low that extends up toward the recent March 2025 low around 5500 circled in red. If the market tests and holds the March lows and then rallies though the 5775 resistance we would have ourselves the makings of potential “W-1-2-3” Swing Bottom. This would be quite constructive and increase the odds of the market, shaking off this malaise and put our Base Case Scenario of 8-12% gains for 2025 back in play. Until then we remain cautious.
Pulse of the Market
March already had a history of being somewhat challenging in post-election years. This March is on track to further amplify that poor record. With two trading days remaining in March, DJIA is down 3.5% as of its March 27 close. DJIA’s rebound from its March closing low has lifted it back above its key 200-day moving average (1) and trimmed its decline nearly in half, but the bounce has come under pressure in recent trading sessions. DJIA’s bounce has turned its slower and faster moving MACD indicators positive (2) but they are beginning to confirm the recent loss of momentum.
Since registering its first Down Friday/Down Monday (DF/DM) of 2025, DJIA has declined in four of seven weeks. Three of the weekly declines exceeded 1000 DJIA points (3). As gloomy as this seems, DJIA’s recent record is actually better than S&P 500 (4) and NASDAQ (5) as both declined in five of the last seven weeks. S&P 500 and NASDAQ did both fall into a correction, down 10% or more from their respective highs. NASDAQ remains in a correction, down 11.7% as of today’s close (March 27).
Weekly market breadth has remained reasonably consistent with the major indexes’ ups and downs over the last four weeks. With the exception of week ending February 28, Weekly Decliners have outnumbered Weekly Advancers during down weeks (6) and vice-a-versa. Even though there have been sizable weekly declines, the biggest weekly declines have only had Decliners outnumber Advancers by a little more than 2 to 1. Historically, longer rallies have been observed after Weekly Decliners exceed Advancers by 3 to 1 or more. This most recently occurred during the week ending January 10. The ratio was also reached near the end of the market’s August to October 2023 correction.
Weekly New 52-week Highs and Lows (7) have been rather choppy and uninspiring. The rather limited number of New Lows, still below their December peak of 377, suggests that selling has been selective thus far. Based upon this selective selling, perhaps the current market pullback may turn out to just be a garden variety correction. There have been some streaks of rotation towards defensive sectors, but that also appears to be lacking full commitment from traders and investors.
Short-term interest rates have hovered around 4.20% since the Fed’s last interest rate cut in December. Recent inflation metrics have improved somewhat yet remained elevated while economic activity does appear to be softening. This has likely allowed the 30-year Treasury bond yield (8) to ease and stabilize. Tomorrow’s Personal Consumption Expenditures (PCE) will be the next major release that could move Treasury bond yields.
|
April Almanac & Vital Stats: Second Best in Post-Election Years
|
|
By:
Jeffrey A. Hirsch & Christopher Mistal
|
March 20, 2025
|
|
|
|
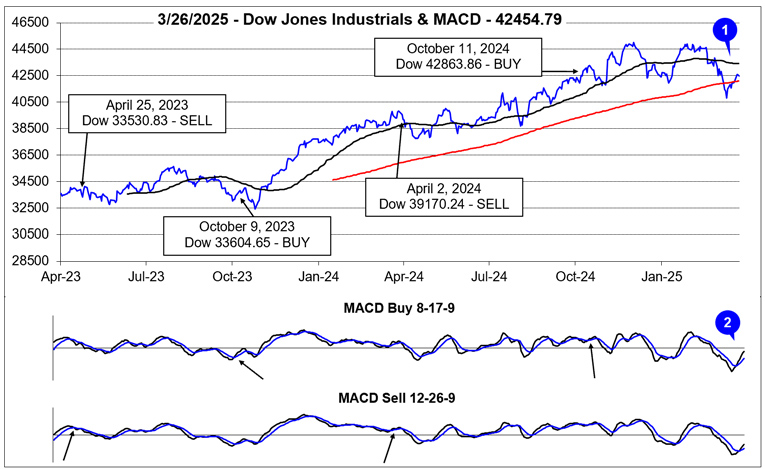
April is the final month of the “Best Six Months” for DJIA and the S&P 500. The window for our seasonal MACD sell signal opens on April 1, the first trading day of the month. From our Seasonal MACD Buy Signal on October 11, 2024, through today’s close (March 20, 2025), DJIA is off 2.1% and S&P 500 is down 2.62%. Results this year have been hampered by tariff uncertainty, AI cost jitters, geopolitical concerns heaped onto elevated technology valuations and last year's well above average gains. However, time does remain for the market to improve and return the “Best Months” back to green.
As you can see in the above chart of the recent 21-year market performance in April and post-election years since 1950, the month has been nearly perfect with gains steadily building from the first trading day to the last with only the occasional and minor blip along the way. In post-election years, April does tend to open on the soft side, but the early dip has historically been shallow and brief.
April 1999 was the first month ever to gain 1000 DJIA points. However, from 2000 to 2005, “Tax” month was hit, declining in four of six years. From 2006 through 2021, April was up sixteen years in a row with an average gain of 2.9% to reclaim its position as the best DJIA month since 1950. DJIA’s streak of April gains ended in 2022’s bear market declining 4.9% that year and 5.0% again in 2024. April is now the second-best month for DJIA and S&P 500 (since 1950) and fourth best for NASDAQ (since 1971).
The first trading day of April and the second quarter has enjoyed notable strength over the past 30 years, advancing 21 times with an average gain of 0.28% in all 30 years for DJIA. However, six of the nine declines have occurred in the last twelve years. The largest decline was in 2020 when DJIA declined 4.44% (973.65 points). Other declines were in 2001, 2002 and 2005. S&P 500’s record on April’s first trading day matches DJIA, 21 advances in 30 years. NASDAQ’s recent performance is slightly weaker than DJIA and S&P 500, but the day is still bullish for technology stocks in general with more advances than declines during the same period. April’s second trading day has also been notably strong over the past 21 years.
The last trading day of April has exhibited a bearish bias over the last 21 years. DJIA has declined 15 times with an average loss of 0.39% in all years. S&P 500 has declined 14 times, average loss of 0.49%. NASDAQ and Russell 2000 have been just as weak (based upon frequency of declines) as DJIA on the last trading day, but their respective average losses are 0.75% and 0.95%.
The first half of April used to outperform the second half, but since 1994 that has no longer been the case. The effect of April 15 Tax Deadline appears to be diminished with bullish days present throughout April. Traders and investors appear to be more focused on first quarter earnings and guidance throughout the entire month of April.
In post-election years, April remains a top performing month ranking second best for DJIA and S&P 500, and third best for NASDAQ. Average gains since 1950 for DJIA and S&P 500 are comparable to all years, but notably improve for NASDAQ, Russell 1000 and Russell 2000. NASDAQ’s three post-election year April declines were in 1973, 1993 and 2005.
Monthly options expiration week frequently impacts the market positively in April and DJIA has the best track record since 1990, with an average gain of 1.15% for the week with just eight declines in 35 years. However, S&P 500, NASDAQ, and Russell 1000 have all declined in the last three years during the week of April’s monthly option expiration. The first trading day of expiration week and monthly expiration day have been mixed, but generally bullish with positive average gains being the majority. The week after has a softer long-term record but also still exhibits modest levels of bullishness.
Good Friday (as well as Passover and Easter) lands in April this year. Historically the longer-term track record of Good Friday (page 102 of STA 2025) is bullish on the trading day before with notable average gains by DJIA, S&P 500, NASDAQ, and Russell 2000. NASDAQ has advanced 21 of the last 24 days before Good Friday. Monday, the day after Easter, has had exactly the opposite record since 1980 and is in the running for the worst day after any holiday. Since 2004 the day after has been improving with S&P 500 up 13 of the last 21 with an average gain of 0.07%.
|
April 2025 Strategy Calendar
|
|
By:
Christopher Mistal
|
March 20, 2025
|
|
|
|
|
Stock Portfolio Updates: Correction Deepens, Heed Stops
|
|
By:
Christopher Mistal
|
March 13, 2025
|
|
|
|
Tip for tap tariff policy has economic uncertainty swelling and the market retreating in a manner that some are already comparing to covid-19 and 2020. This seems like a reasonable comparison but now is not 2020. I believe many of the market’s current concerns could be alleviated, likely just as quickly as they arose with more clarity and perhaps a slower pace. When (could the correction end) and where (a possible S&P 500 level) are two questions we would like to have answers to as the S&P 500 slips deeper into correction territory.
Transforming the data into a chart showing the 30 trading days before and the 100 trading days after the inauguration dates in the blog table resulted in the following chart. Please note, there are an average of 21 trading days per month. In addition to the “All” line, we also separated out past Republicans and past Democrats. Performance has been adjusted to set zero on inauguration day. Trump 2.0 is the current S&P 500 performance as of today’s close, March 13. The weak market performance by Republicans in the chart below is consistent with post-election year performance by party found on page 28 of the 2025 Almanac.
![[30 Trading Days Before and 100 Trading Days After Chart]](/UploadedImage/AIN_0425_20250313_b4-after_inauguration_chart.jpg)
Trump 2.0 does appear to be tracking the Republican line fairly closely, although the magnitude of this year’s S&P 500 decline is greater. Should S&P 500 continue to track the historical Republican line, an initial low/bottom could occur in the second half of March with a potential retest in sometime possibly in early April. Then S&P 500 could begin to recover like it historically did under past Republican presidents.
![[S&P 500 Technical Chart]](/UploadedImage/AIN_0425_20250313_SPX_Support_900.jpg)
At what S&P 500 level? Since our
member’s only webinar on March 5, where Jeff spent time reviewing potential support levels, S&P 500 has plunged through its 200-day moving average and is effectively in no man’s land now just above 5500. This brings lower support levels into play. The next potential level is currently around 5475 and is based upon a trendline drawn from last April’s low through the August low. Below this level is the 5390 area in the vicinity of last September’s lows. At 5390, S&P 500 would be down 12.3% from its all-time closing high and just under its
historical average correction of 14.1% since 1948 during bull markets.
Stock Portfolio Updates
Over the past four weeks through yesterday’s close (March 12), S&P 500 declined 7.5% and Russell 2000 dropped 10.2% while the overall Almanac Investor Stock Portfolio slipped 2.7% lower excluding dividends, interest from cash holdings, and any trading fees. The timely closure of the Free Lunch portfolio boosted the portfolio’s cash balance that served to buffer against broad market declines. However all three subsections of the portfolio did decline. Large Caps retreated 8.2% while Mid Caps and Small Caps declined 13.3% and 11.2% respectively. Across the portfolio eight positions have been stopped out.
In the Small Cap section of the portfolio, Mama’s Creations (MAMA) was stopped out on February 24. MAMA had previously doubled, and the remaining half position was closed at $6.23 for a total gain of 86.8%. During its tenure in the portfolio MAMA was prone to wide swings but when combined with recent market volatility and broad market weakness the swings lower got even larger. MAMA is in the consumer staples sector but as a small, borderline micro-cap stock, it is not the best candidate to hold during uncertain times.
Healwell AI (HWAIF) has also continued to struggle in the current trading environment and was down 30.4% as of its March 12 close. HWAIF is what we call a “ground floor” opportunity stock. It is not suitable for everyone and if purchased, consider its position size relative to your overall portfolio. HWAIF is growing its revenues, and its combination of healthcare and AI are likely to remain in demand for the foreseeable future. HWAIF also appears to have found support just under $1 and can still be considered on dips below a buy limit of $0.99. Should the broad market stabilize, we suspect interest in HWAIF will also pick up once again.
Back in January we did not correctly update Skyward Specialty Insurance (SKWD) in the Mid Cap portfolio section. SKWD was stopped out on January 23 when it closed below its stop loss of $42.45 for a 38.5% gain. However, last month SKWD was listed as buy on dips with a buy limit of $48.70. Because of this we have added a new SKWD position dated February 13, 2025. SKWD is on Hold.
Amalgamated Financial (AMAL), Trinity Industries (TRN), and IES Holdings (IESC) were also disappointingly stopped out. All three had been modestly higher in January but began to rapidly weaken with the market in February. IESC’s association with struggling AI stocks also did not help.
Lastly, in the Large Cap section, Leonardo DRS (DRS), Sterling Infrastructure (STRL) and Comfort Systems (FIX) were also stopped out. We had raised the stop loss for DRS last update in case there was a retreat in defense stocks on any possible Ukraine/Russia cease fire or potential peace talks. STRL and FIX also got wrapped up in AI excitement and the sector’s recent cooling. Volatility was expected but its magnitude was amplified by growing economic uncertainty.
On a positive note, Garmin (GRMN) reported solid earnings in mid-February that pushed its shares to nearly $250 before it got pulled into the overall market’s downdraft. GRMN was hit today but support appears to be holding above $200. GRMN is on Hold.
Per last month’s update, all remaining open
Free Lunch positions were closed using their respective average daily prices on February 14. This sale proved timely as the market began to rollover shortly thereafter. It was a challenging year for the Free Lunch stocks. Typical small-cap outperformance in January failed to materialize and the Russell 2000’s struggles have only grown. Despite the challenges, several Free Lunch positions did manage to post double-digit returns and the top performing position,
Innovex International Inc (INVX), was closed out for a 30.1% gain.
All positions not previously mentioned are on hold. Please see the table below for current suggested stop losses.
Disclosure note: Officers of Hirsch Holdings Inc hold positions in AMAL, CUK, CXDO, GRMN, IBN, NECB, and OSIS in personal accounts.
|
S&P 500 Corrections & ETF Trades: Utilities on the Dip
|
|
By:
Christopher Mistal
|
March 06, 2025
|
|
|
|
For those who were unable to attend the member’s only webinar on Wednesday, the slides and video recording are available
here (or copy and paste in a new browser window:
https://www.stocktradersalmanac.com/LandingPages/webinar-archive.aspx). Jeff kicked off the webinar with a recap of recent market volatility and chop and how it is beginning to increase the odds of our
2025 Annual Forecast Worst Case Scenario. The current market pullback is no longer tracking the more bullish post-election year seasonal patterns. Instead, the market appears to be tacking toward a more challenging Republican post-election year (page 28 of 2025 STA).
The potential market correction (a decline of at least 10% from recent highs) that we have been warning of appears to be unfolding now and a more cautious stance is the prudent course of action. Inflation remains a concern, and the economy is flashing some warning signs. The jobs report scheduled to be released tomorrow (March 7) will provide the next reading on employment. The market may tolerate a softer than expected number as it could push the Fed to resume cutting rates sooner, but a significant miss would likely only further exacerbate numerous uncertainties.
Corrections, Bear Markets & Recessions
However, at this juncture we are not expecting a full-blown bear market. Market corrections do happen and on average since 1948, only one out of three corrections have become a bear market. The average duration of time between S&P 500 corrections has been 510 days. At S&P 500’s February 19, 2025, closing high, it had been 481 days since the last S&P 500 correction in 2023.
In the above table, we have included every S&P 500 bull market, bear market, correction and recession from 1948 to present. Recession dates are from the National Bureau of Economic Research except for 2022. A correction is defined as a decline of at least 10% but no more than 19.9% using the S&P 500’s most recent high close to its low. A bear market is any peak to trough decline that exceeded 20%.
Including the current bull market that began on October 12, 2022, for S&P 500, there have been 13 bull markets and 13 bear markets along with 26 previous corrections. The average correction had a 14.1% decline and took on average 132 calendar days. Bull markets average an impressive 177.4% gain over 1863 days. Based upon the average bull market, the current bull is still relatively young and if the current pullback becomes a correction (S&P 500 would need to close below 5529.73) this would be just its second which equals the average number of corrections per bull market.
Positive January/Negative February
At the end of every monthly webinar, we take questions from members and provide answers. Some questions require additional research and/or time to fully answer. One such question was the history of S&P 500 performance following a positive January and a negative February. We had previously presented the data of a positive January followed by a positive February in our
February 13 Issue with the conclusion that it was generally a positive for the next 10-months and full-year performance.
S&P 500 finished February down 1.42%, which does dampen the results when compared to the positive January and February data. In the table above, average full-year gains are cut from 20.45% to just 9.94% and the frequency of gains retreats from 96.9% to 71.4%. Overall, not great but not all that terrible. It is also notable that three of the last four previous post-election years (shaded), finished with a full-year gain. Only 2001 ended with a loss.
New March Sector Seasonalities
There are two sectors that begin their seasonally favorable periods in March: High-Tech and Utilities. As we detail in the Stock Trader’s Almanac 2025, on page 94 “Sector Seasonality”, we typically present the trade setups in advance of when the seasonality begins. This year we are going to focus on the Utilities sector as it has held up well during recent weakness and it also appears to be benefiting from the retreat in 10-year Treasury bond yields. Utilities are generally considered a defensive sector and are often a respectable performer during the “Worst Months,” May through October.
In the following weekly bar chart of the Utility Sector Index (UTY), seasonal strength (lower pane, shaded in yellow) typically begins following an early or mid-March bottom and usually lasts through early October although the bulk of the move is typically done sometime in late May or early June. Recent volatile trading has impacted the seasonal pattern in the lower pane of the chart. Typically, the pattern is less choppy as the sector does not usually experience major price swings in a year.
With over $17 billion in assets and ample average daily trading volume, SPDR Utilities (XLU) is our top choice once again to consider holding during Utilities’ seasonally favorable period. It has a gross expense ratio of just 0.08% and a relatively attractive yield of nearly 3%. Top five holdings include: NextEra Energy, Southern Co, Duke Energy, Constellation Energy, and American Electric Power.
XLU could be considered on dips with a buy limit of $74.75. This price is just above its low close in January. Based upon its 25-year average return of 8.16% (excluding dividends and trading fees) during its favorable period mid-March to the beginning of October, set an auto-sell price at $88.93. If purchased an initial stop loss of $65.97 is suggested.
Our favorite ETF to trade Infotech’s seasonal strength from mid-March through the beginning of July is iShares DJ US Tech (IYW). Our existing position was still up 5.9% as of the close on March 5. With tech still struggling to find firm footing, IYW is on Hold.
Sector Rotation ETF Portfolio Updates
Two sector seasonalities are scheduled to end during March. The first is a Computer Tech short trade. We passed on this trade setup earlier this year and do not have a corresponding position. The second sector is Biotech. Sell iShares Biotech (IBB). For tracking purposes, IBB will be closed out of the portfolio using its average price on Friday March 7.
Last month’s new trade idea, First Trust Natural Gas (FCG), was added to the portfolio on February 25 when it traded below its buy limit of $24.54. Shares have slipped lower even as natural gas prices have increased. Its decline is most likely because of the decline in crude oil prices and the overlap that exists within the portfolio of companies held in FCG. FCG is on Hold.
Four positions were stopped out over the last four weeks. iShares Bitcoin Trust (IBIT) was stopped out on February 26 resulting in a 10.3% gain. IBIT has rebounded since, but this trade was based upon a seasonal setup and we are going to move on and wait for the next seasonal setup, possibly sometime later this year in Q3 or early Q4.
iShares Semiconductor (SOXX) broke down and closed below its stop loss on February 27. We continued to hold SOXX past the end of its seasonally favorable period because of the resilience it was showing, holding support above its stop loss. Unfortunately, that did not work out to our advantage and a 13.4% loss resulted.
S&P Oil & Gas Equipment & Services (XES) was stopped out on March 3. The new administration is committed to lowering energy prices, and they have been declining. We are going to move on from XES. SPDR Energy (XLE) remains in the portfolio and is on Hold.
The most recent position to be stopped out was SPDR Consumer Discretionary (XLY) on March 4. Excluding any dividends or fees a modest 6.2% gain was logged. Lingering inflation has been a drag on the consumer, but it also appears that the rapid pace of change from the new administration is causing some concerns as well. Consumers appear to be pulling back on purchases and adding to savings. Until that trend reverses, consumer orientated stocks could continue to struggle.
On a positive note, December’s trade in United States Copper (CPER) exceeded expectations and traded above $29.94 on March 5 triggering an auto sell and locking in a 15.6% gain. CPER was slightly lower today but remains just under $30. If profits have not been made, it may be wise to consider doing so as recent market volatility could make them vanish quickly.
All other positions not previously mentioned are on Hold. Uncertainty is rising and the market is struggling. Historical Republican post-election year Q1 weakness is here. Caution is the prudent course.
Tactical Seasonal Switching Strategy ETF Portfolio Updates
As of today’s close all four positions in the Tactical Switching Strategy portfolio are in the red. As a reminder, positions in the Tactical Switching Strategy portfolio are intended to be held until we issue corresponding Seasonal MACD Sell Signals after April 1 for DJIA and S&P 500 and after June 1 for NASDAQ and Russell 2000. For this reason, there are no stop losses associated with these positions. QQQ, IWM, DIA, SPY are on Hold.
Disclosure note: Officers of Hirsch Holdings Inc held positions in COPX, FCG, IBB, IWM, QQQ, and SPY in personal accounts.