|
May 2018 Trading & Investment Strategy
|
|
By:
|
April 26, 2018
|
|
|
|
|
Market at a Glance
|
|
By:
Jeffrey A. Hirsch
|
April 26, 2018
|
|
|
|
4/25/2018:
Dow 24083.83 | S&P 2639.40 | NASDAQ 7003.74 | Russell 2K 1550.47 | NYSE 12517.86
| Value Line Arith 6067.60
Psychological: Woke. Market volatility this year
finally spooked the bulls a tad. Bullish sentiment is still elevated though. According
to Investor’s Intelligence Advisors
Sentiment survey bulls are at 48.0%, up from a more fearful low of 42.2% two weeks
ago. Correction advisors are down to 32.4% from a nearly 2-year high of 39.2%
two weeks ago. Bearish advisors have ticked up to 19.6%, a 6-month high.
Further declines in bullish sentiment would be a welcome sign as negative
sentiment is usually strongest near bottoms.
Fundamental: Firm. Unemployment remains low and
corporate earnings came in strong, but traders got frightened briefly by some
guidance that hinted at peak earnings. That remains to be seen. Q1 GDP
estimates have continued to cool and the Atlanta Fed GDPNow model is currently forecasting 2.0% for the quarter. Tariffs
have the potential to dampen global activity, but thus far it looks more like a
negotiating tactic rather than an actual major shift in policy. Numerous
exceptions have already been given for the steel and aluminum tariffs
mitigating their full impact and likely setting the precedent for any future
tariffs. Meanwhile Trump is sending his team of top economic advisors to China
for trade talks next week, including Mnuchin, Kudlow, Navarro and trade rep
Lighthizer… Stay tuned.
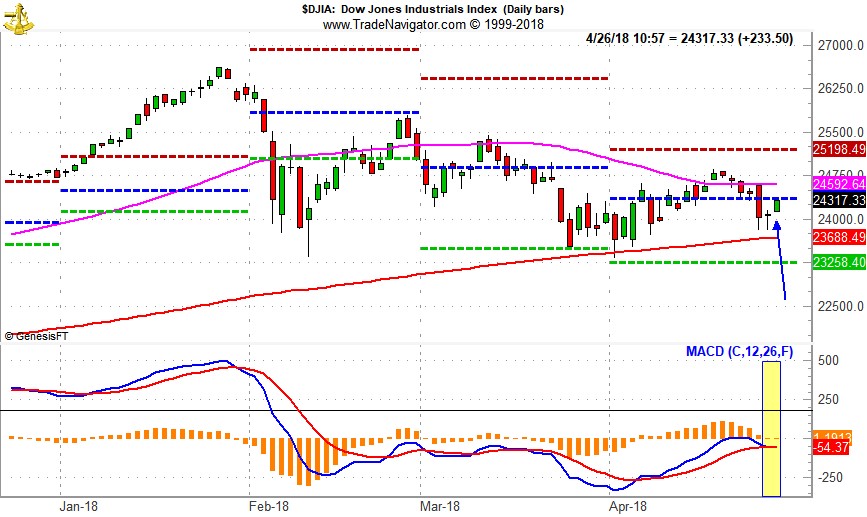
Technical:
Bouncing. Another selloff here in
April once again appears to have found support yesterday around 200-day moving
averages. S&P 500 was closest to its 200-day average. DJIA and NASDAQ
declines paused just above their respective 200-day averages. Stochastic
indicators are nearing a turn upwards in oversold territory. Relative strength
has recently begun to rise again and MACD indicators just held off a sell
signal and have turned higher again. If headline news risk abates and earnings
continue to come in strong and there is no more spooky guidance, this rally
could run higher into early- or mid-May before the worst six months kick in.
Monetary:
1.50-1.75%. The Fed did exactly
what was widely anticipated when its March meeting ended, they raised rates
0.25%. Rates are still expected to go higher later this year, but the Fed
remains data dependent. The pace of future increases will largely depend upon
inflation and growth data and expectations. Though the 10-Year bond yield’s
move slightly above 3% sent stocks reeling earlier this week, longer-term rates
are still low within a historical context. In the past, stocks
were able to rally in the face of rising rates and oil prices from late 1998
through early 2000, just before the dotcom bubble popped – think FAANG
stocks at present.
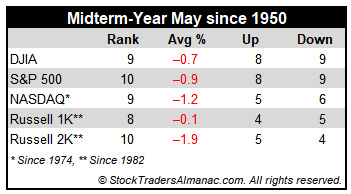
Seasonal: Bearish. May officially marks the
beginning of the “Worst Six Months” for the DJIA and S&P. To wit: “Sell in
May and go away.” May has been a tricky month over the years, a well-deserved
reputation following the May 6, 2010 “flash crash” and the old “May/June
disaster area” from 1965 to 1984. Since 1950, midterm-year Mays rank poorly, #9
DJIA and NASDAQ, #10 S&P 500 and Russell 2000, #8 for Russell 1000. Losses
range from 0.1% by Russell 1000 to 1.9% for Russell 2000. Since April 2 we have
been watching for the seasonal MACD sell signal. It has not yet triggered. When
it does, we will issue an email alert with trading ideas for weathering the
“Worst Six Months,” May to October.
|
May Outlook: Worst Six Months, Crueler In Midterm Years, Begins
|
|
By:
Jeffrey A. Hirsch
|
April 26, 2018
|
|
|
|
As the market is finally making rally attempt at the end of April, the last month of the Best Six Months” we are obligated to remind you that the “Worst Six Months” are now upon us, and as we pointed out last month this bearish seasonal stretch has been
more pronounced in midterm years.
For the near term over the next several weeks the rally may have some legs. But as we get into the summer doldrums and the midterm election campaign battlefront becomes more engaged, we expect the market to soften further during the weakest two quarter stretch in the 4-year cycle. However, this can set up a quintessential Midterm Election Year Bottom Picker’s Paradise.
While everything may seem extremely troublesome in the market right now, please remember that the Best Six Months still remain positive with the Dow and the S&P up about 4% since the close of October 2017 and we still have the positive January Indicator Trifecta. When the Worst Six Months get underway and after we issue our Sell Signal we will prepare you and help you position your portfolio to weather the weak patch and prepare for the next buying opportunity.
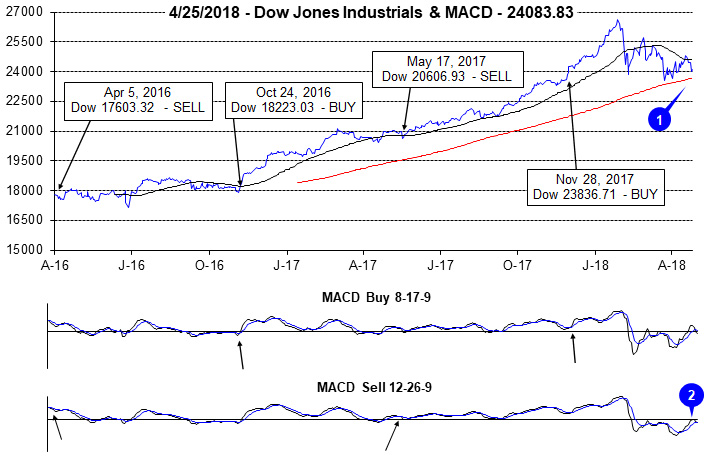
Best Six Months MACD Sell Signal Update
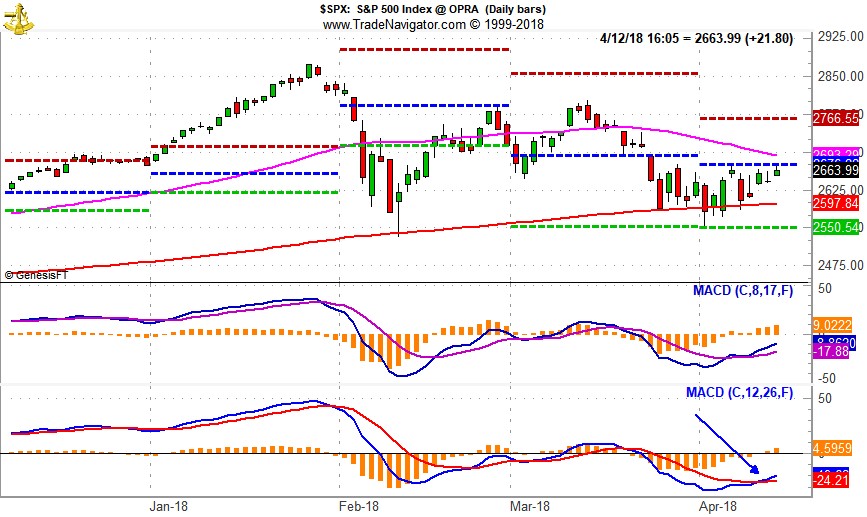
There has
NOT been a Sell Signal yet. Tuesday’s selloff did cause some damage but the S&P Sell MACD indicator stayed positive and today rally firmed it up further. We will issue our Seasonal MACD Sell signal when corresponding MACD “sell” indicators applied to DJIA and S&P 500 both crossover and issue a new sell signals. At this juncture the market is poised for a bounce and rally, so for now
continue to hold long positions associated with DJIA’s and S&P 500’s “Best Six Months.”
When both the DJIA and S&P 500 MACD Sell indicators trigger a sell signal, we will issue an Almanac Investor Alert. We will either outright sell specific positions or implement tight trailing stop losses. Bearish/defensive positions in: iShares 7-10 Year Treasury (IEF), iShares 20+ Year Treasury (TLT), SPDR Gold (GLD), ProShares Short Dow 30 (DOG), ProShares Short S&P 500 (SH) and/or other protective strategies may also be considered. All stock and ETF holdings will be evaluated at that time. ETFs providing exposure to sector seasonalities ending in May and June along with underperforming stocks in the Almanac Investor Stock Portfolio may be sold at that time as well.
Pulse of the Market
Historical precedents held true this April with weaker performance in the midterm year than all years. But all things considered in the new normal volatility, stocks held up rather well in the face of the tumultuous geopolitical and financial news flow. DJIA once again found support just above its 200-day moving average (1). The big decline last this past Tuesday pushed both the faster and slower moving MACD indicators applied to DJIA into marginally negative territory (2). This brought us to the brink of a Best Six Months MACD Seasonal Sell Signal, but the S&P 500 MACD Sell Indicator remained positive.
The Down Friday, Down Monday registered this week (3) preceded the big selloff Tuesday which ended up so far as a turning point. It’s as if traders knew that the peak earnings fears would come to a head Tuesday. S&P 500 (4) and NASDAQ (5) managed to put up a modest gain last week along with DJIA, indicating some broad-based strength. Today’s rally trimmed this week’s losses and follow through tomorrow bring the week into the plus column and posting a gain on a Friday would be near-term bullish.
NYSE Weekly Advancers outnumbered Weekly Decliners (6) by 1.5 to 1. Not super impressive, but any positive breadth is encouraging. We’ll need to see improvement in market breadth for any rally to gain traction.
New Highs and New Lows (7) were also very tight last week, nearly dead even. More highs than lows are positive as is the slight trend up in new highs, but lows are also on the rise. Market internals are really not that encouraging right now and if we do not seem improvement here than the market is more likely to succumb to headline risk and seasonal weakness.
After peaking in late February, the yield on the 30-year Treasury bond meandered lower, but began to rise again last week (8). The resumption in the rise in rates is likely a reflection of the steady, but decelerating growth in the economy and corporate America, modest pace of rising inflation and measured pace or rate increases by the Fed.
Click image to view full size…
|
May Almanac: Start of “Worst Six Months” for DJIA and S&P 500
|
|
By:
Jeffrey A. Hirsch & Christopher Mistal
|
April 19, 2018
|
|
|
|
May officially marks the beginning of the “Worst Six Months” for the DJIA and S&P. To wit: “Sell in May and go away.” Our “Best Six Months Switching Strategy,” created in 1986, proves that there is merit to this old trader’s tale. A hypothetical $10,000 investment in the DJIA compounded to $975,223 for November-April in 67 years compared to $116 loss for May-October. The same hypothetical $10,000 investment in the S&P 500 compounded to $705,504 for November-April in 67 years compared to a gain of just $8,615 for May-October.
May has been a tricky month over the years, a well-deserved reputation following the May 6, 2010 “flash crash”. It used to be part of what we called the “May/June disaster area.” From 1965 to 1984 the S&P 500 was down during May fifteen out of twenty times. Then from 1985 through 1997 May was the best month, gaining ground every single year (13 straight gains) on the S&P, up 3.3% on average with the DJIA falling once and two NASDAQ losses.
In the years since 1997, May’s performance has been erratic; DJIA up ten times in the past twenty years (three of the years had gains in excess of 4%). NASDAQ suffered five May losses in a row from 1998-2001, down – 11.9% in 2000, followed by eleven sizable gains in excess of 2.5% and four losses, the worst of which was 8.3% in 2010. Since 1950, midterm-year Mays rank poorly, #9 DJIA and NASDAQ, #10 S&P 500 and Russell 2000, #8 for Russell 1000. Losses range from 0.1% by Russell 1000 to 1.9% for Russell 2000.
Based upon the S&P 500, Monday before May option expiration is much stronger than expiration day itself albeit weaker for small caps. Big caps have registered seven losses in the last twenty-eight years on Monday. Expiration day is a loser nearly across the board; Russell 2000 posts a marginal average gain. The full week had a bullish bias that has faded in recent years. The week after options expiration week now favors tech and small caps. DJIA has fallen in eleven of the last nineteen weeks after.
On Friday before Mother’s Day the DJIA has gained ground fifteen of the last twenty-three years and on the Monday after (the first day of options expiration this year), the blue-chip average has risen in fifteen of those years.
The first two days of May trade higher frequently and the S&P 500 has been up 20 of the last 28 first trading days. A bout of weakness often appears on the third, fourth, eleventh, fourteenth, and twenty-second and sixteenth trading days for large cap stocks but the middle of the month tends to be better.
The Friday before Memorial Day tends to exhibit light, lackluster trading as folks escape early for the summer kickoff weekend with the Dow down 10 of the last 18 years, averaging a minor loss of 0.2%. On the Tuesday after Memorial Day the Dow has been up 21 of the last 32 with an average gain of 0.4%. During the shortened Memorial Day Week the Dow has been down 13 of the last 22, but was up 12 straight from 1984-1995.
| May (1950-2017) |
| |
DJI |
SP500 |
NASDAQ |
Russell
1K |
Russell 2K |
| Rank |
|
9 |
|
8 |
|
5 |
|
6 |
|
6 |
| #
Up |
|
36 |
|
40 |
|
29 |
|
27 |
|
25 |
| #
Down |
|
32 |
|
28 |
|
18 |
|
12 |
|
14 |
| Average
% |
|
-0.02 |
|
0.2 |
|
1.0 |
|
1.0 |
|
1.3 |
| 4-Year Presidential Election Cycle Performance
by % |
| Post-Election |
|
1.3 |
|
1.7 |
|
3.4 |
|
3.0 |
|
3.9 |
| Mid-Term |
|
-0.7 |
|
-0.9 |
|
-1.2 |
|
-0.1 |
|
-1.9 |
| Pre-Election |
|
0.1 |
|
0.2 |
|
1.9 |
|
1.2 |
|
2.7 |
| Election |
|
-0.7 |
|
-0.1 |
|
-0.3 |
|
-0.3 |
|
0.1 |
| Best & Worst May by % |
| Best |
1990 |
8.3 |
1990 |
9.2 |
1997 |
11.1 |
1990 |
8.9 |
1997 |
11.0 |
| Worst |
2010 |
-7.9 |
1962 |
-8.6 |
2000 |
-11.9 |
2010 |
-8.1 |
2010 |
-7.7 |
| May Weeks by % |
| Best |
5/29/70 |
5.8 |
5/2/97 |
6.2 |
5/17/02 |
8.8 |
5/2/97 |
6.4 |
5/14/10 |
6.3 |
| Worst |
5/25/62 |
-6.0 |
5/25/62 |
-6.8 |
5/7/2010 |
-8.0 |
5/7/10 |
-6.6 |
5/7/10 |
-8.9 |
| May Days by % |
| Best |
5/27/70 |
5.1 |
5/27/70 |
5.0 |
5/30/00 |
7.9 |
5/10/10 |
4.4 |
5/10/10 |
5.6 |
| Worst |
5/28/62 |
-5.7 |
5/28/62 |
-6.7 |
5/23/00 |
-5.9 |
50/20/10 |
-3.9 |
5/20/10 |
-5.1 |
| First Trading Day of Expiration Week: 1990-2017 |
| #Up-#Down |
|
21-7 |
|
21-7 |
|
18-10 |
|
20-8 |
|
16-12 |
| Streak |
|
U2 |
|
U2 |
|
U2 |
|
U2 |
|
U4 |
| Avg
% |
|
0.4 |
|
0.4 |
|
0.4 |
|
0.3 |
|
0.2 |
| Options Expiration Day: 1990-2017 |
| #Up-#Down |
|
14-14 |
|
15-13 |
|
14-14 |
|
15-13 |
|
13-15 |
| Streak |
|
U5 |
|
U5 |
|
U2 |
|
U5 |
|
U2 |
| Avg
% |
|
-0.1 |
|
-0.2 |
|
-0.1 |
|
-0.1 |
|
0.02 |
| Options Expiration Week: 1990-2017 |
| #Up-#Down |
|
15-13 |
|
15-13 |
|
16-12 |
|
14-14 |
|
16-12 |
| Streak |
|
D2 |
|
D1 |
|
D1 |
|
D1 |
|
D1 |
| Avg
% |
|
0.3 |
|
0.2 |
|
0.4 |
|
0.2 |
|
-0.1 |
| Week After Options Expiration: 1990-2017 |
| #Up-#Down |
|
16-12 |
|
18-10 |
|
19-9 |
|
18-10 |
|
22-6 |
| Streak |
|
U2 |
|
U4 |
|
U4 |
|
U4 |
|
U4 |
| Avg
% |
|
-0.05 |
|
0.2 |
|
0.4 |
|
0.3 |
|
0.5 |
| May 2018 Bullish Days: Data 1997-2017 |
| |
1,
2, 8, 10 |
1,
15, 25 |
1,
2, 8, 21 |
1,
15, 25 |
1, 2, 29, 30 |
| |
|
|
29,
30 |
|
|
| May 2018 Bearish Days: Data 1997-2017 |
| |
3,
4, 11, 18, 22 |
3,
4, 11, 14 |
3,
18 |
3,
4, 11, 14, 18 |
3, 11, 14 |
| |
|
18,
22 |
|
|
|
|
May 2018 Strategy Calendar
|
|
By:
Christopher Mistal
|
April 19, 2018
|
|
|
|
|
Seasonal MACD & Stock Portfolio Updates: Market Wavers, But Indicators Remain Positive
|
|
By:
Christopher Mistal
|
April 19, 2018
|
|
|
|
Seasonal MACD Update
As of the today’s close, the slower moving MACD “Sell” indicator (at bottom of following charts highlighted in yellow box) applied to DJIA and S&P 500 were positive and trending higher. Combined with improvements in other technical indicators this is an encouraging sign that suggests additional gains are possible. Today was also the third straight day that DJIA and S&P 500 closed above their respective 50-day moving averages which is also supportive of the case for further market gains in the near-term.
Continue to hold long positions associated with DJIA’s and S&P 500’s “Best Six Months.” We will issue our Seasonal MACD Sell signal when corresponding MACD Sell indicators applied to DJIA and S&P 500 both crossover and issue a new sell signal.
Stock Portfolio Updates
Over the last four weeks, S&P 500 was down 0.1% and Russell 2000 was higher by 0.3% as of yesterday’s close. The Almanac Investor Stock Portfolio’s blend of cash and long positions slipped 1.3% over the same time period excluding dividends and any trading costs. Our Mid-Cap portfolio was the worst performer down 3.9%. Small-Caps were best, but still edged 0.2% lower.
Overall, the top performers in the portfolio continue to lead or at worst move sideways. Global Brass and Copper Holdings (BRSS) is one such position that was little changed over the last month. Large-cap holding, Unitedhealth (UNH) however enjoyed a modest move higher and is the best performing position in the portfolio.
Other positions such as Patrick Industries (PATK) did not fare as well. PATK was stopped out on April 17 when shares sank below the stop loss. Shares were above $67 four weeks ago and have been steadily declining since.
Shares of Synnex Corp (SNX) were stopped out on April 2 when it plunged below its stop loss due to a disappointing earnings report that showed over a 60% decline in earnings. The position in SNX was closed out of the portfolio using its average price on April 3.
Last month’s Seasonal Sector Trades idea, Hershey Company (HSY) was added to the portfolio on March 21 when it traded below its buy limit of $98.75. For a handful of days in late March HSY was a profitable position, but it has slipped lower and closed below its stop loss of $94.50 today. HSY will be closed out of the portfolio using its average price from tomorrow in the next update.
With the “Best Six Months” end on the horizon, all positions in the Stock Portfolio are on hold. Please see following table for current advice, buy limits and stop losses.
Disclosure Note: At press time, officers of the Hirsch Organization, or accounts they control held positions in BUSE, FAF, G, HII, LII, MHO, ORBK and SNX. They did not hold any positions in the other stocks mentioned in this Alert, but may buy or sell at any time.
|
Seasonal MACD Update & Seasonal Sector Trades: 30-year Bond Summer Rally
|
|
By:
Jeffrey A. Hirsch & Christopher Mistal
|
April 12, 2018
|
|
|
|
Seasonal MACD Update
As of the today’s close, both the faster moving MACD “Buy” and slower moving MACD “Sell” indicators (at bottom of following charts) applied to DJIA and S&P 500 were positive and trending higher. Combined with improvements in other technical indicators this is an encouraging sign that suggests further gains are possible. The path higher is likely to remain choppy as DJIA and S&P 500 are once again sensitive to breaking news headlines. First quarter earnings season is underway and solid, positive reports could send the market higher by providing a welcome distraction to headlines.
Continue to hold long positions associated with DJIA’s and S&P 500’s “Best Six Months.” We will issue our Seasonal MACD Sell signal when corresponding MACD Sell indicators applied to DJIA and S&P 500 both crossover and issue a new sell signal.
30-year Treasury Bond Late-April Rally
The long bond tends to bottom sometime during Q2, typically around the time the stock market reaches its highs, and then enjoys a solid run of strength into Q3 and beyond in some years. Note seasonal strength shaded in yellow in chart below. Bonds are also a relatively safe place to park capital during the “Worst Six Months” of the year, May through October.
When investors and/or traders feel threatened with a potential decline in the stock market, they often allocate more money into bonds. This is often referred to as the “flight to safety” trade. Investors and traders will also allocate more money to bonds when they believe the yield is more attractive than other shorter-term investment options.
By going long, the September 30-year Treasury bond on or about April 25, and exiting the position on or about August 20, we discovered in the last 40 years a respectable 70.0% success rate. This trade has a history of 28 wins with 12 losses; the largest win was $20,250 in 2011, and the largest loss was $17,031 in 2013. The trade’s track record over the last 29 years (shaded in grey in table below) is even better with 22 gains and a success rate of 75.9%.
Although the specter of additional Fed interest rate hikes loom large, this trade will likely still perform this year as our bond yields remain attractive to foreign buyers. Our 30-year Treasury bond yielding around 3.0% does compare quite favorable to Germany’s 1.18% or Japan’s 0.70%. Growth and inflation expectations also remain on the comfortable side so even if short-term rates increase due to Fed action, long-term rates may not necessarily rise
Stock traders may consider the exchange-traded fund, iShares 20+ Year Bond (TLT), as a replacement for the futures contract. TLT has a little more than $7 billion in assets, typically trades more than 8 million shares per day and has a reasonably deep and liquid options chain available. TLT’s expense ratio of just 0.15% is very reasonable and its current yield just over 3% is also attractive.
Stochastic, MACD and relative strength indicators applied to TLT have improved substantially since mid-March, but have begun to turn less positive. Should equity markets strengthen as they usually do in April, TLT would be attractive on dips below $118.75. If TLT trades below this buy limit, before we issue our MACD Seasonal Sell Alert, It will be added to the Almanac Investor ETF Portfolio. Alternatively, TLT trade execution could be postponed until when we issue our MACD Seasonal Sell Signal Alert.
|
ETF Trades & Seasonal MACD Update: Holding On During the Bounce
|
|
By:
Christopher Mistal
|
April 05, 2018
|
|
|
|
Seasonal MACD Update
April, the last month of DJIA and S&P 500 “Best Six Months,” began with a shellacking, but broad weakness existed long before the first trading day. Both the faster and slower MACD indicators applied to DJIA and S&P 500 turned negative in mid-March. As of today, the faster moving MACD indicator applied to DJIA and S&P 500 is positive (see red arrows in charts below). Even DJIA’s slower moving MACD indicator is positive (blue arrow). S&P 500’s slower moving indicator (blue arrow) is on the verge of a positive crossover. These positive MACD crossovers are confirmation of recent market strength and a possible shift in momentum toward further gains.
Continue to hold long positions associated with DJIA’s and S&P 500’s “Best Six Months.” We will issue our Seasonal MACD Sell signal when corresponding MACD Sell indicators applied to DJIA and S&P 500 both crossover and issue a new sell signal.
May Sector Seasonalities
Three sectors begin seasonally weak periods in May: Banking, Gold & Silver (stocks) and Materials. Over the past 15 years, all three sectors have declined on average 5.1 to 7.9% which sets them up as a reasonably good short trade candidates during the spring and early summer months. Although not published in the Stock Trader’s Almanac 2018 on page 92, Transports also exhibit seasonal weakness from early May through late June with an average loss of 5.7% over the past 15 years.
Typically we like to take advantage of sector weakness through the use of inverse or bearish ETFs. By doing so, the trade is similar to any other long trade that we choose to execute. One of the drawbacks of inverse ETFs is they frequently employ leverage and only track the daily performance of the underlying benchmark. As holding periods get longer, these types of funds often exhibit performance that differs significantly from the underlying security or index’s performance due to compounding and tracking errors. Three out of today’s four new trade ideas are going to be outright short trades. An “(S)” follows each ETF name in the portfolio table to denote it is a short trade. Only in the case of Gold & Silver will we use a leveraged inverse fund as its seasonally weak period is only about six weeks long.
Because there is a corresponding long position in the banking sector (XLF) already in the portfolio, we will look to short this sector at resistance or when we issue our Seasonal MACD Sell Signal Alert. If the short trade in XLF hits its execution price before our Seasonal MACD Sell Signal, the corresponding long position could be sold prior to implementing a short position.
![[SPDR Financial (XLF) Daily Bar Chart]](/UploadedImage/AIN_0518_20180405_XLF.jpg)
SPDR Financial (XLF) could be shorted just above resistance at $29.26. After peaking with the broad market in late January, XLF has been under pressure since. It has slipped below its 50-day moving average and Stochastics, relative strength and MACD are all weak. However, Q1 earnings reports do have the potential to trigger a bounce higher. If shorted, set an initial stop loss at $30.30. The Fed appears to be on a prolonged and steady tightening cycle that is actually flattening the yield curve as longer-term growth and inflation expectations appear to be keeping the long end of the Treasury yield curve well anchored. This flatter curve could squeeze profits.
![[iShares DJ Transports (IYT) Daily Bar Chart]](/UploadedImage/AIN_0518_20180405_IYT.jpg)
iShares DJ Transports (IYT) could be shorted on a rally toward resistance around $194.63. Stochastics, MACD and relative strength are currently mixed. Relative strength is neutral; Stochastics are improving and MACD is on the cusp of a positive “buy” crossover. IYT could easily bounce or just fall apart. Crude oil’s price could provide an early indication of which way it may be. The initial stop loss is $200.00. Proposed tariffs have the potential to trigger even more tariffs and possibly a full-blown trade war. Trade and growth would likely suffer and transports would likely be the first to suffer the negative impacts.
![[Direxion Daily Jr Gold Miners Bear 3X (JDST) Daily Bar Chart]](/UploadedImage/AIN_0518_20180405_JDST.jpg)
Direxion Daily Jr Gold Miners Bear 3X (JDST) can be bought on dips below $50.10. JDST is volatile due to its 3x leverage and frequently trades in a wide daily range. If purchased set an initial stop loss at $44.10. Consider taking profits on any jump above $75.00. Interest rates are rising and gold has struggled to trade above $1350 per ounce going all the way back to 2013. Even during recent market volatility $1350 has not held.
SPDR Materials (XLB) could be shorted on a rally back toward resistance near $60.40. XLB had enjoyed a solid rally with the rest of the market right up until the end of January. Since then, it has been lower, sideways and lower again. It’s Stochastic, MACD and relative strength indicators are beginning to improve. A rally back near resistance would likely make a great entry point for a new short position. A stop loss at $64.10 is suggested.
ETF Portfolio Updates
Following a challenging February, March saw little improvement as DJIA, S&P 500 and NASDAQ all finished the month lower. Somewhat encouraging was a 1.1% gain by the Russell 2000. This pattern of broad weakness is prevalent throughout the ETF Portfolio with many positions edging lower and three being stopped out. iShares Russell 2000 (IWM) was the only position that gained ground in March, improving from down 2.5% to down just 0.8%.
SPDR Materials (XLB) and SPDR Consumer Staples (XLP) were two of the positions stopped out in March. XLB lost ground as fear that proposed tariffs could dampen global growth and demand. Large-cap, multi-national corporations that comprise XLP’s top holdings were also sold-off for similar reasons. These fears also resulted in gold rising which in turn caused DB Gold Double Short (DZZ) to decline and close under its stop loss.
However, all of March’s weakness did offer an opportunity to add SPDR Utilities (XLU) to the portfolio on multiple trading days throughout the month. The first opportunity was the day after it was presented when it opened below its buy limit of $49.20 and was added to the portfolio using its average price of $49.03 on March 2. At yesterday’s close XLU was up 2.5%.
April is typically a top performing month of the year. It has been up 12 straight years in a row. It is the first month of a quarter and it also hosts the first earnings announcements for the New Year. But, it is also the last month of the “Best Six Months” for DJIA and S&P 500. With this in mind, we maintain a long bias in the ETF Portfolio with a watchful eye on technical indicators. When we issue our Seasonal MACD Sell Signal Alert, we will reduce long exposure and look to execute the best setup short-trade ideas at that time. Until then, all long positions remain on hold. Please see table below for current stop losses and advice.
Disclosure Note: At press time, officers of the Hirsch Organization, or accounts they control held positions in IWM, QQQ, XLP and XLV.