|
Market at a Glance - 4/30/2020
|
|
By:
Christopher Mistal
|
April 30, 2020
|
|
|
|
4/30/2020: Dow 24345.72 | S&P 2912.43 | NASDAQ 8889.55 | Russell 2K 1310.66 | NYSE 11372.34 | Value Line Arith 5383.99
Fundamental: Ambiguous. Despite the market’s recovery rally, uncertainty remains elevated. Social distancing does appear to have slowed the spread of the coronavirus and the focus has shifted to crafting a plan for returning to “normal.” Economic data, from early in the shutdown is already horrendous while the nearest data point to giving a real-time read on the U.S. economy, unemployment claims are astronomically high with over 30 million people filing already. It seems increasingly likely that the path back to a fully functioning economy may take much longer than it will take to draft re-opening plans.
Technical: Overextended? Unprecedented times call for unprecedented action by the Fed and government at all levels which appears to be supporting an unprecedented market rally. NASDAQ held up best in February and March and is nearly back to breakeven for the year. DJIA and S&P 500 experienced deeper retreats but have also enjoyed a robust recovery rally so far. NASDAQ has rebounded back above its 50- and 200-day moving averages while DJIA and S&P 500 have reclaimed their respective 50-day moving averages. Technical indicators are getting stretched to the upside and at some point, a pause and/or pullback is likely.
Monetary: 0 – 0.25%. The Fed is “all in” and further confirmed its commitment to use “its full range of tools to support the U.S. economy” after its scheduled meeting this week. Trillions have been pledged and are being spent to support the economy. Will this be sufficient? Only time will tell, and history suggests the Fed is probably not done yet.
Seasonal: Neutral. May is the first month of DJIA and S&P 500 “Worst Six Months,” but NASDAQ’s “Best Eight Months” continues until June. Our Seasonal MACD Sell signal has not triggered yet suggesting the rally could continue in the near-term. The history of “Worst Six Months” after a bad “Best Months” is not encouraging. This year’s negative January Barometer and breached December DJIA low, point to possible retest of lows and choppy, volatile trading could occur during the upcoming “Worst Months.”
Psychological: Improving. According to
Investor’s Intelligence Advisors Sentiment survey Bullish advisors are up to 46.6%. Correction advisors have edged lower and stand at 24.3% while Bearish advisors have slipped to 29.1%. The improvement is sentiment is likely tied to the rebound in the market along with looking beyond the next couple of quarters of data and into next year and beyond, where hopefully the pandemic will be over, and economies will be back to “normal.”
|
May Outlook: Down Best Six Months Warning Sign
|
|
By:
Jeffrey A. Hirsch & Christopher Mistal
|
April 30, 2020
|
|
|
|
Despite the selloff on the last day of April, the Best Six Months has ended on a positive note, registering the best month in decades and the best April since the Great Depression. We have been tracking our Seasonal Best Six Months MACD Sell Signal for DJIA and S&P 500 since April 1 (NASDAQ’s Best 8 Months ends in June). The slower MACD 12-26-9 Sell indicator turned positive March 26 and remains in an uptrend and has not issued a new sell signal yet. At this point it would still take a one-day drop of 10% to trigger.
The massive rally has surely been impressive and a welcome change from the carnage we experienced in February and March. April 2020 has been the best month since January 1987 for DJIA and S&P 500 and the best April since 1938. January 1987 was several months before the August top and October crash. April 1938 came right on the heels of the March 31, 1938 bear market low.
But April’s huge move was still not enough to put the Best Six Months (November-April) in the black and that concerns us. DJIA was down 10.0% for this Best Six Months period that ended today and S&P 500 lost 4.1%. When the market is down during the “Best Six Months” it’s an indication that there are more powerful forces than seasonality at work and when the bullish season is over those forces may really have their say.
Here is the updated table of Down Best Six Month for DJIA since 1950. Clearly, the market performed poorly in most of these years after a down BSM, except for 2009 and 1982. Following the first back-to-back down Best Six Months since 1973-1974, the market hit a secular bear market low in March 2009. The market made a similar secular bear market bottom in August 1982 that began in 1966 and this came after the infamous 1980s double dip recession. Our concern here is that this time around we’ve only just begun.
Other seasonal indicators are also flashing the caution sign. We have updated the composite graph of the seasonal pattern for the 22 years since 1950 (NASDAQ 14 years since 1971) when both the
January Barometer as measured by the S&P 500 were down and the Dow closed below its previous December closing low in the first quarter. We have added 2020 for clarity.
Comparing 2020 market action to these 22/14 years, suggests a choppy year ahead with the potential for several tests of the recent lows. You can see now how market action in 2020 has reverted to the mean of this pattern, suggesting that we are in for some tough sledding in the market this year with quite a bit of chop, sideways action through the Worst Six Months (May-October) and some likely retests of the March lows.
However, we expect those lows to hold. Initial Weekly Jobless Claims have reached incredulous levels, levels never seen before since this indicator began in 1967. The number of people filing for unemployment has surpassed anything we have seen and already dwarfed the 2007-2009 Great Recession. But, the trend is improving and this is one metric we have always found useful in identifying bear market lows. If the trend continues, Initial Claims appear to have peaked already.
In the chart we have omitted Initial Claims of 3.3 million, 6.9 million, 6.6 million, 5.2 million, 4.4 million and 3.8 million the past six weeks as they would literally be off the chart. Also we have plotted DJIA on a logarithmic scale so that the highs and lows of the past would be discernible. All the bear market lows for DJIA associated with a recession line up quite well with the spike peaks of Weekly Initial Jobless Claims.
Bear markets like 1987, which was a computer driven crash, were not accompanied by recession or an increase in Jobless Claims. But all the big bear market lows of 1970, 1974, 1982, 1990, 2001 and 2009 were marked by the peak of Jobless Claims. So keep your eye on Jobless Claims for continuing confirmation that the low is in.
It sure feels like the bottom is in, but the bad Best Six Months and the Down January Barometer/DJIA December Closing Low breach suggests we are not completely out of the woods yet. Even if March 23 turns out to be the ultimate low (and it does look like it) that does not mean the next six months or more are going to be pure rally to new highs. In fact new highs are not likely for quite some time and we will likely retest the lows.
Though recession is not yet confirmed, it is likely a foregone conclusion. We have not yet seen the impact in the economic data. It is just starting to come in. 2020 Q1 Advance GDP came in at -4.8%. This is only half the 2008-2009 low and this is just the beginning. Jobless claims the past six weeks are more than triple the job losses in the Great Recession.
How long will Vegas Casinos remain closed? How long will arenas and stadiums be empty? No one knows. There are some promising vaccines and treatments in the works and states are beginning to reopen, but there is no way of knowing when our lives and economy will return to some semblance of normal. So our outlook remains cautious for the Worst Six Months and our portfolios have been rebuilt for that.
Pulse of the Market
DJIA’s recovery from its March low has continued into April (1) in grand fashion. Even with today’s mild retreat this April will be DJIA’s best April since 1938 when DJIA gained 12.46%. April is DJIA’s best month since 1950 and this year it has certainly retained and reinforced the top honor. Bullishly, DJIA has reclaimed its rapidly falling 50-day moving average however; its 200-day moving average could eventually prove to be resistance.
DJIA’s rapid rebound has reversed the negative MACD indicator trends that persisted on the charts from late February through late March. Both the faster and slower moving MACD indicators crossed over to new buy signals near the end of March and have remained positive and trending higher since then. Last week’s mild decline and this week’s modest gains have MACD slowing and drifting towards a new crossover (2).
Although it may be a bit early to call it a trend, three consecutive positive Fridays (or last trading day of the week (3) is worth noting as Friday had been a loser throughout all of January, February and March with just two exceptions. Strength on Friday, again, is encouraging as it suggests traders and investors are regaining enough confidence to hold positions over the weekend.
Uncertainty remains elevated, but optimism appears to be on the rise as the market continues to climb the wall of worry higher. For the most part, the rebound off of March lows has been essentially straight up, DJIA, S&P 500 (4) and NASDAQ (5) have paused during the rebound with two mild weekly losses of the last five weeks for each index. Most likely the market will continue to trade choppily. At least until there is some clear end to the virus in sight.
Market breadth measured by NYSE Weekly Advancers and NYSE Weekly Decliners (6) reached extreme bullish levels during the week ending April 10. To find a higher number of Weekly Advancers you have to go back to the week that spanned the end of 2012 and the beginning of 2013 when there were 3011. Unfortunately, that strong reading three weeks ago was not followed by solid numbers of Weekly Advancers in the weeks since. Mixed weekly readings could be the norm until more of the economy reopens.
Weekly New Highs remain nearly nonexistent (7) however; Weekly New Lows have also subsided significantly over the last five weeks. As long as the market trades in the middle ground between its recent lows and its recent highs, substantial numbers of New Weekly Highs and Lows are not as likely.
Near the end of March the 90-day Treasury rate (weekly) was negative (8) for the first time ever. U.S. central bankers appear to want to avoid negative rates, but with negative rates in parts of Europe and in Japan, it could only be a matter of time before negative rates become a reality in the U.S. Consequences of negative rates are still somewhat unknown although they do not appear to be working all that well elsewhere.
Click for larger graphic…
|
Seasonal MACD Update: Rally Stalling
|
|
By:
Christopher Mistal
|
April 23, 2020
|
|
|
|
Seasonal MACD Update
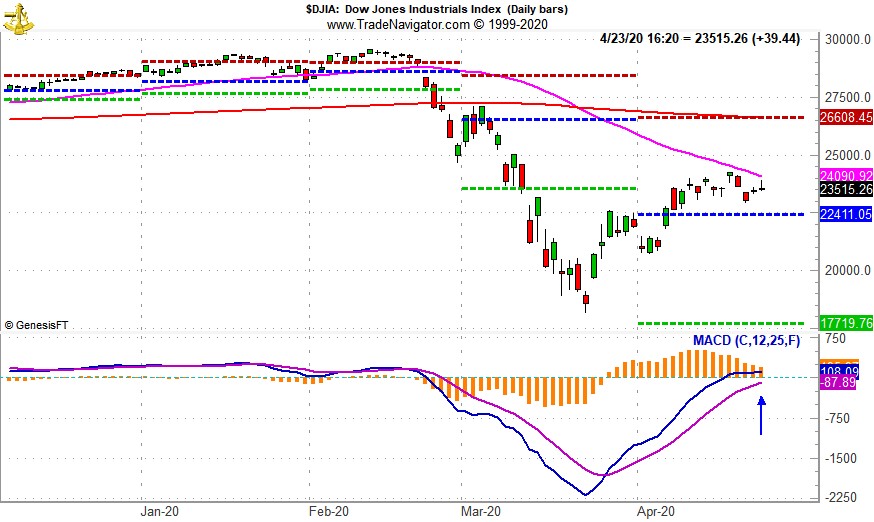
As of yesterday’s close, DJIA and S&P 500 have edged slightly lower compared to last update. DJIA is now up 7.3% so far this April which is a retreat of 0.1% since last Thursday. S&P 500 is also 0.1% lower now than one week ago at 8.2%. Thus no progress has been made at returning the current “Best Six Months” to positive territory. NASDAQ has also slipped modestly lower of the last five trading days. This pause is not entirely unexpected as the rally off of March’s lows has been robust and data and forecasts are only beginning to catch up and reflect the impact of the coronavirus.
![[S&P 500 Daily Bar Chart]](/UploadedImage/AIN_0520_20200423_MACD_SP500.jpg)
The rally has stalled out this week and MACD is still positive but is now trending toward a negative crossover (indicated by the blue arrows highlighting the falling daily bars). Continue to hold long positions associated with DJIA’s and S&P 500’s “Best Six Months.” We will issue our Seasonal MACD Sell signal when corresponding MACD Sell indicators applied to DJIA and S&P 500 both crossover and issue a new sell signal.
Although MACD’s trend has changed, as of today’s close it would still take a single-day decline of nearly 12% (this is not a typo) by DJIA and S&P 500 to turn MACD negative.
|
May Almanac: Weaker in Election Years
|
|
By:
Jeffrey A. Hirsch & Christopher Mistal
|
April 23, 2020
|
|
|
|
May officially marks the beginning of the “Worst Six Months” for the DJIA and S&P. To wit: “Sell in May and go away.” Our “Best Six Months Switching Strategy,” created in 1986, proves that there is merit to this old trader’s tale. A hypothetical $10,000 investment in the DJIA compounded to a gain of $1,068,826 for November-April in 69 years compared to just $1,461 for May-October. The same hypothetical $10,000 investment in the S&P 500 compounded to $823,326 for November-April in 69 years compared to a gain of just $9,537 for May-October.
May has been a tricky month over the years, a well-deserved reputation following the May 6, 2010 “flash crash”. It used to be part of what we called the “May/June disaster area.” From 1965 to 1984 the S&P 500 was down during May fifteen out of twenty times. Then from 1985 through 1997 May was the best month, gaining ground every single year (13 straight gains) on the S&P, up 3.3% on average with the DJIA falling once and two NASDAQ losses.
In the years since 1997, May’s performance has been erratic; DJIA up eleven times in the past twenty-two years (three of the years had gains in excess of 4%). NASDAQ suffered five May losses in a row from 1998-2001, down – 11.9% in 2000, followed by twelve sizable gains in excess of 2.5% and five losses, the worst of which was 8.3% in 2010. Election Year Mays rank at or near the bottom, registering net losses on DJIA and S&P 500 (since 1952), NASDAQ (since 1972) and Russell 1000 and 2000 (since 1980).
Based upon the S&P 500, Monday before May option expiration is much stronger than expiration day itself albeit weaker for small caps. Big caps have registered only eight losses in the last thirty years on Monday. Expiration day is a loser nearly across the board. The full week had a bullish bias that is fading in recent years. The week after options expiration week now favors tech and small caps. DJIA has fallen in twelve of the last twenty-two weeks after.
On Friday before Mother’s Day the DJIA has gained ground seventeen of the last twenty-five years and on the Monday after (the first day of options expiration this year), the blue-chip average has risen in sixteen of those years.
The first two days of May trade higher frequently and the S&P 500 has been up 21 of the last 30 first trading days. A bout of weakness often appears on the third, fourth and around the fifteenth trading day for large cap stocks. Generally, the first half of the month is better than the second half.
| May (1950-2019) |
| |
DJI |
SP500 |
NASDAQ |
Russell
1K |
Russell 2K |
| Rank |
|
9 |
|
8 |
|
5 |
|
7 |
|
7 |
| #
Up |
|
37 |
|
41 |
|
30 |
|
28 |
|
26 |
| #
Down |
|
33 |
|
29 |
|
19 |
|
13 |
|
15 |
| Average
% |
|
-0.1 |
|
0.2 |
|
0.9 |
|
0.8 |
|
1.2 |
| 4-Year Presidential Election Cycle Performance
by % |
| Post-Election |
|
1.3 |
|
1.7 |
|
3.4 |
|
3.0 |
|
3.9 |
| Mid-Term |
|
-0.6 |
|
-0.7 |
|
-0.7 |
|
0.1 |
|
-1.1 |
| Pre-Election |
|
-0.3 |
|
-0.2 |
|
1.1 |
|
0.5 |
|
1.7 |
| Election |
|
-0.7 |
|
-0.1 |
|
-0.3 |
|
-0.3 |
|
0.1 |
| Best & Worst May by % |
| Best |
1990 |
8.3 |
1990 |
9.2 |
1997 |
11.1 |
1990 |
8.9 |
1997 |
11.0 |
| Worst |
2010 |
-7.9 |
1962 |
-8.6 |
2000 |
-11.9 |
2010 |
-8.1 |
2019 |
-7.9 |
| May Weeks by % |
| Best |
5/29/70 |
5.8 |
5/2/97 |
6.2 |
5/17/02 |
8.8 |
5/2/97 |
6.4 |
5/14/10 |
6.3 |
| Worst |
5/25/62 |
-6.0 |
5/25/62 |
-6.8 |
5/7/2010 |
-8.0 |
5/7/10 |
-6.6 |
5/7/10 |
-8.9 |
| May Days by % |
| Best |
5/27/70 |
5.1 |
5/27/70 |
5.0 |
5/30/00 |
7.9 |
5/10/10 |
4.4 |
5/10/10 |
5.6 |
| Worst |
5/28/62 |
-5.7 |
5/28/62 |
-6.7 |
5/23/00 |
-5.9 |
50/20/10 |
-3.9 |
5/20/10 |
-5.1 |
| First Trading Day of Expiration Week: 1990-2019 |
| #Up-#Down |
|
22-8 |
|
22-8 |
|
19-11 |
|
21-9 |
|
16-14 |
| Streak |
|
D1 |
|
D1 |
|
D1 |
|
D1 |
|
D2 |
| Avg
% |
|
0.28 |
|
0.26 |
|
0.24 |
|
0.24 |
|
0.06 |
| Options Expiration Day: 1990-2019 |
| #Up-#Down |
|
15-15 |
|
15-15 |
|
14-16 |
|
15-15 |
|
14-16 |
| Streak |
|
D1 |
|
D2 |
|
D2 |
|
D2 |
|
D1 |
| Avg
% |
|
-0.09 |
|
-0.12 |
|
-0.15 |
|
-0.10 |
|
-0.02 |
| Options Expiration Week: 1990-2019 |
| #Up-#Down |
|
15-15 |
|
15-15 |
|
16-14 |
|
14-16 |
|
17-13 |
| Streak |
|
D4 |
|
D3 |
|
D3 |
|
D3 |
|
D1 |
| Avg
% |
|
0.21 |
|
0.15 |
|
0.25 |
|
0.14 |
|
-0.14 |
| Week After Options Expiration: 1990-2019 |
| #Up-#Down |
|
17-13 |
|
19-11 |
|
20-10 |
|
19-11 |
|
23-7 |
| Streak |
|
D1 |
|
D1 |
|
D1 |
|
D1 |
|
D1 |
| Avg
% |
|
-0.06 |
|
0.19 |
|
0.35 |
|
0.22 |
|
0.44 |
| May 2020 Bullish Days: Data 1999-2019 |
| |
1,
7, 8, 12, 28 |
1,
15, 28 |
1,
8, 18, 28 |
1,
15, 28 |
1, 4, 12, 28 |
| |
|
|
|
|
|
| May 2020 Bearish Days: Data 1999-2019 |
| |
5,
6, 13, 20, 29 |
5,
13, 20 |
5,
20 |
5,
13, 19, 20 |
5, 13, 14 |
| |
|
|
|
|
|
|
May 2020 Strategy Calendar
|
|
By:
Christopher Mistal
|
April 23, 2020
|
|
|
|
|
Seasonal MACD Update & Election-Year Worst Months Prep
|
|
By:
Christopher Mistal
|
April 16, 2020
|
|
|
|
Seasonal MACD Update
Thus far, April has lived up to its historic reputation of delivering market gains. DJIA is up 7.4% this April as of today’s close and S&P 500 is up 8.3%. Even with these gains DJIA is still down 12.2% and S&P is down 5.7% since our Seasonal MACD Buy Signal last October. NASDAQ, which has a “Best Eight Months” lasting until June is currently up 5.9% since our Seasonal Buy Signal. This is an improvement for S&P 500 and NASDAQ since last update. This is encouraging and continues to support the possibility of additional DJIA and S&P 500 gains this “Best Six Months.”
![[DJIA Daily Bar Chart]](/UploadedImage/AIN_0520_20200416_MACD_DJIA.jpg)
![[S&P 500 Daily Bar Chart]](/UploadedImage/AIN_0520_20200416_MACD_SP500.jpg)
Again, we present daily bar charts of DJIA and S&P 500 with the current status of MACD displayed. The current rally has slowed further this week, but MACD is still positive and trending higher (indicated by the blue arrow and higher trending bars). Continue to hold long positions associated with DJIA’s and S&P 500’s “Best Six Months.” We will issue our Seasonal MACD Sell signal when corresponding MACD Sell indicators applied to DJIA and S&P 500 both crossover and issue a new sell signal.
Based upon the magnitude and still relatively brief duration of the current rally, MACD is not likely to turn negative very soon. As of today’s close it would still take a single-day decline in excess of 12% (this is not a typo) by DJIA and S&P 500 to turn MACD negative.
Election-Year Worst Months Prep
We are not issuing the signal at this time.
The long-term track record of our Seasonal Switching Strategy, which is based upon the “Best Six Months” in conjunction with our MACD Technical Buy and Sell Signal signals, still has a solid track record of outperformance with potentially less risk compared to a buy and hold approach over the long-term. Since 1950, DJIA’s average annual gain has been 8.5%. Over the same time period, DJIA has lost an average 0.7% during the “Worst Six Months,” May through October, and gained an average 9.1% during the “Best Six Months,” November through April.
Detractors are quick to point out that there have been positive “bad” months and negative “good” months. This is absolutely true as there is no trading or investment strategy that works 100% of the time (even the best will report a trading loss every once and a while). If the current “good” months period does finish with a loss, it will be just the tenth loss in 70 years. In election years, the second-best performing year of the four-year cycle (page 130, STA20), there have been selloffs. The “Worst Months” in 2008 hosted the largest decline. Weakness also occurred in 2000, 2004 and in 2012. Each of the last 17 Election-Year “Worst Months” can be seen in the following table. DJIA and S&P 500 Worst Six Months are May through the end of October. NASDAQ’s “Worst Four Months” are June through October.
Click image to view full size in a new window…
Considering the paltry historical average gains, even in election years, during the “Worst Months” a cautious approach is worth consideration. The market has rebounded from its lows in March, but uncertainty is still high as the coronavirus battle rages on. The U.S. has already seen historic job losses and recent economic data has reflected the impacts of social distancing and the shutdown of non-essential business. Future economic data releases are likely to be flooded with the terms “historic,” “record,” “the worst in decades” and similar. Restarting the global economy is not likely going to be as easy as it was to stop/slow. Without a cure or vaccine readily available, consumers may still be reluctant to resume past activities which could result in a slower economic recovery. History does suggest the economy and the market will recover; it may just not be as soon as most would prefer.
Applying Our Seasonal Switching Strategy Recap
Because of the elevated level of risk that has been historically observed during the “Worst Six Months” of the year and its historically tepid returns combined with current economic uncertainty, reducing long exposure and deploying a defensive strategy is the approach taken in the Almanac Investor Stock and ETF Portfolios. We do not merely “sell in May and go away.” Instead we take some profits, trim or outright sell underperforming stock and ETF positions, tighten stop losses and limit adding new long exposure to positions from sectors that have a demonstrated record of outperforming during the period. The selloff in March cleaned out the Stock & ETF Portfolios and the trade ideas presented last week were a mix of defensive and speculative.
For those with a lower risk tolerance or a desire to take a break from trading, the “Worst Months” are a great opportunity to unwind longs and move into the relative safety of cash, Treasury bonds, gold and/or some combination of. Preservation of capital may be more important than growth and with historical averages and frequency of gains reduced; the “Worst Six Months” are a good time to simply step aside completely if you prefer. August, September and/or October have provided some excellent buying opportunities in recent years and could do the same again this year.
Worst Months Moves
We are not issuing the signal at this time.
When we issue our DJIA and S&P 500 Seasonal Sell signal we will either sell associated positions outright or implement tight trailing stop losses. Additional bearish/defensive positions in: iShares 7-10 Year Treasury (IEF), iShares 20+ Year Treasury (TLT), ProShares Short Dow 30 (DOG), ProShares Short S&P 500 (SH) and/or other protective strategies may also be considered. All current stock and ETF holdings will be reevaluated at that time as well as the “Worst Months” outlook is fluid.
For traders and investors employing the “Best 6 + 4-Year Cycle” as detailed on page 62 of the Stock Trader’s Almanac 2020, this year’s upcoming Seasonal MACD Sell signal could be ignored as the multi-year hold period is underway. It may still be prudent to use the signal as a reminder to review all holdings and objectives.
|
Don’t Fight the Fed – Keep Your Eye on Jobless Claims
|
|
By:
Jeffrey A. Hirsch
|
April 09, 2020
|
|
|
|
Everyone on Wall Street is debating and looking for the perfect dataset or indicator to tell if the bear market ended on March 23, 2020. It may very well have, but we won’t know for sure until we have a little more hindsight. But we must push on. With the USA on virtual lockdown and many businesses closed for weeks with the prospect of being closed for several more weeks if not months, a recession is quite likely.
We know the market leads recession by several months. On average since 1948, bear markets start about 8-9 months ahead of recession though the last bear 2007 began just about 2 months before the recession. Bear markets end about 3-4 months before the end of the recession. The last recession ended in June 2009 about three months after the bear market low in March 2009. So if February 12 was the beginning of the bear market and March 23 was the bear market low then the recession could be rather short-lived.
The lingering effects of the pandemic could mute economic activity for some time if there is not clear medical solution for COVID-19. But once the coast is clear there is likely to be a good deal of pent up demand. We applaud all the scientific efforts to develop a vaccine and therapies and all fiscal stimulus to help business and individuals.
But the clincher as far as the market is concerned is that the Federal Reserve has been extremely supportive and plainly stated it will dump as much money as necessary to prop up the economy and market and fund the stimulus until there is a medical solution and or the economy finds footing – as the old saying goes: “Don’t Fight the Fed!”
One metric we have always found useful in identifying bear market lows is the trend of Weekly Initial Jobless Claims. Initial Claims the past three weeks have been massive and historic, threatening to push unemployment near levels of the Great Depression. But if the trend continues, Initial Claims may have peaked already.
In the chart we have omitted Initial Claims of 3.3 million, 6.9 million and 6.6 million the past three weeks as they would literally be off the chart. Also we have plotted DJIA on a logarithmic scale so that the highs and lows of the past would be discernible. All the bear market lows for DJIA associated with a recession line up quite well with the spike peaks of Weekly Initial Jobless Claims.
Bear markets like 1987, which was a computer driven crash, were not accompanied by recession or an increase in Jobless Claims. But all the big bear market lows of 1970, 1974, 1982, 1990, 2001 and 2009 were marked by the peak of Jobless Claims. So keep your eye on Jobless Claims for continuing confirmation that the low is in.
|
Seasonal MACD & Stock Portfolio Update: Rebound Continues & New Stocks to Ponder
|
|
By:
Christopher Mistal
|
April 09, 2020
|
|
|
|
Seasonal MACD Update
Fueled by hope, the Fed and massive fiscal stimulus, the market has continued to rally into April. As of today’s close, DJIA is up 27.6% from its closing low on March 23 while S&P 500 has risen 24.7%. That would be the good news. The bad news is DJIA is still down 11.5% and S&P is down 6.1% since our Seasonal MACD Buy Signal last October. NASDAQ, which has a “Best Eight Months” lasting until June is currently up 1.2% since our Seasonal Buy Signal which is encouraging and suggests DJIA and S&P 500 could also still have a positive “Best Six Months.”
![[DJIA Daily Bar Chart]](/UploadedImage/AIN_0520_20200409_MACD_DJIA.jpg)
![[S&P 500 Daily Bar Chart]](/UploadedImage/AIN_0520_20200409_MACD_SP500.jpg)
Once again, we present daily bar charts of DJIA and S&P 500 with the current status of MACD displayed. The current rally has slowed modestly, but MACD is still positive and trending higher (indicated by the blue arrow and higher trending bars). Continue to hold long positions associated with DJIA’s and S&P 500’s “Best Six Months.” We will issue our Seasonal MACD Sell signal when corresponding MACD Sell indicators applied to DJIA and S&P 500 both crossover and issue a new sell signal.
Based upon the magnitude and relatively brief duration of the current rally, MACD is not likely to turn negative soon. As of today’s close it would still take a single-day decline in excess of 20% (this is not a typo) by DJIA and S&P 500 to turn MACD negative.
Stock Portfolio Update
In the time since last update through yesterday’s close the Almanac Investor Stock Portfolio declined 1.2% compared to a 0.3% gain by S&P 500 and a 5.7% decline from the Russell 2000. The majority of the decline occurred shortly after last update as every position in the portfolio was stopped out except Regeneron (REGN) and ZTO Express (ZTO). Nearly every position was stopped out on March 12 as traders and investors began ditching all positions, even those in generally defensive sectors like utilities and consumer staples.
With the portfolio trimmed to just two stock holdings and the
Celegene CVR, we are going to use this opportunity to make a few changes to the portfolio table. Beginning this month we are going to use the following market cap ranges at the time the position is first presented; Small-caps will be any stock with a market cap under $2 billion, Mid-cap stocks will be in the range of $2 billion to $10 billion and Large-caps will be any stock whose market cap is greater than $10 billion. This is a modest change from our
previous ranges. Beginning next month we will also consolidate cash into a single balance instead of the current practice of spreading it across the three market-cap ranges, unless there are any major objections.
Many of the positions in the portfolio were defensive and had been holdings since June 2018. Many of these positions have already bounced back as historically low Treasury bond yields drive traders and investors in search of higher yields. As we would typically begin looking for quality defensive names to hold during the “Worst Six Months,” May through October for DJIA and S&P 500, we are electing to re-enter many of the previously held defensive positions along with a few new select names. These defensive positions are currently yielding around 3.5% and are shaded in grey in the table below. Buy limits and stop losses can also be found in the table below.
In addition to defensive positions just mentioned, we are also presenting some potentially more speculative trade ideas from the energy, transportation, banking, housing and auto sectors. Uncertainty is still elevated, and the end of social distancing remains unclear. The bottom may not have been reached yet in many of these new trade ideas, but the magnitude of their recent declines and prospects for a rebound in the future appear to balance the risk/reward scales sufficiently to at least consider them.
Airlines, energy, banks and housing have been beaten down for obvious reasons. We have been told to stay at home and shutdown our non-essential business (or run them in a socially distancing friendly manner) which has resulted in massive job losses. Regional banks were driven down on job loss/business shutdown credit risk but are likely to be buffered by the Fed and fiscal stimulus aimed directly at those issues. $25 per barrel oil is two-fold, a loss of demand and a price war between Russia and Saudi Arabia. Large energy companies like Exxon Mobil (XOM) appear to be priced for oil to remain at that price indefinitely and that simply does not seem all that plausible.
Airlines are not all that different from auto makers. They both employ large numbers and provide something we all have grown very much accustomed to. So perhaps government support or a bailout keeps them afloat for now, but airlines are not going to disappear. There is likely to be some consolidation in the sector that will most likely favor the larger carriers before the worst is over. Nonetheless, we like to travel, and once social distancing is no longer needed, we will be travelling once again.
Lastly, ultra-low interest rates are likely to give housing and autos a boost once things begin to normalize. In the meantime, sales are still happening within the guidelines of social distancing improving the odds of business survival.
Please see table below for new trade ideas. Those shaded grey can be considered defensive and are in line with our long-term strategy that revolves around the Best/Worst Months. Other new trade ideas are possibly much more speculative and should be treated as such. More volatility is not out of the question nor is the possibility that the final lows of this cycle may not have occurred yet. Buy limits are set in the table below to reflect our suggested maximum price to pay for a stock. Stop losses could limit downside risk if the market takes a turn for the worse.
|
ETF Trades & Seasonal MACD Update: Bounce Helps, But Damage Done
|
|
By:
Christopher Mistal
|
April 02, 2020
|
|
|
|
Usually at this time of the year, April, the last month of DJIA and S&P 500 “Best Six Months,” the market would have had a nice seasonal rally and we would be on alert for our Seasonal MACD Sell signal. Well, there is nothing usual or normal about the market or the economy this time. Historic levels of volatility in March literally turned modest Best Months gains into losses in a just a few days.
As of today, the new bear market closing lows were on March 23. From their highs DJIA was down 37.1% and S&P 500 was down 33.9%. Since then the market has rebounded to trim those losses but appears to be struggling again as uncertainty remains high and initial weekly jobless claims spike to never before seen levels exceeding 6 million. The rebound did result in a reversal of our MACD indicator on March 26. The bounce higher and the positive MACD crossover have potentially set up our Seasonal Sell Signal for a modestly better exit of DJIA and S&P 500 related positions.
In last week’s April Outlook, we reviewed past Down Best Six Months for DJIA since 1950 and concluded further caution and patience is likely in order. The market could continue to improve in the near-term especially if the spread of COVID-19 can be curtailed, but the growing uncertainty of the longer-term impact on the global economy could trigger a retest of March’s lows before a new bull market can take hold and flourish.
Continue to hold long positions associated with DJIA’s and S&P 500’s “Best Six Months.” We will issue our Seasonal MACD Sell signal when corresponding MACD Sell indicators applied to DJIA and S&P 500 both crossover and issue a new sell signal. Based upon today’s close it would take a single-day decline in excess of 20% by DJIA and S&P 500 to turn MACD negative.
Sector Rotation Update – Worst Months Positions on Radar
Not long after last update in early March, the market began its steep slide and every remaining position in the portfolio was stopped out except for SPDR Gold (GLD). Up until March 11 SPDR Consumer Staples (XLP) and iShares NASDAQ Biotech (IBB) had held up reasonably well, but inevitably they also got swept up by broad-based, heavy selling pressure. Last’s months new trades in tech and utilities were not spared and were stopped out shortly after being added to the portfolio.
In preparation for the upcoming “Worst Months,”
new trade ideas in SPDR Consumer Staples (XLP), SPDR Utilities (XLU) and iShares NASDAQ Biotech (IBB) appear in the portfolio table below. XLP and XLU trades are based upon their
historical tendency to outperform the S&P 500 during the “Worst Six Months,” May to October. IBB has a somewhat mixed Worst Months record but appears to be a possibly timely position to consider this year.
All three positions have bounced higher with the broader market but remain well below their recent highs. Buy limits are well under current prices as we would prefer to pick them up only modestly higher than their respective recent lows. If they do not trade below their buy limits, we will consider adding them when we issue our Seasonal MACD Sell Signal.
Continue to hold GLD.
Tactical Switching Strategy Update
Portfolio results are disappointing this Best Months period. Even though losses in the Best Months are infrequent they do occur (pages 52, 54, 60 & 62 Stock Trader’s Almanac 2020). The pandemic and the ensuing global economic shutdown are outliers that we hope will not be repeated anytime soon. The market’s rebound may provide an opportunity to close out positions at better prices than what was available at times in March.
All positions in the Tactical Seasonal Switching Strategy Portfolio are on Hold. Our seasonal MACD Sell signal for DJIA and S&P 500 can come any day now. In preparation for that day, iShares Core U.S. Aggregate Bond (AGG) and Vanguard Total Bond Market (BND) appear at the bottom of the Tactical Switching Strategy portfolio. AGG and BND could be considered on dips or when our Seasonal MACD Sell Signal Alert is issued.