|
Market at a Glance - 5/27/2021
|
|
By:
Christopher Mistal
|
--
|
|
|
|
5/26/2021: Dow 34323.05 | S&P 4195.99 | NASDAQ 13738.00 | Russell 2K 2249.27 | NYSE 16451.96 | Value Line Arith 9555.35
Fundamental: Positive. Overall vaccinations are climbing while U.S. cases and deaths are falling. Restrictions are easing and people are slowly returning to work and pre-COVID-19 activities. Weekly initial jobless claims have declined to their lowest level since the pandemic started. U.S. GDP is on the rebound and corporate earnings and guidance were strong triggering many analysts to raise their estimates and targets. Headwinds still exist. Numerous COVID-19 hotspots exist globally, and inflation metrics are running hotter than they have been in over a decade.
Technical: Topping? DJIA and S&P 500 closed at new all-time highs in May. NASDAQ did not. Rotation from stay-at-home stocks to reopening stocks continues. This has hit the tech-heavy NASDAQ while lending strength to DJIA. Rotation is likely to keep a lid on overall market gains as meaningful and sizable gains typically require broad participation. Marginal new highs are possible, but sideways, range-bound trading by the major indexes is increasingly more likely.
Monetary: 0 – 0.25%. Once again, the Fed is catching flak for expanding its mandate and for being highly accommodative with monetary policy. It really appears to be a situation of the lesser of all evils. Tighten too early or too quickly and risk stalling the economic ascent in order to potentially stave off inflation and return to a more typical rate environment or ensure that the recovery and the overall economy are on firm ground in good health. The start/stop and start/stop and repeat approach taken after the financial crisis of 2008-09 was not highly effective as the recovery was sluggish and intermittent. Inflation is a concern. However, it would appear that the Fed could remove liquidity nearly as quickly as was added. The Fed’s approach is aggressive but appears reasonable and appropriate and likely to succeed.
Seasonal: Neutral. June is the last month of NASDAQ’s “Best Eight Months” and the second month of DJIA’s and S&P 500’s “Worst Six Months.” In post-election years, June is second worst for DJIA and third worst for S&P 500. NASDAQ and Russell 2000 have been stronger with average gains of 0.4% and 1.2% respectively.
Psychological: Improving. According to
Investor’s Intelligence Advisors Sentiment survey Bullish advisors have slipped to 51.5%. Correction advisors have climbed to 31.7% while Bearish advisors are at 16.8%. Sentiment remains elevated but has retreated from the frothy levels reported in April. The decline in sentiment is likely part seasonal and part technical. Easing bullish sentiment is encouraging, but current levels still warrant caution.
|
June Outlook: NASDAQ Best 8 Months Ends – Sideways Summer Trading
|
|
By:
Jeffrey A. Hirsch & Christopher Mistal
|
--
|
|
|
|
Stocks have gone virtually nowhere since our April 22
Best Six Months MACD Seasonal Sell Signal. Trading volume has already begun to slowdown as it tends to do from Memorial Day to Labor Day in what we refer to as the summer doldrums. This reduction in trading volume (page 48, STA 2021) both contributes to and is emblematic of seasonal market weakness during the Worst Six Months May-October (page 147, STA 2021) and the Worst Four Months July-October (page 148, STA 2021).
The market continues to follow seasonality albeit with a greater magnitude of gains this year and for the Best Six Months November-April than the average year. As you can see in the chart here of the S&P 500 comparing 2021 to the historical seasonal pattern we have also begun to track the typical sideways action the market experiences over the Worst Months of the year.
Several factors at play, especially during this unique post-COVID-19-pandemic, economic-reopening year, continue to support our near-term sideways market outlook on the backdrop of our overall bullish outlook for the year as a whole in keeping with the base and best case scenarios of our
December 17, 2020, 2021 Annual Forecast. We still expect to see the S&P 500 finish the year above current levels in the 4300-4500 range, more in line with our best case scenario. In the near term, however, the market is primed to remain range-bound and bounce around between the April/May highs and the March lows.
The Fed’s still prudent accommodative stance will ensure the economic recovery is not undermined by a hasty response to transitory inflation pressures. This also helps keep a floor under the market – The Powell Put if you will. Fiscal spending from existing COVID-19 stimulus packages, likely infrastructure spending package soon, as well as
fiscal stimulus from G20 nations will also support the market. Further fundamental support comes from increased consumer spending, a healthy employment market and robust numbers from corporate America.
On the lid side of the equation folks are coming out of their pandemic shells in droves. This is great news for the travel industry, but it means that usual exodus from The Street could potentially be more dramatic as people turn away from the market and turn towards visiting family they have not seen in over a year, vacations and all sorts of leisure activities.
Inflation fears, the slowing pace of vaccinations, troubling global COVID hotspots, technical resistance and rich valuations are also likely to keep market gains at bay over this seasonal weak period through Q3. Market rotation from the tech-oriented stay-at-home stocks into reopening stocks is also conspiring to hold back broad market gains until the summer travel seasons winds down.
End Best 8 Months
June 1 is the earliest NASDAQ’s Seasonal Sell can trigger as NASDAQ’s Best Eight Months ends in June. The signal will be emailed to subscribers after the close on the day it triggers. That will be our signal to increase our defensive stance. We will make portfolio adjustments accordingly and seek new portfolio recommendations in top worst month sectors, especially Consumer Staples, Utilities and Healthcare, as well as dividend paying stocks.
Remember cash is king this time of year. This is the season to sell losers, tighten up stops and raise some cash for the perennial better buying opportunity in the weak August/September timeframe and turnaround October.
June is a tough month for DJIA and S&P 500, but not so bad for NASDAQ and Russell 2000. This year June starts right after Memorial Day, which is not the most bullish post-holiday trade so, the usual strength on the first two trading days of June may be muted as folks get back into the swing of things after the long weekend.
Christmas in July: NASDAQ’s Mid-Year Rally
In the mid-1980s the market began to evolve into a tech-driven market and the market’s focus in early summer shifted to the outlook for second quarter earnings of technology companies. Over the last three trading days of June and the first nine trading days in July, NASDAQ typically enjoys a rally. This 12-day run has been up 28 of the past 36 years with an average historical gain of 2.6%.
After the bursting of the tech bubble in 2000, NASDAQ’s mid-year rally had a spotty track record from 2002 until 2009 with three appearances and five no-shows in those years. However, it has been quite solid over the last eleven years, up ten times with a single mild 0.1% loss in 2015. Last year, NASDAQ advanced a solid 4.7% during the 12-day span.
Pulse of the Market
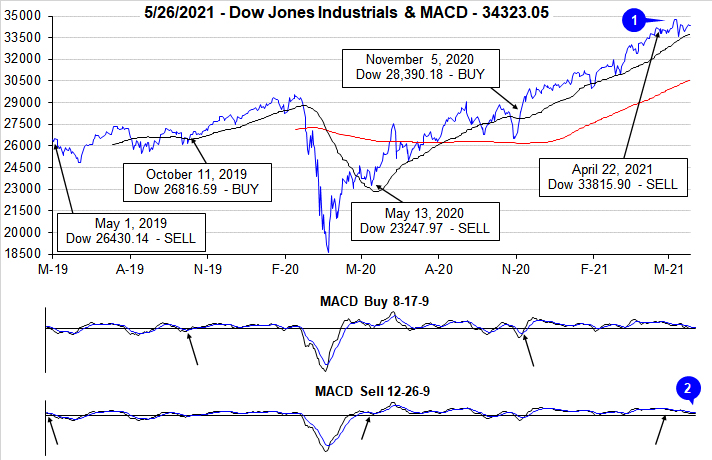
Early strength did give way to typical “Sell in May” pressure as spiking inflation drew the attention of traders and investors just before mid-month. Prior to the brief retreat, DJIA (1) and S&P 500 both closed at new all-time highs on May 7. Currently DJIA is recovering, but still remains below its previous closing high. With the exception of a few trading days ahead of mid-May, both the faster and slower MACD indicators (2) applied to DJIA have been negative since issuing our Seasonal MACD Sell for DJIA and S&P 500 on the close on April 22. DJIA appears to be slipping into a typical sideways trading pattern often seen during the “Worst Six Months.”
Since issuing our Seasonal MACD Sell, DJIA (3) has only advanced once in the last five weeks. S&P 500 (4) has declined during three of the last five weeks and was flat during the last week of April. NASDAQ (5) has also declined in four of the last five weeks. If current gains hold, DJIA, S&P 500 and DJIA are on track for a modest gain this week. It would appear the rotation from stay-at-home stocks to reopening stocks continues. This rotation is likely to keep a lid on upside as COVID-19 restrictions slowly ease. The slowing pace of vaccinations could cause the pace of lifting restrictions to slow as well.
In spite of market weakness over the last five weeks, market breadth measured by NYSE Weekly Advancers and NYSE Weekly Decliners (6) was positive in four of the last five weeks. The advantage held by Weekly Advances does appear to be narrowing and is consistent with a market that could be slipping into a trading range. Absent a significant deterioration in the Weekly Advance/Decline line, the market is not likely to suffer a sizable and/or damaging pullback.
As DJIA and S&P 500 reached new highs ahead of mid-May, Weekly New Highs (7) climbed to 911. This was short of the 951-peak reached in March. This also appears consistent with a market that is entering a phase of sideways trading and consolidation. Weekly New Highs have declined over the last two weeks while New Lows have expanded modestly. Neither level is overly concerning and suggests underlying support.
Inflation has picked up, but much of the gain could be attributed to year-ago comparisons. A little over a year ago, the global economy was largely shutdown due to COVID-19 restrictions. Demand plunged then while now demand is surging as economies slowly attempt to return to normal. The Fed’s view that the recent spike seen in headline CPI and PPI figures is transitory is likely correct. One confirming indication thus far is the 30-year Treasury bond yield (8) appears to have stabilized in the 2.20 to 2.40 range. Low rates, ample liquidity and fiscal stimulus are also providing a solid floor of support under the market reducing the risk of any major market downturn in the near-term.
Click for larger graphic…
|
June Almanac: Second Worst DJIA Month in Post-Election Years
|
|
By:
Jeffrey A. Hirsch & Christopher Mistal
|
May 20, 2021
|
|
|
|
June has shone brighter on NASDAQ stocks over the last 50 years as a rule ranking sixth with a 0.9% average gain, up 28 of 50 years. This contributes to NASDAQ’s “Best Eight Months” which ends in June. June ranks near the bottom on the Dow Jones Industrials just above September since 1950 with an average loss of 0.2%. S&P 500 performs similarly poorly, ranking ninth, but essentially flat (0.1% average gain). Small caps also tend to fare well in June. Russell 2000 has averaged 0.8% in the month since 1979.
In post-election years since 1953, June still ranks poorly and its average loss for DJIA increases to –1.1% while S&P 500's modestly positive performance becomes a 0.6% loss. DJIA struggles the most, advancing in just four post-election year Junes (1977, 1985, 1997 and 2017). Russell 2000 fares best, up seven times in ten years with an average gain of 1.2%. NASDAQ lands in the middle, advancing 50% of the time with an average gain of 0.4%
![[June post-election year table]](/UploadedImage/AIN_0621_20210520_PE_June_mini_table.jpg)
The second Triple Witching Week of the year brings on some volatile trading with losses frequently exceeding gains. On Monday of Triple-Witching Week the Dow has been down thirteen of the last twenty-four years. Triple-Witching Friday is somewhat better, up ten of the last eighteen years, but down five of the last six. Full-week performance is choppy as well, littered with greater than 1% moves in both directions. The week after Triple-Witching Day is horrendous. This week has experienced DJIA losses in 27 of the last 31 years with average losses of 1.1%. NASDAQ and Russell 2000 had fared better during the week after, but that trend appears to be fading.
June’s first trading day is the Dow’s best day of the month, up 26 of the last 33 years. Gains are sparse throughout the remainder of the month until the last three days when NASDAQ and Russell 2000 stocks begin to exhibit strength. The last day of the second quarter is a bit of a paradox as the Dow has been down 17 of the last 30 (however, up 8 of the last 10) while NASDAQ and Russell 2000 have nearly the opposite record. NASDAQ has been up 21 of the last 29.
| June (1950-2020) |
| |
DJI |
SP500 |
NASDAQ |
Russell
1K |
Russell 2K |
| Rank |
|
11 |
|
9 |
|
6 |
|
9 |
|
7 |
| #
Up |
|
34 |
|
39 |
|
28 |
|
26 |
|
27 |
| #
Down |
|
37 |
|
32 |
|
22 |
|
16 |
|
15 |
| Average
% |
|
-0.2 |
|
0.1 |
|
0.9 |
|
0.4 |
|
0.8 |
| 4-Year Presidential Election Cycle Performance
by % |
| Post-Election |
|
-1.1 |
|
-0.6 |
|
0.4 |
|
0.1 |
|
1.2 |
| Mid-Term |
|
-1.7 |
|
-1.8 |
|
-1.4 |
|
-1.2 |
|
-1.4 |
| Pre-Election |
|
1.1 |
|
1.5 |
|
2.4 |
|
1.6 |
|
1.9 |
| Election |
|
0.9 |
|
1.3 |
|
1.9 |
|
0.9 |
|
1.6 |
| Best & Worst June by % |
| Best |
2019 |
7.2 |
1955 |
8.2 |
2000 |
16.6 |
2019 |
6.9 |
2000 |
8.6 |
| Worst |
2008 |
-10.2 |
2008 |
-8.6 |
2002 |
-9.4 |
2008 |
-8.5 |
2010 |
-7.9 |
| June Weeks by % |
| Best |
6/5/2020 |
6.8 |
6/2/00 |
7.2 |
6/2/00 |
19.0 |
6/2/00 |
8.0 |
6/2/00 |
12.2 |
| Worst |
6/30/50 |
-6.8 |
6/30/50 |
-7.6 |
6/15/01 |
-8.4 |
6/12/20 |
-4.8 |
6/12/20 |
-7.9 |
| June Days by % |
| Best |
6/28/62 |
3.8 |
6/28/62 |
3.4 |
6/2/00 |
6.4 |
6/10/10 |
3.0 |
6/2/00 |
4.2 |
| Worst |
6/11/20 |
-6.9 |
6/11/20 |
-5.9 |
6/11/20 |
-5.3 |
6/11/20 |
-5.9 |
6/11/20 |
-7.6 |
| First Trading Day of Expiration Week: 1990-2020 |
| #Up-#Down |
|
17-14 |
|
18-13 |
|
14-17 |
|
16-15 |
|
14-17 |
| Streak |
|
U3 |
|
U3 |
|
U3 |
|
U3 |
|
U3 |
| Avg
% |
|
-0.05 |
|
-0.08 |
|
-0.23 |
|
-0.10 |
|
-0.28 |
| Options Expiration Day: 1990-2020 |
| #Up-#Down |
|
17-14 |
|
18-13 |
|
15-16 |
|
17-14 |
|
16-15 |
| Streak |
|
D3 |
|
D3 |
|
U1 |
|
D2 |
|
D6 |
| Avg
% |
|
-0.19 |
|
-0.09 |
|
-0.05 |
|
-0.09 |
|
-0.03 |
| Options Expiration Week: 1990-2020 |
| #Up-#Down |
|
19-12 |
|
19-12 |
|
15-16 |
|
17-14 |
|
16-15 |
| Streak |
|
U2 |
|
U4 |
|
U3 |
|
U4 |
|
U3 |
| Avg
% |
|
0.06 |
|
0.07 |
|
-0.03 |
|
0.08 |
|
-0.04 |
| Week After Options Expiration: 1990-2020 |
| #Up-#Down |
|
4-27 |
|
8-23 |
|
13-18 |
|
9-22 |
|
14-17 |
| Streak |
|
D3 |
|
D3 |
|
D3 |
|
D3 |
|
D1 |
| Avg
% |
|
-1.14 |
|
-0.79 |
|
-0.29 |
|
-0.76 |
|
-0.49 |
| June 2021 Bullish Days: Data 2000-2020 |
| |
1,
2, 7, 8, 16 |
1,
2, 8, 15 |
1,
2, 15, 17, 21 |
1,
2, 8, 15, 30 |
1, 2, 7, 14, 15 |
| |
|
|
28-30 |
|
28, 29 |
| June 2021 Bearish Days: Data 2000-2020 |
| |
9,
10, 21, 22 |
9,
10, 24 |
9,
10, 23, 24 |
9,
10, 24 |
9, 24 |
| |
24,
25 |
|
|
|
|
|
June 2021 Strategy Calendar
|
|
By:
Christopher Mistal
|
May 20, 2021
|
|
|
|
|
Stock Portfolio Update: Small Caps and Large Cap Defense Payoff
|
|
By:
Jeffrey A. Hirsch & Christopher Mistal
|
May 13, 2021
|
|
|
|
Our go to leading market index indicator of late, the NASDAQ 100 (NDX), which is tracked by the widely held exchange traded fund (ETF) Invesco QQQ Trust (QQQ), may have found some support yesterday in the big sell off near 13000. Actually, using our wide chisel-tip Sharpie we would draw this current near-term support between the black line support levels in the 13000-13200 range on the accompanying chart.
While we still do not expect any major decline here, we do not foresee any major upside either over the next six months – the Worst Six Month of the year May-October. We zoomed in and updated a few lines and notations on the charts we presented in our
May Outlook and in our
NDX Uptrend Broken, Support Under Pressure blog post earlier this week.
We are rather comfortable with our timely April 22 Best Six Months Seasonal MACD Sell Signal and with our outlook for a more typical “Reposition in May” period. The Fed can print money faster than the market can decline and more fiscal stimulus is coming down the pike as well as continued fuel from pent-up pandemic demand.
Look for NASDAQ and NDX to rebound and lead the rally into early July through the rest of its Best Eight Months November-June and the historically strong first half of July in keeping with seasonal market patterns. Though, we do see resistance at the recent April highs near NDX 14000.
If we do break below this 13000 support level there is support at the uptrend line since the September/October lows around 12900 and 12750, which would be an 8-9% pullback from the April 16 14041.91 closing Doji candle high. Below that are the March lows 12200-12420 which would be an 11-13% correction.
In our view all the stimulus, pent-up demand and Fed money will prevent any major down draft, while seasonals, valuations, technicals, internals, sector rotation and sentiment will keep a lid on the upside most likely until the fall. Please enjoy a more normal summer.
Portfolio Updates
Over the last five weeks since last update through yesterday’s close, S&P 500 slipped 0.4% lower while Russell 2000 declined 4.0%. During the same time period the entire portfolio climbed 0.6% higher excluding dividends and any fees. Overall portfolio performance benefited from a sizable cash position and strength in defensive positions as the market stumbled. Around half of the portfolio’s gains came from our Large-cap stocks which advanced 1.2% due to strength in energy and utilities. Small caps, led by financial positions contributed the rest of the gains, up 1.4%. Mid-cap stocks slid 3.5% lower on average mainly due to declines by Algonquin Power (AQN) and JetBlue Airways (JBLU).
AQN’s recent weakness appears to be correlated with weakness in alternative energy since January/early-February of this year. AQN does own and operate approximately 2.1 gigawatts of renewable energy assets along with electric, natural gas and water distribution. They also have wastewater collection systems. This is not exactly your typical utility company that many of us are familiar with. AQN actually looks more like a utility company of the future where renewables are the largest asset. Recent quarterly earnings were solid, and management has raised the dividend by 10% which at current share price equates to around a 4.5% yield. AQN can be considered at current levels up to its buy limit.
JBLU’s recovery run has likely come to an end after peaking in mid-March. The position is still up over 100% since last April, but the quick gains have likely passed. Prior to the Covid-19 pandemic JBLU was growing revenues annually. Unlike some rather pessimistic views on air travel, JBLU and the domestic portion of air travel are likely to recover quicker than expected. It will only take a family trip or two in an auto, sitting in heavy traffic, to make flying look attractive again. JBLU is on Hold. Should recovery take longer than expected then the stop loss should preserve the bulk of remaining gains.
Even though the broader Russell 2000 index of small-cap stocks was down over the last five weeks, our selection of small-cap stocks performed well. Strength in financials/banks lifted AUB, WSFS, SSB and CUBI. On April 12, CUBI became the fourth small-cap holding to double and in accordance with standard trading guidelines, half the original position was closed. Avid Tech (AVID) also enjoyed a significant gain over the last five weeks due to well-received quarterly earnings. AVID has since pulled back from its recent highs but remains above its positive trend line stretching back to October of last year.
Spiking inflation and firming Treasury bond yields appear to be taking some wind out of the sails of homebuilders. KB Home (KBH) is still up over 100% since being added to the portfolio, but it was down nearly 16% from its May 10 high through its close yesterday. Shares are bouncing today along with other homebuilder stocks. Here again we have likely seen the bulk of the quick gains as rates creep higher and raw material prices start to erode margins. KBH is on Hold.
Moving along to the Large-cap portfolio, defensive positions (shaded in light grey) have rebounded over the last week or so and are responsible for the bulk of the portfolio’s gains. Utility positions such as DTE Energy (DTE) and Duke Energy (DUK) appear to be regaining momentum after stumbling throughout the second half of April into early May. Further gains from utilities will likely depend on where interest rates go next and whether or not market volatility persists. Historically, utilities have been a top performer during the “Worst Six Months” and this time around there does appear to be plenty to be concerned about.
Kansas City Southern (KSU) had agreed to merge with Canadian Pacific (CP) back in March. Apparently, the idea was also attractive to Canadian National Railway (CNI) as they made their own unsolicited and better offer. CNI’s offer values KSU at $325 per share compared to the original offer from CP of $275 per share. Both offers are a combination of cash and shares of the acquiring company. At press time, word is breaking that CNI will further sweeten the offer to cover the $700 million breakup fee to walk away from CP. Hold KSU.
Amdocs (DOX) had been recovering from its late-March selloff triggered by a short-seller report until late-April as broader weakest began to creep into the market. Second quarter earnings were essentially flat, but management did raise guidance and shares responded positively today, up 4.05%. Hold DOX.
Please see table below for specific stop losses and current advice for each position in the portfolio. All other positions not already mentioned are on Hold. As a reminder, dividend paying and/or generally defensive positions held in the portfolio are shaded in light grey.
|
ETF Portfolio Updates: Rotating in May
|
|
By:
Jeffrey A. Hirsch & Christopher Mistal
|
May 06, 2021
|
|
|
|
Welcome to the Worst Six Months of the year May-October.
Surely you have been hearing a lot about “Sell in May and Go Away” recently and you will likely be hearing more over the next several days and weeks. And much of it will be naysayers who fail to look at the data and the consistent long-term results. Like this line from a CNBC article this week titled, “
Why investors should ignore the old Wall Street adage ‘Sell in May.’”
“
Any investment strategy that you can summarize in a rhyme is probably a bad strategy. Jonathan Golub, Chief U.S. Equity Strategist at Credit Suisse. Mr. Golub is a fine analyst, but his glib remark, while witty, misses the mark and ignores the
data and history.
Over the years there have been some good Worst Six Months May-October (WSM) and some bad Best Six Months November-April (BSM), but over the long haul the numbers are irrefutable. Since 1950 through April 30, 2021 S&P averages 1.6% in WSM and 7.2% in BSM. But when you compound a one-time hypothetical $10,000 investment in each time period the numbers are astonishing. BSM gains $1,011,918, 80x greater than the WSM gain of $12,623.
Then there’s this
MarketWatch piece also out this week that conveys the same tepid outlook we have for the Worst Six Months from Stifel’s head of institutional equity strategy, Barry Bannister based on the May-October seasonal weakness we have made famous in the
Almanac.
Mr. Bannister’s analysis is not unreasonable, but in the table he presents using the same initial $10,000 hypothetical one time investment starting in 1950 that we have published in the Almanac for 35 years he has a dubious footnote that states, “it is critical to note that investing in all 12 months of the year (i.e., never exiting the S&P 500) would now be worth $23,525,500.”
If you just take the two cumulative totals in his table of $78,215 for May-October and $2,986,171 for November-April and add them together you get $3,064,386 – way off his holding-for-12-months number in the footnote. In Mr. Bannister’s defense he does recognize how the Best Six Months crushed the Worst Six Months with the “Nov-1 to Apr-30 return cumulatively 38x more than May-1 to Oct-31.”
We wrote the book on Sell in May – AKA the Best Six Months Switching Strategy. It was discovered by our illustrious founder Yale Hirsch, creator of the Stock Trader’s Almanac who is 97 and counting. He first published it in 1986 in the 1987, 20th Anniversary edition Stock Trader’s Almanac. The 2022, 55th Annual Edition will be sent off to the press shortly.
May’s Sector Seasonalities
Per page 92 of the 2021 Stock Trader’s Almanac, there are three new bearish sector seasonalities beginning in May; Banking, Gold & Silver and Materials. We are officially going to pass on all three this time around. Current trends and expectations for these sectors do not present a reasonably balanced risk/reward. In the near-term, the economy is reopening. The Fed is highly accommodative and fiscal policy is highly supportive. The odds of these sectors pulling back or correcting appears quite low with all the support that exists. We will continue to monitor these sectors and should the risk/reward appear to improve we may revisit shorting them.
Sector Rotation ETF Portfolio
Full-month April performance from the major indexes was well-above historical averages this year as earnings season and vaccine rollout in the US boosted stocks. Strength in the month was concentrated in the first half which has frequently occurred as traders and investors have historically tended to push stocks higher ahead of earnings and then take profits when results are released. Around mid-month momentum did fade and on the close of April 22 our
Seasonal MACD Sell for DJIA and S&P 500 triggered.
Prior to our Seasonal MACD Sell signal three positions reached and traded above their respective Auto Sell prices; iShares DJ US Telecom (IYZ), SPDR Technology (XLK) and Vanguard REIT (VNQ). All three positions were closed out for an average gain of 18.2%. Per our Seasonal MACD Sell Alert, SPDR Materials (XLB) was closed out at its average price on April 23 for a gain of 20.9%. These gains do not include trading costs or dividends.
Copper has also enjoyed above average gains during its current seasonally favorable period. A combination of limited supply due to Covid-19 and surging demand due to economies recovering, housing demand and growing use in autos, specially an ever-increasing number of available all electric models is driving a surge in price. Global X Copper Miners (COPX) was up 45.0% since mid-December at yesterday’s close. This is nearly double the gain of United States Copper (CPER) over the same time period. Forecasts are still calling for even higher prices. Continue to Hold COPX and CPER.
Gold and silver have been meandering sideways to lower since around the beginning of last August. But since late March both have begun trending modestly higher. Lower and/or stabilizing longer-term interest rates could be giving both a lift now, but it could prove short-lived. In contrast with past periods of easy monetary policy and heavy deficit spending, this time around cryptocurrencies appear to be the choice to park excess liquidity now. SPDR Gold (GLD) and iShares Silver (SLV) are on Hold. GLD and SLV could regain favor as regulation makes its way into crypto markets.
SPDR Utilities (XLU) was our first position added to the portfolio in advance of the “Worst Months.” XLU made a seasonal low nearly on perfect cue this year and had been rallying nicely until around mid-April. Since then it appears to be consolidating recent gains. XLU is on Hold.
All other positions are currently on Hold. Please see table for current stop losses.
Tactical Seasonal Switching Strategy Portfolio Update
In accordance with our Seasonal MACD Sell for DJIA and S&P 500 that triggered on the close of April 22, SPDR DJIA (DIA) and SPDR S&P 500 (SPY) positions have been closed out of the portfolio using their respective average daily prices from April 23. DIA was closed out for a 19.9% gain and SPY a gain of 18.9%, excluding dividends and trading costs.
Half positions in iShares Core U.S. Aggregate Bond (AGG) and Vanguard Total Bond Market (BND) have been added to the portfolio. AGG and BND both opened below their buy limits on April 23 and were added using their respective average daily prices. AGG and BND can still be considered at current levels, up to their respective buy limits.
Invescos QQQ (QQQ) and iShares Russell 2000 (IWM) are on Hold. NASDAQ’s “Best Eight Months” lasts until the end of June and the earliest NASDAQ’s Seasonal MACD Sell can trigger is June 1.
The Tactical Switching Strategy Portfolio is essentially neutral at this time. Tech and small-caps have weakened recently, but historically more upside from both is likely. We have done some selling, but we will not be going away. Instead we have begun transitioning the portfolios to positions historically best suited to weather the “Worst Six & Four Months.”