|
Market at a Glance - 5/26/2022
|
|
By:
Christopher Mistal
|
May 26, 2022
|
|
|
|
5/26/2022: Dow 32637.19 | S&P 4057.84 | NASDAQ 11740.65 | Russell 2K 1838.24 | NYSE 15664.00 | Value Line Arith 8778.40
Seasonal: Bearish. June is the last month of NASDAQ’s “Best Eight Months.” In all years since 1950, June ranks #11 for DJIA and #9 for S&P 500, but in midterm years like this year, June is the worst month for DJIA and S&P 500 and second worst for NASDAQ. Average losses in midterm-year Junes range from 1.4% by NASDAQ to 1.8% for S&P 500.
Fundamental: Tepid. Q1 GDP was revised lower to a –1.5% annual rate. Inflation is proving sticky, persisting at multi-decade highs. Prices at the pump are at record highs for gas and diesel and continue to trend higher. Supply chain disruptions persist. Corporations are beginning to trim expansion plans and cutback on hiring. So far, employment data has held up, but negative factors are piling up. Surging mortgage rates are dampening the housing market. Russia and Ukraine are at war.
Technical: Bouncing. DJIA, S&P 500 and NASDAQ are all fighting to end their respective multi-week losing streaks. MACD indicator applied to all three has turned positive. Strong resistance is present and is likely to stall any rally. The first resistance to overcome is around 32500 for DJIA, 4100 for S&P 500 and 12500 for NASDAQ. Should these levels be recovered then the descending 50-day moving average becomes the next barrier. Current 50-day moving averages are around DJIA 33650, S&P 500 4280 and NASDAQ 12950.
Monetary: 0.75 – 1.00%. Interest rates are going higher with the Fed widely expected to hike another 0.50% at its next meeting on June 14-15. It is our belief that the market has largely already factored in the increase in rates. The next hurdle the market will need to clear will be the beginning of quantitative tightening (QT). The Fed is expected to begin reducing the size of its balance sheet on June 1. This will begin removing some of the liquidity that was pumped into the financial system through QE that only just ended in early March.
Psychological: Bearish. According to
Investor’s Intelligence Advisors Sentiment survey Bullish advisors stand at 28.2%. Correction advisors are at 31% while Bearish advisors numbered 40.8% as of their May 25 release. Bears have outnumbered bulls for four straight weeks and eight of the last twelve. Sentiment appears bearish, but the outright fear and panic historically observed around major market bottoms still seems to be absent.
|
June Outlook: Short Term Bounce, Midterm Low Later
|
|
By:
Jeffrey A. Hirsch & Christopher Mistal
|
May 26, 2022
|
|
|
|
Today was good day for the bulls, but the bear market does not appear over to us. When the market rallies and bounces around off bear market lows and commentary runs the gamut from permabear doomsayers to bottom callers it reminds us of the canny words our friend Dan Turov, who runs Turov on Timing wrote twenty-one years ago this week in Barron’s.
“Bear markets don’t act like a medicine ball rolling down a smooth hill. Instead, they behave like a basketball bouncing down a rock-strewn mountainside; there’s lots of movement up and sideways before the bottom is reached.”
For now, it looks like the market is set for one of those bear market bounces. MACD has rolled over to buy on all three of the major indexes (DJIA, S&P 500 and NASDAQ) for the first time in almost two months since our
Sell Signal. And it is both MACDs we track. The shorter-term 8-17-9 MACD Buy indicator and the longer-term 12-26-9 MACD Sell indicator have both turned positive on all three indexes.
In addition, if you take a look at the May Almanac and June Almanac on pages 48 and 58 of the 2022 Stock Trader’ Almanac you will notice the bullish tendency during the last few days of May and the first couple of June. For further detail on these days check the “Recent Market Probability Calendars” in the “Directory of Trading Patterns and Databank” on pages 123-130.
Ok, so how far can this bear market rally run? The level that jumps out at us is that February 24 intraday low on the first day of the Russian invasion of Ukraine. It also aligns with the March 14 low on NASDAQ Composite and NDX (NASDAQ 100 Index) as you can see in the chart below of the NDX.
This equates to about 4100 on the S&P 500 or about 5% from the recent low. 32500 on the Dow looks reachable. A bounce of 10% to NASDAQ 12500 and NDX 13000 is not inconceivable. It could run a bit higher depending on the index. This would be beneficial to our ETF positions in Invesco QQQ Trust (QQQ) and iShares Russell 2000 (IWM) and potentially lessen the loss when we get our NASDAQ Best 8 Months MACD Sell Signal, sometime on or after June 1.
In the other graph below comparing 2022 to 1962, 1970 and 1974 the S&P bounced about 10% in 1970 and 1962 from the respective May and June lows before retreating and retesting. Yes, May was the low in 1970, which would be great, but history rhymes it does not repeat exactly. And the bear market that ended on this day, May 26, in 1970 had lost 36% on the Dow and S&P from the high a year and a half prior in late 1968.
Technical Support Broken
But the reality of the situation is that support has been broken across the board. The chart below of our favorite leading benchmark NASDAQ 100 Index (NDX) has violated critical support levels at 13000 and 12250 and looks headed toward the old 2020 lows around 11000, which would be a 33.6% fall from its November 2021 high. NASDAQ Composite’s chart and scenario is similar. DJIA and S&P exhibit some more solid support at that 50%
Fibonacci retracement level we discussed two weeks ago around S&P 3500 and DJIA 27700, which would be a drop of about 27.0% for S&P and 24.7% for DJIA from their respective all-time highs.
![[NDX Chart]](/UploadedImage/AIN_0622_20220526_NDX.jpg)
Let’s turn to the midterm election year pattern for the S&P 500 we have been tracking all year. Since the
May Outlook we had to expand the lower range of the vertical access 6 percentage points to accommodate the market’s slide in May. 2022 continues to track the seasonal trend of midterm election years, especially the two more ominous patterns of 1st term midterm years and the 2nd year of new Democratic presidents with late Q2 lows and a retest or lower low in October.
But remember as we highlighted in last month’s outlook, in addition to this being the Worst Six Months of the year for DJIA and S&P (May-October) with NASDAQ’s Worst Four Months (July-October) around the corner, it is also the “Weak Spot of the 4-Year Cycle,” which runs through Q2-Q3 of the midterm. Since 1949 DJIA averages -1.2% over the two quarters and S&P averages -1.5%. NASDAQ averages a 5.0% loss during this weak spot.
However, now here comes the good news, this seasonal/cycle weakness sets up “The Sweet Spot of the 4-Year Cycle,” where the Dow and S&P average a gain of about 20% over the three-quarter span from Q4 midterm year to Q2 pre-election year – NASDAQ averages 29.3% in the sweet spot. This is why we call Midterm Election Year’s “A Bottom Pickers Paradise.” From the midterm low to the pre-election year high DJIA gains 46.8% and NASDAQ gains a whopping 68.2%!
1962, 1970, 1974 & 2022
When we discussed the
similarities of 2022 to previous years two weeks ago, we scrapped the 1960 comparison and added in 1962 and 1974. In the updated chart the market appears to be avoiding the May-1970-type low and shifting over to a trend that tracks the 1962 pattern closer. Both 1962 and 1970 experienced sharp late-May/early-June rallies. The market never looked back in 1970, but in 1962 the market hit its low toward the end of June with a significant retest in October.
The 1974 comparison is still a possibility, but it’s a longshot for us as 1974 was at the end of a long, nearly 2-year bear market on the heels of the Arab Oil Embargo and our exit from the Vietnam War. One could extrapolate some geopolitical comparisons of 2022 to 1974, but if anything, 2022 is at a much earlier stage.
Sizing up all the technical, fundamental, geopolitical, monetary, seasonal, cycle and sentiment analysis in our 5-Disciplines approach, summarized in our “Market at a Glance,” our best assessment is that after the bear market rally runs its course, the market will likely bounce along sideways, testing the lows, setting 2022 up for a prototypical midterm bottom hitting its low point in late Q3 or early Q4 in the August-October period, just ahead of the midterm elections. Then we rally off that low into the sweet spot and beyond to new highs. For now, support has been broken, stick to the system, cash is king and wait for the fatter pitch.
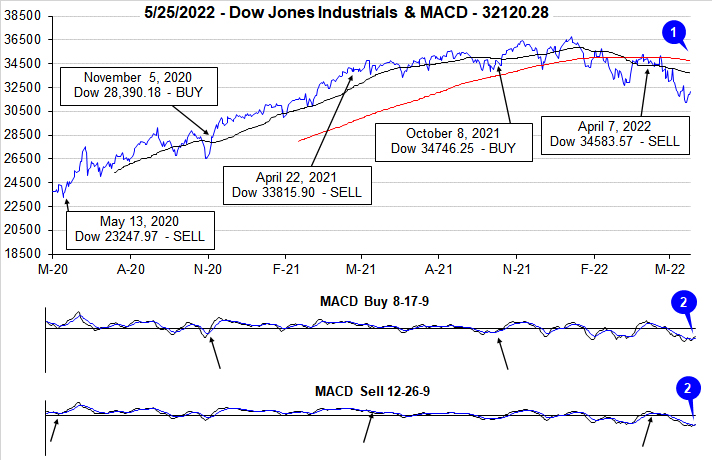
Pulse of the Market
DJIA’s April decline continued into May and at the closing low on May 19, DJIA was down 5.23% in May and down 13.99% year-to-date. As of May 25 close, DJIA was still below its 50- and 200-day moving averages (1). Bearishly the 200-day moving average is also declining. However, gains this week could be the beginning of a long overdue and much anticipated bounce. The faster and slower moving MACD indicators applied to DJIA (2) have just turned positive for the first time in over a month. Continued gains will be needed to keep both MACD indicators positive.
Early in May, DJIA logged its seventh Down Friday/Down Monday (DF/DM) of the year (3). Like many recent DF/DM occurrences, DJIA’s declines did not end. With seven months remaining in the year, DJIA has already matched its DF/DM count from all of last year. Thus far the average decline following a DF/DM this year has been 8% over the course of an average of 55 calendar days. As long as confidence remains low, and uncertainty is high, additional DF/DM’s are likely.
Last week DJIA recorded its eighth straight weekly loss. The current weekly losing streak is the longest since 1932 (4). The 1932 weekly losing streak also lasted eight weeks, but DJIA declined 36.6% over the course of the entire streak which is far worse than the 10.3% drop of the current streak as of May 20. DJIA would need to close below 31261.90 this Friday to extend the current streak. S&P 500 (5) and NASDAQ (6) are currently working to stave off extending their respective seven week losing streaks. The last time all three indexes declined seven weeks straight together was in March and April 1980.
NYSE Weekly Advancers and Weekly Decliners (7) have been consistent with the market’s overall declines. Decliners have outnumbered Advancers during the last four losing weeks. Should this week snap the current streak of down weeks, we would want to see Weekly Advancers outnumber Weekly Decliners by a solid margin, something greater than 2 to 1 would be encouraging and may suggest the bounce higher could persist longer.
It comes as no surprise that Weekly New Highs (8) have continued to decline. Over the past two weeks there has been a slight reversal in trend with New Highs inching higher while New Lows dropped significantly. A continued decline in New Lows accompanied by any amount of increase in New Highs would be welcome and expected if the current bounce can be sustained and become a meaningful rally higher.
Interest rates are currently feeling pressure at both ends of the duration spectrum. The Fed is firmly committed to raising short-term rates and the 90-day Treasury rate has been climbing steadily higher (9). On the other end, recession and growth concerns appear to be weighing on yields as the 30-year Treasury yield is still around 3% in spite of the Fed and inflation at multi-decade highs. The current trend suggests continued flattening of the yield curve which could put pressure on the financial sector.
|
June Almanac & Vital Stats: Worst Month of Midterm Year
|
|
By:
Jeffrey A. Hirsch & Christopher Mistal
|
May 19, 2022
|
|
|
|
Over the last 51 years June has shone brighter on NASDAQ stocks as a rule ranking fifth best with a 1.0% average gain, up 29 of 51 years. This contributes to NASDAQ’s “Best Eight Months” which ends in June. June ranks near the bottom on the Dow Jones Industrials just above September since 1950 with an average loss of 0.2%. S&P 500 performs similarly poorly, ranking ninth, but essentially flat (0.1% average gain). Small caps also tend to fare well in June. Russell 2000 has averaged 0.9% in the month since 1979.
![[Recent 21-Year June Seasonal Chart]](/UploadedImage/AIN_0622_20220519_Seasonal_June.jpg)
Over the last twenty-one years, the month of June has been a rather lackluster month for the market. DJIA, S&P 500 and Russell 1000 have all recorded average losses in the month. NASDAQ and Russell 2000 have fared better with modest average gains. Historically the month has opened respectably, advancing on the first and second trading days. From there the market then drifted sideways and lower into or near negative territory depending upon the index just ahead of mid-month. Here the market rallied to create a nice mid-month bulge that quickly evaporated and turned into losses. The brisk, post, mid-month drop is typically followed by a month end rally lead by technology and small caps.
![[Midterm Year June Performance Table]](/UploadedImage/AIN_0622_20220519_Midterm_June_stats_mini_table.jpg)
In midterm years since 1950, June ranks no better than eleventh. June is the worst DJIA, S&P 500 and Russell 1000 month in midterm years. Average losses range from 1.5% by Russell 1000 to 1.8% from S&P 500. Of the five indexes, none has a winning track record in June. DJIA and S&P 500 have declined more than they have risen.
The second Triple Witching Week of the year brings on some volatile trading with losses frequently exceeding gains. On Monday of Triple-Witching Week the Dow has been down fourteen of the last twenty-five years. Triple-Witching Friday is somewhat better, Dow has been up ten of the last nineteen years, but down six of the last seven. Full-week performance is choppy as well, littered with greater than 1% moves in both directions. The week after Triple-Witching Day is horrendous. This week has experienced DJIA losses in 27 of the last 32 years with average losses of 1.0%. NASDAQ and Russell 2000 had fared better during the week after, but that trend appears to be fading.
![[June Vital Stats Table]](/UploadedImage/AIN_0622_20220519_June%20_2022_Vital_Stats_table.jpg)
June’s first trading day is the Dow’s best day of the month, up 27 of the last 34 years. Gains are sparse throughout the remainder of the month until the last three days when NASDAQ and Russell 2000 stocks begin to exhibit strength. The last day of the second quarter was a bit of a paradox as the Dow was down 17 of the last 31 (however, up 9 of the last 11) while NASDAQ and Russell 2000 have nearly the opposite record. NASDAQ has been up 21 of the last 30.
Beginning this year, the market will observe Juneteenth National Independence Day on June 20. The holiday officially falls on June 19 every year, but NYSE rules shift its observance to Monday this year. As this is the first year the market will be closed in observance of this new Federal holiday, no stats are presently available. The holiday’s proximity to quarterly options expiration and Father’s Day, could lead to some additional volatility ahead of the long weekend.
|
June 2022 Strategy Calendar
|
|
By:
Christopher Mistal
|
May 19, 2022
|
|
|
|
|
Picking Downside Targets May Be a Futile Effort
|
|
By:
Jeffrey A. Hirsch
|
May 12, 2022
|
|
|
|
We used to have a sign in the old office about picking downside targets. It said one thing, don’t do it. Several support levels we have highlighted over the past few months have been either violated or are under attack. So even though picking downside targets may be a futile effort, here are some levels we’ve been looking at.
S&P 500 1962, 1970 & 1974 Compared to 2022
In the
May Outlook: Midterm Bottom on the Horizon we compared the similarities of the market action this year to 1960 and 1970. This disturbing comparison is not abating. Two other comparable bear market years have also come to light. 1962 and 1974: both midterm years with similar chart patterns. In the chart below 1960 was removed since the year held the March low until September and it was an election year.
Like 2022 geopolitics plagued 1962 with Cold War machinations and the Cuban Missile Crisis, but rates, inflation and oil prices were nothing like 2022. 1974 on the other hand had it all: negative Q1 GDP, high inflation, Oil Crisis and war in the Mideast.
March 2021 Lows
The market smashed through support at the February 24 intraday lows and now support at the March 2021 lows has been breached by NASDAQ and NASDAQ 100 (NDX), the benchmark we have been tracking of late. S&P 500 and DJIA have not broken below their respective March 2021 lows around 3750 and 31000 respectively, but they both flirted with them today.
This brings support at the 2020 September/October lows into play, which is even clearer on the S&P weekly chart below. NASDAQ and NDX are practically there already. Notice how the March 2021 NDX low support also lines up with the top of the W-123 swing bottom pattern in September/October 2020.
Fibonacci Retracement Levels
S&P 500 rallied 114% from the March 2020 pandemic low to the January 4, 2022, all-time-high. Using the technical analysis Fibonacci retracement sequence shows that S&P has just about traced out the 38.2% retracement at 3800. The 50% retracement around 3500, which sits near the top of that fall-2020 swing bottom, looks in play as does the 61.8% retracement level around 3200 near the pre-pandemic highs.
Where it bottoms is anyone’s guess. We have relayed some of ours. Bottoms are not necessarily a technical level on chart or fundamental valuation, they are a perception, an exhaustion of selling. There are still too many bottom callers out there. When we start hearing, “should I sell, should I sell,” that’s more likely the bottom. Perhaps it’s when somebody big blows up or goes bankrupt. When the market harpoons a big whale. Maybe a crypto guy, a hedge fund like Long Term Capital Management or big public company like Enron or investment bank like Lehman.
Whatever it is that creates or signals the bottom we still expect a classic midterm bottom over the next several months. It could be here in May like 1970 or it could come in October like 1962 and 1974 and so many others or somewhere in between. Either way, patience and fortitude are in order presently. Stick to the system. Our April 7 MACD Sell Signal was fortuitous, and our stops took care of most of the rest. For now, cash is still king as we wait for that fatter pitch.
|
Stock Portfolio Updates: Remain Patient, Cash is King
|
|
By:
Christopher Mistal
|
May 12, 2022
|
|
|
|
In an effort to further refine our 2022 Outlook, we have taken a look at the market’s historical response to changes in the Fed Funds Rate. Using Federal Funds Effective Rate data, available at
St. Louis Fed’s FRED database, since July 1954, we have compiled the following charts. The first two charts of the S&P 500 and NASDAQ offer of quick comparison of a few basic scenarios. Based upon the annual change in Fed Funds Effective Rate, data was grouped into three categories: Higher, Lower, and No Change (NC). For NC, a range of plus/minus 0.2% was used. The All line represents all years in the data set.
On average, it would appear as though changes in Fed Funds Rate generally did not have a significant effect on the S&P 500 or NASDAQ. Years where Fed Funds Rate did not change or changed less than +/- 0.2%, historically performed the best. On average S&P 500 averaged just under 12% for the full year while NASDAQ averaged over 25%. The most recent year to fall into this category was 2021.
Higher Years and Lower Years failed to show any substantial deviation versus All Years. This was a somewhat surprising result considering the biggest increase in one-year rates was 7.23% (from 14.77% at the end of 1979 to 22.00% at the end of 1980). In 1980 the S&P 500 gained 25.8% and NASDAQ rose 33.9%. The largest one-year decrease in rates was 8.87% (from 22.00% at the end of 1980 to 13.13% at the end of 1981). In 1981, S&P 500 declined 9.7% and NASDAQ fell 3.2%.
In these next two charts we expanded the number of categories that a given year could fall into based upon the magnitude and direction of the change of Fed Funds Rate. No Change is the same range used previously, from -0.2% to +0.2%. 1% includes any year where the rate increased more than 0.2% but not more than 1%. The 2% group covers 1% to 2% while any increase exceeding 2% went into the >2% group.
With this approach one group easily stands out while the rest still exhibited relatively subtle changes. Years in which Fed Funds Rate was cut by 2% or more, were a disaster on average. Which is consistent with current Fed practice of rapidly lowering Fed Funds Rate in response to adverse economic conditions. These years were 1974, 1981, 1987, 1990, 2001, 2007 and 2008. Prior to the Covid-19 Pandemic, Fed Funds had declined in 2019 and was only cut 1.46% in 2020 (1.55% at yearend 2019 to 0.09% at yearend 2020).
NASDAQ appears to perform best when rates are unchanged or modestly lower (no more than a 2% drop in a year). S&P 500 also appears to favor unchanged to modestly lower rates but appears to be more resilient when annual increases were less than 2%. Interest rates do play a role in the markets overall performance, but it is not the only factor. Employment, overall economic growth, inflation, and taxes all impact corporate earnings. Sentiment and momentum can also drive prices to levels (up and down) that may appear to have little to no connection to reality. The market has entered the Weak Spot of the 4-Year Cycle, inflation is still at multi-decade highs, the Fed is tightening, sentiment is bearish and support levels are not holding. Continue to be patient as the Weak Spot will eventually give way to the Sweet Spot of the 4-Year Cycle sometime later in Q3 or early Q4.
Stock Portfolio Updates
Over the last four weeks since last update through yesterday’s close, S&P 500 declined 11.5% while Russell 2000 dropped 15.2%. Over the same time period the entire stock portfolio slipped 2.8% lower, excluding dividends and any fees. The overall portfolios sizable cash balance is what held declines at bay. Cash is now 74.7% of the total portfolio. This is not a target; it is the result of heeding stop losses and closing out Free Lunch positions along with the seasonal overlay applied to the portfolio.
When cash is excluded and stock-only holdings are reviewed, Large caps held up best, off 6.7%. Small-cap holdings slide 9.1% and Mid-caps fell by 13.0%. In total five positions were stopped out over the last four weeks. Housing market related North American Construction (NOA) and Sterling Construction (STRL) were stopped out of the Small-cap portfolio this month. Material costs and briskly rising mortgage rates are likely the main reasons.
Pacira BioSciences (PCRX) was stopped out on May 9. PCRX had been bucking the broad market trend this year with solid gains, but earnings apparently were a bit of a disappointment for already “on edge” investors. Sizable increases in expenses and R&D spending were not received well either.
Abbott Labs (ABT) was also stopped out earlier this month. Shares had been struggling for most of the year in a slow downward trend. ABT’s involvement in the mounting baby formula crisis has likely also spoiled some investor’s moods. Lastly, Infosys (INFY) was stopped out one day after last months update.
All other positions are on Hold. Please see the table below for updated stop losses and current advice for positions not covered above.
|
ETF Trades: Best Performing Sectors of the “Worst Six Months”
|
|
By:
Christopher Mistal
|
May 05, 2022
|
|
|
|
Let’s put aside the market’s recent volatility for a moment and instead focus on some tactical adjustments that can be made in portfolios to take advantage of what has actually worked during past “Worst Six Months” while considering either shorting or outright avoiding what does not work all that frequently.
In the following table, the performance of the S&P 500 and NASDAQ during the “Worst Six Months” May to October is compared to fourteen select sector indices or sub-indices, gold and the 30-year Treasury bond. Nine of the fourteen indices chosen are S&P Sector indices. Gold and 30-year bond are continuously-linked, non-adjusted front-month futures contracts. With the exception of two indices, 1990-2021, a full 32 years of data was selected. This selection represents a reasonably balanced number of bull and bear years for each and a long enough timeframe to be statistically significant while representing current trends. In an effort to make an apple-to-apple comparison, dividends are not included in this study.
![[Various Sector Indices & 30-Year Treasury Bond versus S&P 500 during Worst Six Months May-October Since 1990 table]](/UploadedImage/AIN_0622_20220505_Best-Sectors_Worst-Months_Table.jpg)
Using the S&P 500 as the baseline by which all others were compared, five indices and the 30-year Treasury bond outperformed during the “Worst Six Months” while ten others and gold underperformed based upon “AVG %” return. At the top of the list are Biotech and Information Technology with average gains of 7.57% and 5.38% during the “Worst Months.” However, before jumping into Biotech positions, only 27 years of data was available and, in those years, Biotech was up just 55.6% of the time from May through October. Some years, like 2014, gains were massive while in down years losses were frequently nearly as large.
![[Biotech mini-table]](/UploadedImage/AIN_0622_20220505_Biotech.jpg)
Runner-up, Information Technology with 32 years of data and a 71.9% success rate is probably less risky choice than Biotech. Its 5.38% AVG % performance comes by way of three fewer losses in five additional years of data. However, five of the nine losses were double digit. The worst loss was 30.88% in 2008. Other double-digit losses were in 1990, 2000-2002. Given this year’s NASDAQ weakness, it is likely best to avoid Information Technology this time around.
![[Information Technology mini-table]](/UploadedImage/AIN_0622_20220505_Info_Tech.jpg)
Other “Worst Six” top performers consisted mostly of the usual suspects when defensive sectors are considered. Healthcare, Consumer Staples and 30-year Treasury bonds all bested the S&P 500. Not surprisingly NASDAQ also performed well, advancing 75% of the time with an average gain of 5.12%. NASDAQ’s Best Eight Months include May and June, so it does have an advantage. Although not the best sector by AVG %, Consumer Staples advancing 81.3% of the time is the closest thing to a sure bet for a gain during the “Worst Months.” Of the six Consumer Staples declines over the last 32 years, only in the bear market years of 2002 and 2008 did the sector suffer a double-digit decline.
![[Consumer Staples mini-table]](/UploadedImage/AIN_0622_20220505_Consumer_Staples.jpg)
At the other end of the performance spectrum we have the sectors to consider shorting or to avoid altogether. The NYSE ARCA Natural Gas sector was the worst over the past 32 years, shedding an average 1.07% during the “Worst Six.” S&P 500 Materials was second worst by average performance, off 1.06%. NYSE ARCA Oil & Gas also recorded an average loss. However, based solely upon the percentage of time up, the stocks only, PHLX Gold/Silver index is the most consistent loser of the “Worst Six” advancing just 40.6% of the time. Aside from solid gains in 2012, 2019 and 2020, PHLX Gold/Silver has declined in eight of the last eleven “Worst Six Months.”
![[PHLX Gold/Silver mini-table]](/UploadedImage/AIN_0622_20220505_Gold-Silver_Stocks.jpg)
Also interesting to note is the fact that every sector, gold and 30-year bonds are all positive in May, on average. It’s not until June when things begin to fall apart for many sectors of the market and the market as a whole. July tends to see a broad bounce, but it tends to be short-lived as August and September tend to be downright ugly on average. It is this window of poor performance that has given October a lift in the past 32 years. Only Biotech, 30-year bonds and gold (futures and gold & silver stocks) manage to post gains in both August and September.
Based upon “% Up” during the “Worst Six Months,” Consumer Staples and Utilities look like the best place to be while Gold/Silver mining stocks (XAU) and Materials could be shorted or avoided all together. Historically speaking, May also looks like a great time to rebalance a portfolio as you will likely be closing out long positions into strength and short trade ideas are worth considering given June’s nearly across-the-board poor performance.
Sector Rotation ETF Portfolio New Trades & Update
While considering the above and reviewing the current holdings of the Sector Rotation portfolio, updated with yesterday’s close we will look to establish a new position in SPDR Consumer Staples (XLP). The existing position was sold on April 21 when it traded above its Auto-Sell price of $80.53 for an 18.7% gain. A new position in XLP can be considered on dips below $75.01. If purchased an initial stop loss of $70.00 is suggested.
Additionally, we will add to the existing position in SPDR Utilities (XLU), the second-best sector during the “Worst Months” based upon frequency of gains. XLU can be considered on dips below $68.44. If purchased set a stop loss at $65.00.
First Trust Natural Gas (FCG) was another good trade for the portfolio. FCG traded above its Auto-Sell price on April 18 of $26.97 and was subsequently closed out for a gain of 36.6%. Natural gas has surged in recent months, but it appears momentum is fading. The associated favorable Sector Seasonality also comes to an end in early June.
Given the weak backdrop of April this year, it is not surprising that two other positions were recently closed out. GlobalX Copper Miners (COPX) was stopped out on April 22 when it closed below its stop loss. Excluding any dividends and trading costs, COPX logged a 5.9% gain when sold. iShares DJ US Tech (IYW) was also stopped out in April. Tech has been leading the market lower essentially all year long after leading it higher throughout 2020 and 2021. IYW was closed out for a loss of 8%. SPDR Technology (XLK) has held up modestly better and is on Hold.
In hindsight, we were obviously early to start accumulating a position in SPDR S&P Biotech (XBI). It was off sharply again today and at today’s close it has effectively given back all of its gains since March/April 2020. Rising interest rates are likely to make it more challenging for many of the development stage companies held by XBI, but we are going to maintain a longer-term timeframe. XBI is on Hold.
Tactical Seasonal Switching Strategy Portfolio Update
Yesterday’s gain provided a small, yet brief reprieve to the portfolio following the disastrous results of April. The earliest NASDAQ’s (and Russell 2000) “Best Eight Months” can officially end is on June 1. In recent years these positions have been underwater at some point during the “Best Months” only to rally and record a gain. Most recently, the “Best Months” of 2019-2020, but before that there was also 2018-2019 and in 2015-2016. Although the window for a rally is closing, there is still a window. QQQ and IWM are on Hold.
Treasury bond yields are ahead of Fed rate hikes and could easily reach a peak before the Fed finishes increasing its rate. Recession concerns could also quickly halt and reverse bond ETF weakness. TLT, AGG and BND are on Hold.