|
Market at a Glance – June 26, 2025
|
|
By:
Christopher Mistal
|
June 26, 2025
|
|
|
|
Please take a moment and register for our members’ only webinar, July 2025 Outlook & Update on Wednesday July 2, 2025, at 4:00 PM EDT here:
Please join us for an Almanac Investor Member’s Only discussion of recent market action with time for Q & A at the end. Jeff and Chris will cover their outlook for July 2025, NASDAQ's Best Eight Months, review the Tactical Seasonal Switching Strategy ETF, Sector Rotation ETF, and Stock Portfolio holdings and trades. We will also share our assessments of the economy, tariffs, Fed, inflation, geopolitical events as well as relevant updates to seasonals now in play.
If you are unable to attend the live event, please still register. Within a day of completion, we will send out an email with links to access the recording and the slides to everyone that registers.
After registering, you will receive a confirmation email containing information about joining the webinar and a reminder message.
Market at a Glance
6/26/2025: Dow 43386.84 | S&P 6141.02 | NASDAQ 20167.91 | Russell 2K 2172.11 | NYSE 20256.20 | Value Line Arith 11225.79
Seasonal: Neutral. July is the first month of NASDAQ’s “Worst Months,” but over the last 21 years it has been the #1 NASDAQ month and #2 for DJIA and S&P 500. In post-election years, July is #1 for DJIA and S&P 500 and #2 for NASDAQ. Most of July’s gains usually occur in the first half of the month. NASDAQ’s Midyear “Christmas in July” rally ends around July 14.
Fundamental: Mixed. Q1 GDP was surprisingly revised 0.3% lower to –0.5% after being previously revised higher. Atlanta Fed’s GDPNow model’s forecast for Q2 GDP has retreated to 3.4% as of its June 18 update but is still a brisk rebound from Q1. May’s employment report was softer with 139,000 monthly job gains while the unemployment rate held steady at 4.2%. Geopolitical tensions have eased with a ceasefire between Israel and Iran, but Gaza, Ukraine-Russia, and various paused tariff deadlines remain.
Technical: Breaking Out? NASDAQ 100 is trading at new all-time highs. S&P 500 and NASDAQ Comp traded above their respective old all-time closing highs today. DJIA is modestly lagging behind but appears to also be on track to at least test its previous highs. Technology is clearly leading once again. This year’s NASDAQ Midyear rally is likely to provide opportunities for additional new all-time highs.
Monetary: 4.25 – 4.50%. Another meeting has passed with no change in interest rates or overall policy. After being late to raise rates as inflation soared in 2021 and 2022, it is looking increasingly likely that the Fed will be late to cut as well. The Fed’s concern about the impact of tariffs may be out of place as the tariffs would be a one-time price increase and would likely be transitory. The consensus for two interest rate reductions later this year is increasingly looking less likely, barring some new “crisis” to compel Fed action.
Sentiment: Neutral. According to
Investor’s Intelligence Advisors Sentiment survey Bullish advisors stand at 38.8%. Correction advisors are at 32.6% and Bearish advisors were at 28.6% as of their June 24 release. The relatively low number of Bullish advisors with the major indexes creeping closer to record highs, suggests the rally can easily continue as long as headlines remain subdued. When the crowd turns bullish and the fear of missing out kicks in, it will be time to be more concerned about sentiment. Until then, sentiment appears supportive of further market gains.
|
July Outlook: Risk Cools, Midyear Rally to New Highs Before Q3 Pullback
|
|
By:
Jeffrey A. Hirsch & Christopher Mistal
|
June 26, 2025
|
|
|
|
The midyear rally got off to an early start this week. De-escalation in the Middle East following the U.S. strikes on the Iranian nuclear infrastructure has reduced geopolitical risk. The fragile ceasefire in the Israel-Iran conflict appears to be holding. By no means do we assume that the threat of turmoil is over in the Mideast. If left unchecked, it is highly likely Iran will quietly try to reconstruct its nuclear capabilities. All eyes will be on this nascent ceasefire, activity from other factions, more detailed and conclusive intelligence reports on the damage, Iran’s stance on inspections, diplomatic progress, and a lasting resolution on Gaza.
But from what we can ascertain from some friends on the ground and other anecdotal observations there is real optimism in the region that longer term things are changing for the better. People are beginning to return to normal routines in Tehran and Tel Aviv. Commercial air traffic has resumed. No missiles have been fired into Israel since the ceasefire. Much still needs to be solidified in the region, but the market’s continued positive momentum suggests peaceful resolution is in the air.
Tariff and trade war fears have also subsided as inflation continues to moderate, and GDP is expected to rebound in Q2 after retracting in Q1. Other key global economies also continue to show resilient growth. Despite criticism from both MAGA stalwarts and Democrats the Trump administration appears to be on a run of successes. After the decisive strikes and U.S. brokered ceasefire President Trump was also able to persuade NATO members to push up their defense spending at the summit this week. But will this recent success translate into quick tariff solutions and the passing of his One Big Beautiful Bill? Remains to be determined.
As the fog of overlapping risks seems to be lifting, for the short term at least, the market is poised to hit new all-time highs. In fact, the NASDAQ 100 Index has closed at new highs the past two days. S&P 500 and the NASDAQ Composite traded at new highs intraday today and closed within a hair of them. As you can see from the S&P 500 Post-Election Year Seasonal Pattern chart below, the midyear rally we have been expecting looks like it’s in full force. However, the historically weak seasonality of August and September looms large on this chart as well. Should this weak seasonal period coincide with any setbacks on tariffs or the Big Beautiful Bill or the ceasefire and Mideast diplomacy efforts or other geopolitical hotspots the usual Q3 seasonal pullback could be steeper.
Look for Pullback After Down April Up May & June
With two trading days left in June S&P 500 is up 3.9% month-to-date. This follows a tumultuous month for the market that ended with April in the red. We have tabulated all the years since 1950 when the S&P was down in April but up in both May and June. All but one of these eight years, 2024, suffered a loss in either July, Q3 or Q4. And you will remember last year’s 10% S&P correction from July 16 to August 7. 1986 and 1987 both suffered losses over the last six months of the year, but unlike 2025 both had huge Q1 gains and were up substantially at midyear, whereas 2025 is still flat with S&P up 4.4% year-to-date. This bodes well for the rest of 2025 with more new highs into July followed by a likely pullback in the August/September timeframe and then a Q4 rally.
NASDAQ Best 8 Months MACD Sell Update
As of the close today, June 26, NASDAQ’s Seasonal MACD indicator was still negative, but it will turn positive on Friday, June 27 as long as NASDAQ does not decline 131.20 points (–0.65%) or more. It has been negative since May 30. The criteria we use to issue our NASDAQ Seasonal MACD sell is a new negative crossover of MACD (using 12-26-9 parameters) on or after the first trading day in June. Because NASDAQ’s MACD indicator was negative at the start of June, it still needs to turn positive first. Continue to hold associated positions in QQQ and IWM.
When NASDAQ’s Seasonal MACD registers a new negative crossover, we will send an email to all active members. At that time, we will finish repositioning our Portfolios for the “Worst Months.” We do anticipate adding to existing bond ETF and cash holdings in the Tactical Seasonal Switching Strategy portfolio and will also consider adding additional positions in the stock portfolio.
With the market clearly pushing to break out to new all-time highs, technicals are looking rather solid while fundamentals remain mixed though with rays of hope. A new all-time high for NASDAQ 100 is pulling NASDAQ Composite and S&P 500 back up near new highs. DJIA, S&P 500, and NASDAQ are all positive YTD. Russell 2000 is still lagging but rallying strong off the April lows. The Midyear rally started a few days early but appears to be working well.
Inflation is still cooling, but the Fed appears fearful of making another cut too soon. Geopolitical risk is improving with the Israel-Iran shooting war over for now or at least paused but the nascent ceasefire is still tentative, and we still have the war in Ukraine and tension in the Pacific rim. Ride the rally for now, but beware the Q3 seasonal weakness and heed the NASDAQ seasonal sell signal when it triggers and reposition to a more cautious stance.
Pulse of the Market
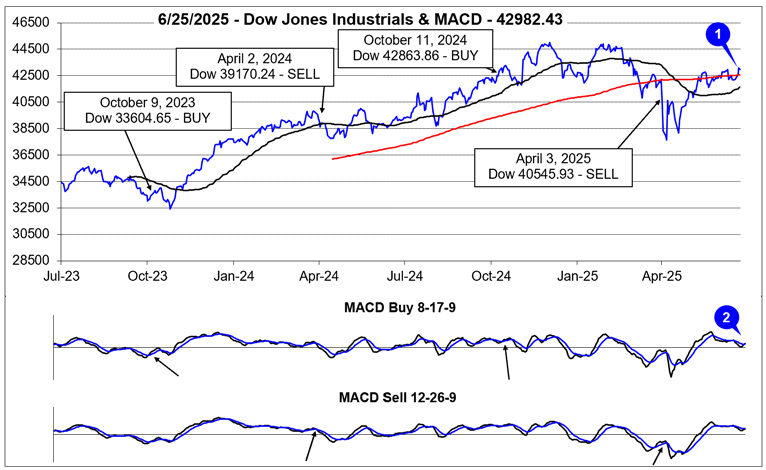
Until this week, DJIA had been treading water around its 200-day moving average. DJIA now appears to be making a decisive move higher as it participates in NASDAQ’s midyear rally (1). DJIA’s 50-day moving average is also climbing and trending back towards a traditionally bullish golden cross. A golden cross occurs when the 50-day moving average crosses back above the 200-day moving average. The return of positive momentum is being confirmed by DJIA’s faster moving MACD Buy indicator turning positive (2) on June 25. Today’s gains also turned DJIA’s slower moving MACD positive.
Daily volatility and chop have retreated significantly since early April, but the market’s weekly performance is still reflecting elevated uncertainty. Over the past 20 weeks, DJIA, S&P 500, and NASDAQ have not recorded a weekly winning streak of three or more weeks. DJIA last logged three positive weeks in a row in January of this year. For S&P 500 and NASDAQ you have to go back to November/December of last year. Provided this week’s gains hold through the close on Friday, DJIA (3) and NASDAQ (5) will be up three of the last four weeks while S&P 500 (4) will have one less advancing week.
Weekly market breadth (6) had shifted somewhat bearishly over the last two weeks through June 20 with Weekly Decliners outnumbering Weekly Advancers. Based upon gains thus far, weekly breadth will likely favor the bulls once again this week. As the indexes approach record highs, it would be encouraging to see Weekly Advancers continue to increase. This would increase the odds that the breakout would hold.
Weekly New 52-week Highs (7) remain stuck under 200. Here again it would be a plus if Weekly Highs could also steadily expand. When the broad market does reach record levels again, New Highs should be growing quickly, if not, further upside could be limited. New 52-week Lows have remained at low levels. Lower would be better, but at least the current rally has been lifting most stocks.
After a single week above 5%, the 30-year Treasury bond yield (8) has been slowly retreating. Modestly lower Treasury yields are providing some support to the stock market and likely reflect recently released modestly softer inflation, employment, and growth data. As long as yields drift sideways to lower the market is likely to continue to climb higher. A brisk reversal in yields would likely have the opposite effect.
|
July Almanac & Stats: Top DJIA And S&P 500 Month of Post-Election Years
|
|
By:
Jeffrey A. Hirsch & Christopher Mistal
|
June 19, 2025
|
|
|
|
NASDAQ Seasonal MACD Update
As of the close on June 18, NASDAQ’s Seasonal MACD indicator was still negative. It has been negative since May 30. The criteria we use to issue our NASDAQ Seasonal MACD sell is a new negative crossover of MACD (using 12-26-9 parameters) on or after the first trading day in June. Because NASDAQ’s MACD indicator was negative at the start of June, it still needs to turn positive first. It would take a single-day advance of 880.42 NASDAQ points (+4.50%) to turn MACD positive. Continue to hold associated positions in QQQ and IWM.
When NASDAQ’s Seasonal MACD registers a new negative crossover we will send an email to all active members. At that time, we will finish repositioning our Portfolios for the “Worst Months.” We do anticipate adding to existing bond ETF and cash holdings in the Tactical Seasonal Switching Strategy portfolio.
July Almanac & Vital Stats
July historically is the best performing month of the third quarter, however historically tepid August and September tend to make the comparison easy. “Hot” Julys in 2009 and 2010 where DJIA and S&P 500 both gained greater than 6% combined with strong performances in 2013, 2018, and 2022, have boosted July’s average gains since 1950 to 1.4% and 1.3% respectively. DJIA, S&P 500, and Russell 1000 have been up ten straight Julys (2015-2024). NASDAQ declined 0.8% in July 2024, ending its streak of July gains at nine in a row. Russell 2000 has been up eight times in the same period (down in 2015 and 2021). Such strength inevitability stirs talk of a “summer rally”, but beware the hype, as it has historically been the weakest rally of all seasons (page 76, Stock Trader’s Almanac 2025).
July begins NASDAQ’s worst four months but is also the seventh best performing NASDAQ month since 1971, posting a 0.9% average gain. Dynamic trading often accompanies the first full month of summer as the beginning of the second half of the year tends to bring an inflow of new capital. This creates a bullish beginning, middle, and a mixed/flat second half. On average, over the last 21 years, nearly all of July’s gains have occurred in the first 13 trading days. Once a bullish day, the last trading day of July has had a bearish bias over the last 21 years. In post-election years since 1950, July has exhibited a similar pattern to the recent 21-year period.
![[Recent 21-Year July Market Performance (2004-2024) Seasonal Pattern Chart]](/UploadedImage/AIN_0725_20250619_July_2025_Seasonal.jpg)
July’s first trading day is the third best performing first trading day of all twelve months with DJIA gaining a cumulative 1729.68 points since 1998. Over the past 21 years, DJIA’s first trading day of July has produced gains 81.0% of the time with an average advance of 0.35%. S&P 500 has advanced 90.5% of the time (average gain 0.44%). NASDAQ has been similarly bullish advancing 85.7% of the time (0.50% average gain). No other day of the year exhibits this amount of across-the-board strength, which supports the case for declaring the first trading day of July the most consistently bullish day of the year over the past 21 years. Although, the third-from-last day of August is rising to challenge this title.
Trading on the day before and after the Independence Day holiday is often lackluster. Volume tends to decline on either side of the holiday as vacations begin early and/or finish late. Since 1980, DJIA, S&P 500, NASDAQ and Russell 2000 have recorded net losses on the day after (page 102, STA 2025).
Post-election-year July rankings are stellar, ranking #1 for DJIA and S&P 500, averaging gains of 2.1% and 2.2% respectively (since 1950). For NASDAQ (since 1971) post-election-year Julys rank #2 with an average gain of 3.2%. July ranks #3 in post-election years for Russell 1000 and 2000 since 1979.
|
July 2025 Strategy Calendar
|
|
By:
Christopher Mistal
|
June 19, 2025
|
|
|
|
|
NASDAQ MACD & Stock Portfolio Updates: NASDAQ’s Midyear Rally
|
|
By:
Christopher Mistal
|
June 12, 2025
|
|
|
|
Even after modest declines on June 11, the major indexes are still on track for above average post-election-year June gains. Historically, NASDAQ and Russell 2000 have outperformed in June and this year that tradition appears to be holding up once again. The biggest winner so far this June has been the small-cap Russell 2000, up nearly 4% as of the close on June 11. NASDAQ is second best with a solid 2.6% advance. DJIA, S&P 500, and Russell 1000 were up 1.4% to 1.9%.
With mid-June approaching, and positive momentum beginning to show signs of waning, the market could be headed toward a brief bout of weakness as indicated in the above chart. However, any weakness, particularly from NASDAQ, could be an excellent setup ahead of its typical midyear rally.
Christmas in July: NASDAQ’s 12-Day Midyear Rally
Tech’s influence in the market continues to grow and the market’s focus in early summer often shifts to the outlook for second quarter earnings of technology companies. In anticipation of positive results, over the last three trading days of June and the first nine trading days in July, NASDAQ typically enjoys a rally. This 12-trading-day run has been up 31 of the past 40 years with an average historical gain of 2.5%. Look for this rally to begin around June 26 and run until about July 14.
After the bursting of the tech bubble in 2000, NASDAQ’s mid-year rally had a spotty track record from 2002 until 2009 with three appearances and five no-shows in those years. However, it has been quite solid over the last fifteen years, up thirteen times with two losses. After struggling during the bear market in 2022, NASDAQ resoundingly snapped back the past two years recording gains of 4.1% and 3.8% in 2023 and 2024 respectively during its 12-day midyear rally.
NASDAQ Seasonal MACD Update
As of today’s close, NASDAQ’s Seasonal MACD indicator is still modestly negative. It has been negative since May 30. The criteria we use to issue our NASDAQ Seasonal MACD sell is a new negative crossover of MACD (using 12-26-9 parameters) on or after the first trading day in June. Because NASDAQ’s MACD indicator was negative at the start of June, it still needs to turn positive first. It would take a single-day advance of 305.79 NASDAQ points (+1.56%) to turn MACD positive. Continue to hold associated positions in QQQ and IWM.
![[NASDAQ Daily Bar Chart and MACD]](/UploadedImage/AIN_0725_20250612_NASDAQ_MACD.jpg)
The optimal situation would be for NASDAQ to continue to track its typical post-election year June seasonal pattern, realize its typical midyear rally, and then have a MACD crossover. When NASDAQ’s Seasonal MACD turns negative we will send an email to all active members. At that time, we will finish repositioning our Portfolios for the “Worst Months.” We do anticipate adding to some existing bond ETFs and cash holdings in the Tactical Seasonal Switching Strategy portfolio at that time.
Stock Portfolio Updates
Over the past four weeks, through the close on June 11, the Almanac Investor Stock Portfolio advanced just 0.1%, excluding dividends, compared to a 2.2% advance by S&P 500 and a 3.1% gain by Russell 2000. Overall performance was limited by the sizable cash balance in the portfolio. Ignoring the cash balance, Large Caps were the only advancing group on average, up 3.9%. Mid-Caps as a group retreated 0.5% while the lone small-cap stock slide 8.3%.
AT&T (T) is on Hold. For being an old, boring telecom company, T is up an impressive 27.4% year-to-date as of its June 11 close. T is also bullishly trading less than 3% below its early April 52-week high, but a breakout may not be in the cards until the Fed cuts interest rates, and/or the 10-year Treasury bond yield moves decisively lower.
Emcor Group (EME) is on Hold. Shares of EME have slipped modestly since the first week of June but remain higher than they were four weeks ago. EME has benefited from the rapid AI buildout, and it also appears to be much more diversified in the engineering and construction spaces. Likely rising material costs and a potential slowing of AI-related spending are near-term headwinds to the company. Given the company’s track record, we suspect they will eventually overcome the headwinds.
ICICI Bank (IBN) is on Hold. Over the past four weeks IBN is effectively unchanged. This is actually somewhat encouraging as the truce between India and Pakistan following brief conflict in April has been shaky. Tensions between the two likely need to ease further before investors and traders are willing to consider additional purchases.
Super Micro Computer (SMCI) is on hold. As interest in AI resumes, it would appear confidence in SMCI may be returning as well. After jumping higher in mid-May, SMCI did briefly pullback to under $40 per share but did not close below that level. It would be encouraging to see this support level hold and for share volatility to decline further.
OSI Systems (OSIS) is on hold. After a period of consolidation, OSIS did break out to additional new all-time highs yesterday, June 11. At the close, it was up 62.3% since being added to the portfolio last October. Should the broader market take pause, OSIS could also take a breather.
HealWell AI (HWAIF) can still be considered on dips below its buy limit of $1. Shares have been relatively quiet since HWAIF completed their acquisition of Orion Health however, management appears to be moving quickly to take advantage of the new markets the deal provided access to. The biggest being the U.S., where HWAIF just released a new suite of AI enabled tools that are intended to complement Orion’s existing offerings. Additional patience will likely be needed, but HWAIF does appear on course for a positive future.
All other positions in the portfolio are on Hold. Please note some stop losses have been updated to account for recent market moves.
Disclosure note: Officers of Hirsch Holdings Inc held positions in HWAIF in personal accounts.
|
ETF Portfolios & NAS MACD: New Int’l Trades & Consolidation Underway
|
|
By:
Christopher Mistal
|
June 05, 2025
|
|
|
|
In case you missed the member’s only webinar on Wednesday, June 5, the slides and video recording are available
here (or copy and paste in a new browser window:
https://www.stocktradersalmanac.com/LandingPages/webinar-archive.aspx). In the webinar Jeff reviewed key seasonal pattern charts that we have been tracking throughout the year, current GDP and inflation trends, Fed interest rate expectations, and the status of NASDAQ’s Seasonal MACD indicator which has
NOT triggered yet. More detail on the current status of the signal is below.
In addition, Jeff also reviewed the history of the S&P 500 following a
strong May performance (>3% advance in May). S&P 500’s 6.2% advance this May was indeed impressive, coming in at second best May gain going back to 1950. Only May 1990 was better when S&P 500 jumped 9.2%. But the solid gains in May do suggest the market could spend time in June trading flat or sideways as it consolidates the recent gains.
NASDAQ Seasonal MACD Update
As of today’s close, NASDAQ’s Seasonal MACD indicator is negative. It turned negative on May 30. The criteria we use to issue our NASDAQ Seasonal MACD sell is a new negative crossover of MACD (using 12-26-9 parameters) on or after the first trading day in June. Because NASDAQ’s MACD indicator was negative at the start of June, it will need to turn positive first. It would take a single day advance exceeding 377.18 NASDAQ points (1.95%) to turn MACD positive. Continue to hold associated positions in QQQ and IWM.
When NASDAQ’s Seasonal MACD turns negative we will send an email to all active members. At that time, we will finish repositioning our Portfolios for the “Worst Months.” We do anticipate adding to some existing bond ETFs and cash holdings in the Tactical Seasonal Switching Strategy portfolio.
Going International
Although we normally do not focus on non-U.S. markets, it has become increasingly difficult to ignore the outsized gains many international ETFs have enjoyed this year. Tariff uncertainty, a weaker U.S. dollar, more favorable monetary policy are some of the likely drivers boosting international markets. Here are four new trade ideas to consider if you are seeking international exposure.
iShares International Select Dividend (IDV) can be considered on dips below $34.00. IDV holds high-quality international companies that have generally provided consistent, high dividend yields over time. It has over $5 billion in assets and has traded nearly 800,000 shares per day on average over the last 30 days. Its 30-day SEC yield as of April 30, 2025, is a solid 5.71%. Its expense ratio is so-so at 0.49%. Top five holdings are: British American Tobacco, TotalEnergies, Enel, BHP Group, and National Grid.
![[IDV Daily Bar Chart]](/UploadedImage/AIN_0725_20250605_IDV.jpg)
iShares MSCI EAFE Min Vol Factor (EFAV) can be considered on dips below $83.70. EFAV holds developed market equities outside of the U.S. and Canada that have lower volatility characteristics relative to broader markets. It also has over $5 billion in assets and has traded over 500,000 shares on average over the last 30 days. Its expense ratio is reasonable at 0.20% and it has a 30-day SEC yield of 2.66%. Top five holdings are: Swisscom, Zurich Insurance Group, Novartis, Ahold Delhaize, and Orange.
iShares MSCI EAFE Value (EFV) can be considered on dips below $63.50. As its name implies, EFV is a value focused ETF that holds developed market equities outside of the U.S. and Canada. EFV has over $25 billion in assets and its shares typically change hands millions of times in a given trading day. Its expense ratio is ok at 0.33% while its 30-day SEC yield is respectable at 3.48%. Top five holdings are: Roche Holding, HSBC Holdings, Shell, Nestle, and Toyota.
iShares MSCI Eurozone (EZU) can be considered on dips below $58.80. EZU provides exposure to developed market countries that use the Euro. The equities it holds are mid- and large caps. Its expense ratio is 0.51% and its 30-day SEC yield is a modest 2.08%. EZU has nearly $8 billion in assets and trades millions of shares per day. Top five holdings are: SAP, ASML, Siemens, Allianz, and LVMH.
New June Sector Seasonalities
There are two new Sector Seasonalities that begin in June, a bearish period for natural gas stocks that is based upon the NYSE ARCA Natural Gas index (XNG) and a similarly bearish seasonality in oil stocks based upon NYSE ARCA Oil index (XOI). We are going to pass on both trade setups. Natural gas prices have been kept in check by domestic inventories that are within the 5-year average for this time of the year due to a mild winter and adequate supply. While natural gas prices could drift lower, the risk of a spike higher during hurricane season due to supply disruptions outweighs any potential reward of a short position. Geopolitical instability and crude oil’s price resiliency make shorting that sector unattractive.
Sector Rotation ETF Portfolio Updates
Three bullish and one bearish Sector Seasonalities come to an end in June. Starting at the top of the table on the bottom of page 94 in the 2025 Stock Trader’s Almanac, the bullish trade based upon XNG comes first. Our correlating ETF position, presented on February 6, First Trust Natural Gas (FCG), was stopped out in early April. FCG has rebounded modestly since then but is lagging the broader market and could easily remain range bound.
The next seasonality to end is a bearish period for gold and silver stocks based upon the Gold and Silver index (XAU). The correlating short trade using VanEck Junior Gold Miners (GDXJ) was added to the portfolio on May 2, and was stopped out on June 2 for a loss. Gold could be topping out having stalled out just under $3500 per ounce but it has also not retreated.
Lastly, bullish seasonalities associated with Consumer Discretionary and Staples come to an end in June. The position in
SPDR Consumer Discretionary (XLY) was stopped out in early March for a 6.2% gain.
SPDR Consumer Staples (XLP) can be considered on dips below $81.74. XLP has a
history of performing during the “Worst Months,” May through October.
Positions in other sectors that have historically performed well during the “Worst Months,” XLU and IBIT can still be considered on dips below their respective buy limits.
Last month’s other two short trades were a bust. SPDR S&P Regional Banking (KRE) was shorted on May 5 and stopped out on May 12 while SPDR Materials (XLB) was shorted on May 2 and stopped out on May 16. KRE has weakened while XLB has continued to climb modestly higher.
FXE, FXF, and FXY can also still be considered on dips. The U.S. dollar index has been in decline since mid-January. Its failed attempt to reclaim its key 100 level in May suggests the downtrend is still intact. As the U.S. dollar weakens, FXE, FXF, and FXY are likely to benefit.
Tactical Seasonal Switching Strategy Portfolio Update
Continue to Hold QQQ and IWM. NASDAQ’s Seasonal MACD Sell Signal has NOT triggered.
Defensive positions in bond ETFs, TLT, AGG, BND, SHV and SGOV, are flat to modestly negative. TLT, AGG and BND are on Hold. The performance of TLT, AGG and BND will likely depend greatly upon the timing of Fed rate cuts, which is not likely until later this year. Our preferred bond ETFs are SHV and SGOV as both exhibit relatively stable pricing and have yields exceeding 4%. We will consider adding to SHV and SGOV positions when NASDAQ’s Seasonal Sell signal triggers, but they can be considered at current levels up to their respective buy limits.
Disclosure note: Officers of Hirsch Holdings Inc hold positions in FXF, FXY, IWM, QQQ, SGOV, and XLP in personal accounts.