|
Market at a Glance – June 25, 2026
|
|
By:
Christopher Mistal
|
June 25, 2026
|
|
|
|
Please take a moment and register for our members’ only webinar, July 2026 Outlook & Update on Wednesday July 1, 2026, at 4:00 PM EDT here:
Please join us for an Almanac Investor Member’s Only discussion of recent market action with time for Q & A at the end. Jeff and Chris will cover their outlook for July 2026, review the Tactical Seasonal Switching Strategy ETF, Sector Rotation ETF, and Stock Portfolio holdings and trades. We will also share assessments of the Iran war, economy, the Fed, inflation, geopolitical events, gold, copper, energy, and relevant updates to seasonals now in play.
If you are unable to attend the live event, please still register. Within a day of completion, we will send out an email with links to access the recording and the slides to everyone that registers.
After registering, you will receive a confirmation email containing information about joining the webinar and a reminder message.
Market at a Glance
6/25/2026: Dow 51920.62 | S&P 7357.49 | NASDAQ 25358.60 | Russell 2K 3007.86 | NYSE 23610.72 | Value Line Arith 13710.39
Seasonal: Bullish. July is the first month of the new quarter and second half of the year. Over the last 21 years, July is the #1 S&P 500 and NASDAQ month with average gains of 2.5% and 3.1% respectively and DJIA’s second best month. NASDAQ’s Midyear rally, or Christmas in July, begins on June 26 and runs until July 14. But, in midterm years since 1950, July’s performance has been mixed. In midterm years, DJIA and S&P 500 have performed reasonably well while NASDAQ and Russell 2000 have struggled.
Fundamental: Foggy. Just released Q1 GDP was revised higher to 2.1%, but the Atlanta Fed’s GDPNow model has Q2 growth at just 2.5%, down from its estimate of over 4% in mid-May. Corporate earnings growth forecasts remain robust for 2026 but are currently estimated to slow in 2027. Inflation metrics have jumped higher, putting Fed rate hikes back in play but with crude oil prices in retreat, inflation could begin easing anytime. The labor market still appears to be on solid footing despite the rising number of tech-sector, AI-related, layoffs.
Technical: Divergent. After closing at new all-time highs in early June, DJIA, S&P 500 and NASDAQ have gone in different directions. DJIA is positive in June and near all-time highs while S&P 500 and NASDAQ are struggling and, in the red. DJIA is sitting comfortably above its 50- and 200-day moving averages. S&P 500 is currently trading within a few points of its 50-day moving average while NASDAQ has slipped below its. Should tech continue to struggle, DJIA could be hard pressed to enjoy a sustained rally.
Monetary: 3.50 – 3.75%. New Fed chairman Warsh wasted little time implementing change at the Fed. Following the Fed’s June meeting it was made immediately clear that Fed “speak” would be curtailed with a substantially shortened FOMC statement. That statement was crystal clear that inflation is still above target and that the “new” Fed will deliver price stability. Warsh did maintain some continuity at the Fed by holding a post-meeting press conference and releasing quarterly projections although he did decline to include his own. It will be interesting to see if this new direction actually results in improved outcomes.
Sentiment: Bullish. According to
Investor’s Intelligence Advisors Sentiment survey Bullish advisors stand at 55.8%. Correction advisors are at 26.9% and Bearish advisors were 17.3% as of their June 24 release. Bullish advisors have reached their highest level since late February and are now at a level where some additional caution is warranted. This does not mean abandoning stocks completely, it means consider limiting new long positions to your best ideas and strongest setups while holding existing positions with a close eye on stop losses.
|
July Outlook: NASDAQ Midyear Rally on Deck Before Summer Doldrums
|
|
By:
Jeffrey A. Hirsch & Christopher Mistal
|
June 25, 2026
|
|
|
|
As we close out June and head into the second half of the year, get ready for Christmas in July. After selling off on the Iran war and rallying sharply in line with the Trump Seasonal Cycle Pattern (TACO Trade), the market is settling into more historically typical Worst Months and Midterm Year Q2-Q3 Weak Spot behavior.
June delivered on the usual seasonal weakness setting up for a rather typical midyear rally led by NASDAQ. This 12-day rally from the last three trading days of June through the first nine trading days of July is what we refer to as Christmas in July.
Since 1985, NASDAQ has gained an average of 2.5% during this 12-trading-day period, with a median advance of 2.9%. The rally has produced gains in 32 of the last 41 years, a success rate of 78%. While not every year has been positive, the historical tendency has been remarkably resilient across a wide variety of market environments, including bull markets, bear markets, recessions, and recoveries.
Several of the strongest advances occurred during periods of heightened uncertainty. NASDAQ surged 10.4% during the 1999 midyear rally, climbed 10.0% in 2000, and gained 9.6% in 2016. More recently, the rally posted gains of 4.7% in 2020, 4.1% in 2023, and 3.8% in 2024. Last year’s rally generated a respectable 3.3% advance.
The pattern is likely driven by a combination of quarter-end portfolio adjustments, the start of a new quarter, fresh capital inflows, and generally favorable investor and trader sentiment heading into earnings season. Whatever the underlying cause, the tendency has proven durable over four decades.
Negative outcomes have occurred nine times since 1985, reminding traders and investors that market conditions and unexpected events can overwhelm seasonal patterns. Nevertheless, with a long-term track record of success and a solid average gain, NASDAQ’s 12-Day Midyear Rally remains a compelling seasonal opportunity.
Awaiting NASDAQ Best 8 Months MACD Sell
NASDAQ’s Midyear Rally should also provide us with an excellent opportunity for our NASDAQ Best 8 Months MACD Seasonal Sell Signal. NASDAQ’s Seasonal MACD indicator entered June in negative territory (red arrow in the chart below). It remains negative as of today’s close. Because our sell signal requires a new negative crossover (using 12-26-9 parameters) on or after the first trading day in June, the indicator must first turn positive before it can trigger. Currently NASDAQ would need to gain at least 2361.46 points (9.31%) in a single day to turn its MACD positive.
![[NASDAQ Technical Chart]](/UploadedImage/AIN_0726_20260625_MACD_NASDAQ_900.jpg)
We have talked about the April 8 ceasefire gap as an area that might get filled down around 22500, but that seems less likely now and would take some especially negative developments on the world stage or systemically in the market. However, a summer correction to 24000 or little above that is not out of the question. The dotted line in the chart represents some strong support at the October 2025 and January 2026 highs. There is also another gap on April 16/17 just above 24000 when Trump announced the Israel-Lebanon ceasefire that is more likely to get filled should a summer correction ensue.
When NASDAQ’s Seasonal Sell signal criteria are satisfied, we will send an email to all members. At that time, we will finish repositioning the Portfolios for the “Worst Months.” We still anticipate adding to some or possibly all of the existing bond ETFs and cash holdings in the Tactical Seasonal Switching Strategy portfolio.
NASDAQ Midterm & Trump Cycle Seasonal Pattern
With tech stocks and the end of NASDAQ’s Best 8 Months in focus we have created the chart below of NASDAQ Seasonal Patterns for Midterm Years and Trump Presidency Years. As illustrated by the red 6th Year of Presidency and the blue All Midterm Election Years lines, NASDAQ’s “Weak Spot” tends to get hit harder than DJIA and S&P 500. June’s selloff has also brought 2026 back in line with the green Trump Presidency Years and black All Years lines.
Bullishness ahead of the July 4th Independence Day holiday and the 250th Anniversary celebratory vibe should help propel the market higher into mid-July once end-of-Q2 and mid-year rotation and rebalancing abate. Whether we reach new highs or not, we expect ample opportunity for our NASDAQ MACD Sell Signal to materialize and to finalize repositioning for the “Worst Months” and be in prime position for the best three quarters of the 4-year cycle from Q4 midterm year to Q2 pre-election year.
The seasonal set up points to a rebound in the first half of July, but after that, the market is prone to selloff from a host of risks. Inflation is sticky and the data is a mess. Today’s PCE ran hot with core at 3.1% and headline hitting 4.1%, the hottest since October 2023. That’s not a print that gives the Fed cover to ease. So, rates are likely to stay where they are and guidance from the new Warsh Fed is likely to stay vague. Any hint of a more hawkish shift could send the market into another correction.
Energy is the wild card. The Iran ceasefire is an agreement to talk, not a resolution. If the 60-day clock runs out, and the can gets kicked down the road again, it would only take one escalation to send crude vertical. Energy prices, especially at the pump, go up like a rocket and come down like a feather. Any setback during the summer driving season could knock the market down. With all the government and AI capex spending even if energy prices come down, inflation may prove to be stickier than the market has hoped for.
We’re in the Weak Spot now and July begins NASDAQ’s Worst 4 Months. Midterm summers are for patience, not heroics. Don’t fight it. Be prepared to use NASDAQ’s Midyear Rally to take some profits and get positioned for a better buying opportunity in late-summer or early fall.
(Disclosure note: Officers of Hirsch Holdings Inc hold positions in EFAV, EFV, IBB, IDV, IWM, QQQ, SGOV, TLT, XBI, XLP, XLU and XLV in personal accounts.)
Pulse of the Market
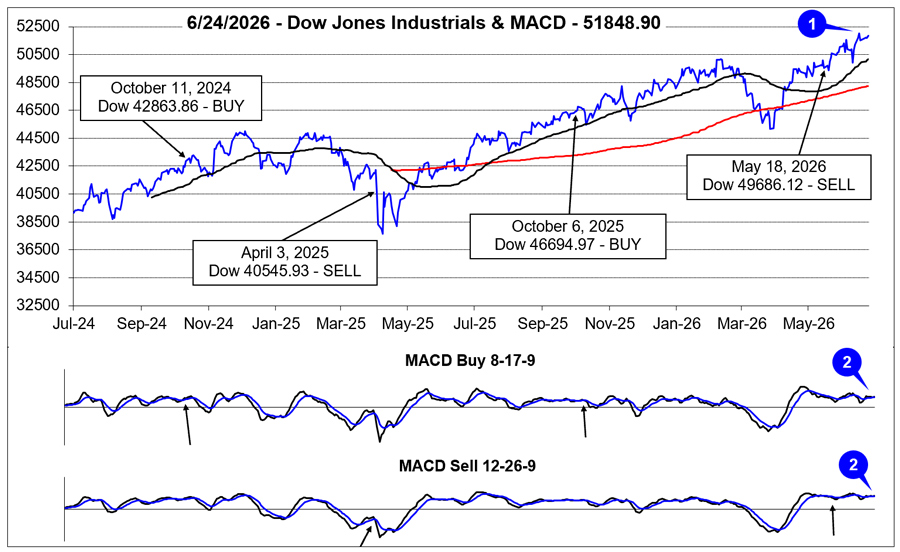
Following a brief pullback in the first half of June, DJIA briskly rebounded to new all-time closing highs (1) just 0.33 points below 52,000. As of DJIA’s close today, it is up 1.74% in June, substantially better than S&P 500 and NASDAQ that are down –2.94% and –5.98% respectively. DJIA also remains solidly above its 50- and 200-day moving averages.
However, DJIA’s rebound has not yet given new life to faster and slower moving MACD indicators. Both the MACD “Buy” and “Sell” indicators have continued to seesaw between positive and negative (2). In the past when MACD was above the zero line and chopping sideways, DJIA also chopped higher, but ultimately a meaningful pullback did transpire to push MACD back below the zero line. In the second half of July, when seasonal forces typically switch from tailwinds to headwinds, DJIA could be susceptible to a modest pullback.
During DJIA’s early June pullback, it triggered its fifth Down Friday/Down Monday (DF/DM) warning (3) (page 78 STA 2026) of 2026. Like some recent DF/DM occurrences, DJIA was able to quickly reclaim its losses and even climb to new all-time closing highs. Since the late-March market bottom, DJIA has largely ignored the historical negative implications of a DF/DM. At some point, DJIA may not be so resilient especially if the DF/DM occurs in traditionally weak August and/or September.
After extending its weekly winning streak to nine straight, S&P 500 (4) strength ended abruptly during the first week of trading in June when it declined –2.6%. NASDAQ (5) was down nearly twice as much (–4.7%) the same week. Absent a period of consolidation or another pullback, the major indexes could struggle to repeat their respective strong spring runs during the summer, especially after mid-July.
Weekly market breadth data was generally in line with the index’s weekly performance until last week (ending June 19, 2026), when DJIA, S&P 500, and NASDAQ all advanced, but Weekly NYSE Decliners outnumbered Weekly NYSE Advancers (6). Last week’s lack of broad participation likely foreshadowed some of this week’s mixed and choppy trading. With DJIA trading around all-time highs and NASDAQ still looking for firm footing, this week’s market breadth is also likely to be mixed.
Despite DJIA, S&P 500, and NASDAQ all closing at new all-time highs in June, New 52-week Highs have remained subdued (7). One potentially positive development is New 52-week Lows have declined for two weeks in a row. For the market to embark on a broad, sustained rally, additional New 52-week Highs and fewer New 52-week Lows are most likely needed.
Over the last five weeks, the 90-day Treasury bond yield (8) has ticked modestly higher as inflation metrics have heated up and the Fed appears to be contemplating interest rate hikes. However, that trend could be nearing an inflection point as falling crude oil prices could soon begin pushing inflation expectations lower. The retreat in the 30-year Treasury bond yield back under 5% would suggest the bond market has already begun lowering its expectations for inflation.
Click for larger graphic…
|
July Almanac & Vital Stats: Best Month of Q3 Mixed in Midterm Years
|
|
By:
Jeffrey A. Hirsch & Christopher Mistal
|
June 18, 2026
|
|
|
|
NASDAQ Seasonal MACD Update
As of today’s close, (June 18), NASDAQ’s Seasonal MACD indicator is still negative. It has been negative since May 18. The criteria we use to issue our NASDAQ Seasonal MACD sell is a new negative crossover of MACD (using 12-26-9 parameters) on or after the first trading day in June. Because NASDAQ’s MACD indicator was negative at the start of June, it still needs to turn positive first. It would take a single-day advance of 735.99 NASDAQ points (+2.78%) to turn MACD positive. Continue to hold associated positions in QQQ and IWM.
When NASDAQ’s Seasonal MACD registers a new negative crossover we will send an email to all active members. At that time, we will finish repositioning our Portfolios for the “Worst Months.” We do anticipate adding to existing bond ETF and cash holdings in the Tactical Seasonal Switching Strategy portfolio.
Christmas in July: NASDAQ’s 12-Day Midyear Rally
Tech’s influence in the market continues to grow and the market’s focus in early summer often shifts to the outlook for second quarter earnings of technology companies. In anticipation of positive results, over the last three trading days of June and the first nine trading days in July, NASDAQ typically enjoys a rally. This 12-trading-day run has been up 32 of the past 41 years with an average historical gain of 2.5%. Look for this rally to begin around June 26 and run until about July 14.
After the bursting of the tech bubble in 2000, NASDAQ’s mid-year rally had a spotty track record from 2002 until 2009 with three appearances and five no-shows in those years. However, it has been quite solid over the last sixteen years, up fourteen times with two losses. After struggling during the bear market in 2022, NASDAQ resoundingly snapped back the last three years recording gains of + 4.1% in 2023, +3.8% in 2024, and 3.3% in 2025 during its 12-day midyear rally.
July Almanac & Vital Stats
July historically is the best performing month of the third quarter, however historically tepid August and September tend to make the comparison easy. “Hot” Julys in 2009 and 2010 where DJIA and S&P 500 both gained greater than 6% combined with strong performances in 2013, 2018, and 2022, have boosted July’s average gains since 1950 to 1.4% and 1.3% respectively. DJIA, S&P 500, and Russell 1000 have been up 11 straight Julys (2015-2025). NASDAQ declined 0.8% in July 2024, ending its streak of July gains at nine in a row. Russell 2000 has been up nine times in the same period (down in 2015 and 2021). Such strength inevitability stirs talk of a “summer rally”, but beware the hype, as it has historically been the weakest rally of all seasons (page 76, Stock Trader’s Almanac 2026).
July begins NASDAQ’s worst four months but is also the seventh best performing NASDAQ month since 1971, posting a 0.9% average gain. Dynamic trading often accompanies the first full month of summer as the beginning of the second half of the year tends to bring an inflow of new capital. This creates a bullish beginning, middle, and a mixed/flat second half. On average, over the last 21 years, nearly all of July’s gains have occurred in the first 13 trading days. Once a bullish day, the last trading day of July has had a bearish bias over the last 21 years. In midterm years since 1950, July has been weaker with NASDAQ and Russell 2000 finishing the month with average losses of –0.8% and –2.5% respectively.
![[Recent 21-Year July Market Performance (2005-2025) Seasonal Pattern Chart]](/UploadedImage/AIN_0726_20260618_July_2026_Seasonal_Chart.jpg)
Over the past 21 years, DJIA’s first trading day of July has produced gains 85.7% of the time with an average advance of +0.44%. S&P 500 has advanced 90.5% of the time (average gain +0.48%). NASDAQ has been similarly bullish advancing 85.7% of the time (+0.54% average gain). No other day of the year exhibits this amount of across-the-board strength, which supports the case for declaring the first trading day of July the most consistently bullish day of the year over the past 21 years.
Trading on the day before and after the Independence Day holiday is often lackluster. Volume tends to decline on either side of the holiday as vacations begin early and/or finish late. Since 1980, DJIA, S&P 500, NASDAQ and Russell 2000 have recorded net losses on the day after (page 80, STA 2026).
Midterm-year July rankings are something of a mixed bag, ranking #3 for DJIA and S&P 500, averaging gains of +1.6% and +1.3% respectively (since 1950); while NASDAQ slips to #7 (since 1974). For Russell 2000 (since 1982) July has been its worst month in midterm years. NASDAQ has only advanced in five of the last thirteen midterm Julys. Russell 2000 has advanced four times in its last eleven.
|
July 2026 Strategy Calendar
|
|
By:
Christopher Mistal
|
June 18, 2026
|
|
|
|
|
Inflation Heats Up While NASDAQ MACD Sell Signal Waits in the Wings
|
|
By:
Christopher Mistal
|
June 11, 2026
|
|
|
|
In the
June Outlook and
members’ webinar we expressed our growing concerns about inflation and the potential for it to push interest rates higher, which could potentially lead to additional market volatility through the summer months and possibly a pullback. Our concerns were not alleviated by this week’s inflation data. Consumer inflation, measured by the Consumer Price Index (CPI), hit 4.2% year-over-year, its highest level in nearly three years. Any hope for potential relief was then dashed when the Producer Price index (PPI) was released earlier today as it showed prices rising briskly in May to 6.5% year-over-year.
![[CPI Projection Chart]](/UploadedImage/AIN_0726_20260611_CPI_Projection_Chart.jpg)
As the accompanying chart illustrates, the inflation story may be far from over. The black line shows the historical 12-month CPI trend, while the colored projections model various monthly inflation scenarios over the next year. Even under relatively modest monthly increases of 0.3% to 0.4%, annual CPI remains elevated in the 3.7%–4.9% range through mid-2027. More concerning is what happens if monthly inflation remains closer to the 0.5%–0.6% pace that has surfaced recently. In those scenarios, headline CPI could climb back above 6% and potentially approach 7.4%.
Higher inflation has forced the Federal Reserve to maintain a neutral policy stance longer than expected and is likely to make it consider additional tightening if inflation proves stubborn. Next week’s FOMC meeting announcement will likely highlight its growing concerns with inflation. Historically, periods of rising inflation expectations have coincided with higher bond yields, increased equity market volatility, and pressure on valuation multiples.
While inflation alone does not guarantee a market correction, the combination of elevated valuations, seasonal summer weakness, and renewed inflation concerns argues for a more cautious stance in the months ahead. Remain focused on risk management and be prepared for the possibility that inflation, and interest rates, becomes the market’s primary concern.
Today’s rally indicates that many traders and investors are still positioning for a benign inflation outcome, lower crude prices, and a quick easing of Middle East risk. Our concern is that if inflation fails to retreat quickly, that optimism may be challenged later in Q3.
NASDAQ Seasonal MACD Update
NASDAQ’s Seasonal MACD indicator entered June in negative territory. It remains negative as of today’s close. Because our sell signal requires a new negative crossover (using 12-26-9 parameters) on or after the first trading day in June, the indicator must first turn positive before it can trigger. Currently NASDAQ would need to gain at least 3462.98 points (13.42%) in a single day to turn its MACD positive.
A quick note about this seemingly insurmountable daily move. MACD uses exponential moving averages in its calculation that do give more weight to the most recent values. Today’s gain did reduce the one-day move substantially and it also reversed the trend of MACD’s histogram (the vertical bars above and below the zero/horizontal line in the MACD section of the chart). The trend of the histogram does precede a crossover in MACD as it represents the difference between MACD and its signal line. As the difference falls, the lines are moving closer together. The trend can continue as long as NASDAQ moves sideways and/or higher.
Last year, NASDAQ’s MACD took a comparable path to this year. It entered June in negative territory, turned positive in late-June just as NASDAQ’s Midyear Rally began, and remained positive until July 14, 2025. Because NASDAQ’s Midyear rally is primarily driven by quarterly earnings release expectations, it is reasonable to anticipate a similar trajectory this year. Continue to hold positions in QQQ and IWM.
When NASDAQ’s Seasonal Sell signal criteria are satisfied, we will send an email to all members. At that time, we will finish repositioning the Portfolios for the “Worst Months.” We still anticipate adding to some or possibly all of the existing bond ETFs and cash holdings in the Tactical Seasonal Switching Strategy portfolio.
Dividend Stock Basket – New Trade Ideas
This basket is being presented in advance of NASDAQ’s “Worst Four Months” of the year (July through October) and the worst two-month stretch for stocks, August and September. We will look to add these 10 stocks, in the table below, just below current levels on minor to modest dips. Some of the positions did strengthen in today’s trading session but there is no need to rush. As a reminder, the buy limit is our suggested maximum price to pay, and the stop loss only applies if the position closes the regular day session below it. For tracking purposes, we will allocate a hypothetical $3000 from the cash position in the Almanac Investor Stock Portfolio to each position.
For each stock we have provided the ticker, name, sector, general business description, PE, price-to-sales ratio, market value, current price, a dividend yield and a suggested buy limit and stop loss. There is also a link above the table to download the table in an Excel file (.xls format). This should aid importing and researching these stocks as most trading platforms and research software have support to import a stock list.
The overarching theme for this basket was dividend yield along with belonging to a traditional defensive sector with a history of outperforming the S&P 500 during the “Worst Months,” May through October. Many of the names are familiar and you may have some of their products in your own home. Many of these stocks have also been left for dead as they struggle with higher input costs and a consumer that many believe is stretched to the limit. Technically, these stocks appear to be showing signs of renewed interest now that expectations have retreated.
Additionally, we set a floor of $500 million for market capitalization and an average daily volume of 500,000 shares over the last 20 trading sessions in an effort to ensure liquidity and trading access would not be an issue. Should the broader market slip into a typical Q3 seasonal slump, these names could provide some shelter while paying a relatively healthy dividend at the same time.
Click to view full size…
|
NASDAQ MACD & Stock Portfolio Updates: Resilient Market Stretched
|
|
By:
Christopher Mistal
|
June 04, 2026
|
|
|
|
If you were unable to attend this Tuesday’s member’s only webinar,
June 2026 Outlook & Update, the slides and video recording are
available here (or copy and paste in a new browser window: https://www.stocktradersalmanac.com/LandingPages/webinar-archive.aspx). Jeff kicked off the session with an open invite to join him in
Las Vegas at MoneyShow’s Master Symposium on July 19-22 where he will be kicking off the 60th Anniversary Tour and a reminder that there are still some lifetime memberships and 10-year spots remaining. If you are interested and/or would like some additional information, give us a call or send us an email.
Jeff then quickly pivoted back to provide updates on many of the seasonal patterns and trends we have been tracking, and remain in play, this year. Despite the surge in energy prices and a corresponding reacceleration of inflation, the market has proven resilient and has climbed to well above average performance with S&P 500 up over 10% already in 2026. With S&P 500 already in the middle of our Base-Case scenario full-year gains of 8-12%, Jeff explained that inflation is the primary reason holding back a shift to the Best-Case scenario with full-year, 2026 gains possibly exceeding 20%.
As long as the Iran War drags on and crude oil price remains elevated, inflation pressure is likely to continue to build. This will in turn pressure the Fed to become less accommodative with monetary policy and potentially even reverse course and begin raising interest rates again. A tightening of monetary policy could trigger a market pullback, not to mention the additional pressure of ongoing geopolitical and midterm election uncertainty.
The Iran War likely did pull typical midterm year seasonal weakness forward this year, but with conflict still ongoing and oil still well above pre-war prices, the possibility of additional market volatility and weakness sometime during the remainder of Q2 and/or Q3 this year cannot be ruled out completely. Any such pullback ahead of or around midterm elections would likely be an excellent setup to the Sweet Spot of the four-year cycle, Q4 of this year through Q2 of 2027.
NASDAQ Seasonal MACD Update
NASDAQ’s Seasonal MACD indicator entered June in negative territory. It remains negative as of today’s close. Because our sell signal requires a new negative crossover (using 12-26-9 parameters) on or after the first trading day in June, the indicator must first turn positive before it can trigger. Currently NASDAQ would need to gain at least 1087.19 points (4.05%) in a single day to turn its MACD positive. Continue to hold associated positions in QQQ and IWM.
When NASDAQ’s Seasonal Sell signal criteria are satisfied, we will send an email to all members. At that time, we will finish repositioning the Portfolios for the “Worst Months” and anticipate adding to some or possibly all of the existing bond ETFs and cash holdings in the Tactical Seasonal Switching Strategy portfolio.
Stock Portfolio Updates
Over the past four weeks, through the close on June 3, the Almanac Investor Stock Portfolio slipped 1.2% lower, excluding dividends and any potential interest generated by the cash position, versus a 2.6% increase by S&P 500 and a 0.2% increase by Russell 2000 over the same time. Small-cap positions were the biggest drag, down 12.7% as HealWell AI (HWAIF) retreated and Phibro Animal Health (PAHC) was crushed and closed below its stop loss. Per last update, PAHC was closed out of the portfolio using its average price on May 8 for a modest 6.4% gain. As disappointing as it was getting stopped at $40.97, PAHC continued to plunge until it was under $30 and has only just begun to show signs of stabilizing this week.
HWAIF has continued to plod along. There has been some modest improvement since February, but it has yet to be recognized by the AI or healthcare crowds. Continue to Hold.
After briefly trading above $34.90 on May 7, EZCORP (EZPW) provided a second opportunity to take profits on May 11 when it traded above its “double” price again. Per standard trading guidelines, half the original position in EZPW was sold on May 11. EZPW has since modestly pulled back and is on Hold.
Ensign Group (ENSG) was closed out of the portfolio on May 8 using its average price that day after it closed below its stop loss price of $175.89 on the prior day. ENSG did bounce back briefly around mid-May, but that proved short-lived as ENSG closed below $165 today. Despite comments to the contrary, regulatory and reimbursement concerns appear to still be pressuring ENSG.
Super Micro Computer (SMCI) appears to have broken out of its multi-month slumber briefly trading above $50 per share earlier this week. SMCI is on Hold. Were it not for its relatively recent history of regulatory issues, it would be easier to take a more bullish view as SMCI has beat earnings estimates for two straight quarters now and relative to many other AI-related stocks its valuation seems quite reasonable even after more than doubling since its March lows.
All seven utility stocks (shaded in gray in the table below) can still be considered at current levels or on dips. Accelerating inflation and a corresponding increase in 10- and 30-year Treasury bond yields are still a drag on overall performance. In the near-term, utility stocks are likely to trade with above sector average volatility, primarily driven by crude oil’s price volatility. However, we would not be surprised to see the current administration make a significant push to lower energy prices and interest rates as the midterm elections quickly approach.
Longer-term, AI-fueled energy demand is likely to continue to grow. The merger of NextEra Energy (NEE) and Dominion Energy (D) announced on May 18 appears to be driven by that demand. This merger is currently expected to be completed in 12 to 18 months. D shareholders will receive 0.8138 shares of NEE for each share held at the close of the transaction. Once completed the newly formed company will be the world’s largest regulated electric utility. This merger could be just the beginning of consolidation in the sector.
All other positions not previously mentioned in the portfolio are on Hold. Please note some stop losses have been updated to account for recent gains.
Disclosure note: Officers of Hirsch Holdings Inc. held positions in AROC, HWAIF, SMCI, and SNEX in personal accounts.
|
ETF Portfolios & NASDAQ MACD Update: Rotating in May
|
|
By:
Christopher Mistal
|
May 28, 2026
|
|
|
|
Please join Jeff at the MoneyShow Masters Symposium in Las Vegas at Caesars Palace from July 19-22, 2026, as he kicks off the 60th Anniversary Edition tour for the 2027 Stock Trader’s Almanac. The Las Vegas Symposium will be four days of keynotes, workshops, live trading, and MoneyMasters Courses — all digging into transformative technologies, hard assets, income strategies, and alternatives. Not surface-level stuff. Real ideas, specific names, and up-to-date thinking on where the opportunity is in the second half of 2026 and beyond.
Please
register here or copy and paste this link into a browser window:
(https://lasvegasmms.moneyshow.com/?scode=067466)
More information and Jeff’s schedule can be found at the bottom of this email.
NASDAQ Seasonal MACD Update
As of today’s close, NASDAQ’s Seasonal MACD Sell indicator is negative. It turned negative on May 18. The criteria we use to issue our NASDAQ Seasonal MACD sell is a new negative crossover of MACD (using 12-26-9 parameters) on or after the first trading day in June. If NASDAQ’s MACD indicator is still negative when the market closes on May 29, it will need to turn positive again in June before it can trigger a sell signal. Continue to hold associated positions in QQQ and IWM.
When NASDAQ’s Seasonal MACD turns negative we will send an email to all active members. At that time, we will finish repositioning the Portfolios for the “Worst Months.” We do anticipate adding to some or possibly all of the existing bond ETFs and cash holdings in the Tactical Seasonal Switching Strategy portfolio.
S&P 500 8-Week Winning Streak
The market’s rally off the late-March lows has been impressive. S&P 500 has been up 8 weeks in a row and is currently on track for a ninth straight weekly gain. Since 1930, S&P 500 has been up 8 weeks or more in a row, just 24 times. Of the previous 23 streaks, 56.5% (13 of 23) of them lasted to 9 or more. The average gain after 8 straight weeks, excluding the current streak, was a solid 10.19%. The current streak is well above average at 17.34% as of May 22, 2026, close.
Looking at S&P 500 performance after previous 8-week winning streaks, its performance was somewhat mixed 1- and 2-Weeks later with average performance of +0.11% and –0.13% respectively. This is not surprising as ten of the weekly winning streaks did not last past 8 weeks and only four streaks lasted longer than 9 weeks straight. However, by 4-Weeks later performance begun improving and continued to improve at the 3- and 6-Months later periods.
Rather bullishly, the only double-digit loss to appear in the entire table was back in 1957 when S&P 500 was down –13.76% 6-Months after as the U.S. economy slipped into a recession in August 1957 that lasted through April 1958. Also notable is this year is just the third midterm year to appear in the table. In 1958, S&P 500 finished the year up +38.1% and in 1998 it was up +26.7%. Due to the Iran War, high energy prices, and stubborn inflation, a more likely outcome for midterm year 2026 is still our base case scenario of 8-12% full-year gains for S&P 500 with some typical midterm year volatility during the “Worst Months.”
New June Sector Seasonalities
There are two new Sector Seasonalities that begin in June, a bearish period for natural gas stocks that is based upon the NYSE ARCA Natural Gas index (XNG) and a similarly bearish seasonality in oil stocks based upon NYSE ARCA Oil index (XOI). We are going to pass on both trade setups. Natural gas prices have been kept in check by domestic inventories that are within the 5-year average for this time of the year. While natural gas prices could drift lower, the risk of a spike higher during hurricane season due to supply disruptions outweighs any potential reward of a short position. Additionally, ongoing geopolitical instability makes shorting energy broadly unattractive.
Sector Rotation ETF Portfolio Updates
Three bullish and one bearish Sector Seasonalities come to an end in June. Starting at the top of the table on the bottom of page 94 in the 2026 Stock Trader’s Almanac, the bullish trade based upon XNG comes first. Our correlating ETF positions, presented on February 5, First Trust Natural Gas (FCG), and United States Natural Gas (UNG) are on Hold. UNG and FCG have been disappointing, but both did gain today (UNG up over 6%). Rather than exiting at a loss, a tight 2% trailing stop loss, beginning with today’s closing prices (May 28) is suggested for UNG and FCG. Should they manage to build on today’s momentum, the trailing stop could provide an even better exit price.
The next seasonality to end is a bearish period for gold and silver stocks based upon the Gold and Silver index (XAU). There is no corresponding position in the portfolio as the Iran war and persistent inflation make shorting gold challenging.
Lastly, bullish seasonalities associated with Consumer Discretionary and Staples come to an end in June. The position in
SPDR Consumer Discretionary (XLY) was stopped out in March.
SPDR Consumer Staples (XLP) can be considered on dips below $83.00. XLP has a
history of outperforming the S&P 500 during the “Worst Months,” May through October.
Positions in other sectors that have historically performed well during the “Worst Months,” XLU, XLV, IBB and XBI can still be considered on dips below their respective buy limits.
iShares US Technology (IYW) has ran away and its associated trade is cancelled.
In accordance with the
Seasonal MACD Sell signal for DJIA on S&P 500,
iShares DJ Transports (IYT) was closed out of the portfolio on May 19 using its average price that day. Excluding dividends and any trading fees, IYT gained 9.7%.
SPDR Energy (XLE) has been updated to reflect its closing below its stop loss of $55.55 on April 17. Although not the desired outcome, XLE was still closed out for a solid 26.1% gain excluding any dividends or fees. If still holding XLE, a trailing stop loss is suggested as oil’s favorable season is winding down.
Tactical Seasonal Switching Strategy Portfolio Update
SPDR DJIA (DIA) and SPDR S&P 500 (SPY) have been closed out of the portfolio using their respective average prices from May 19 for an average gain of 7.8% excluding dividends or fees. Both have moved modestly higher and are providing ample opportunity to sell into strength.
Continue to Hold QQQ and IWM. NASDAQ’s Seasonal MACD Sell Signal has NOT triggered and cannot trigger until June 1 this year.
Defensive positions in bond ETFs, TLT, AGG, BND, SHV and SGOV, are essentially flat with fractional gains. TLT, AGG and BND are on Hold. The performance of TLT, AGG and BND will likely depend greatly upon the Fed and the trajectory of inflation — both remain quite unclear at this time. Our preferred bond ETFs are SHV and SGOV as both exhibit relatively stable pricing and have yields around 3.5%. We will consider adding to existing SHV and SGOV positions when NASDAQ’s Seasonal Sell signal triggers, but they can be considered on dips up to their respective buy limits.
Disclosure note: Officers of Hirsch Holdings Inc hold positions in DBA, EFAV, EFV, IBB, IDV, IWM, QQQ, UNG, XBI, XLE, XLP and XLU in personal accounts.
A New Age of Investing and Trading in Transformative Technologies
Let's be honest — the last few years were almost too easy if you were holding the right AI and Big Tech names. But that trade has gotten a lot more complicated.
We're hearing more questions about the AI boom – and we’re seeing real rotation now. Money is starting to move out of last year's darlings and into places that felt “boring” 18 months ago — industrials, energy, value, income. The major indices are still near all-time highs, and Wall Street's long-term outlook for stocks hasn't fallen apart. But what's working underneath the surface looks very different now.
On top of that, the Fed may not be done being restrictive, inflation hasn't gone away quietly, and geopolitical flare-ups keep popping up – putting oil, commodities, and real assets squarely into any market conversation.
Bottom line: This is a market where active allocation and real risk management actually matter again. That's a big part of why Jeff is looking forward to speaking at the
2026 MoneyShow Masters Symposium in Las Vegas, scheduled for July 19–22 at Caesars Palace.
Please
register here or copy and paste this link into a browser window:
(https://lasvegasmms.moneyshow.com/?scode=067466)
Jeff’s speaking schedule:
Sunday, July 19, 2026, at 1:55 pm - 2:20 pm PDT (Pre-Show Presentation)
The AI Super Boom: How to Ride the Next Leg of the Secular Bull
Sunday, July 19, 2026, at 2:45 pm - 3:30 pm PDT (Pre-Show Panel)
Silicon Fortunes: Capitalizing on Tech’s Explosive Growth
Monday, July 20, 2026, at 4:40 pm - 5:25 pm PDT (Workshop)
What Six Decades of Market History Tell Us About the Next 15
Tuesday, July 21, 2026, at 9:40 am - 10:10 am PDT (Keynote Panel)
The Stocks and ETFs You Can’t - and Shouldn’t – Live Without
Meet Jeff in Las Vegas and join the 2027 Stock Trader’s Almanac 60th Anniversary Edition tour kickoff.