|
Market at a Glance - 10/28/2021
|
|
By:
Christopher Mistal
|
October 28, 2021
|
|
|
|
10/28/2021: Dow 35730.48 | S&P 4596.42 | NASDAQ 15448.12 | Russell 2K 2297.98 | NYSE 17077.00 | Value Line Arith 9825.57
Fundamental: Decelerating. According to the just released advance estimate of Q3 GDP from the BEA, growth slowed to just 2%. This is the slowest gain since the recovery began last year and was well below estimates. September’s jobs report was similarly disappointing and well below expectations earlier this month. Two bright data points thus far are solid corporate earnings numbers and steadily falling initial weekly jobless claims.
Technical: Breaking out. Our Seasonal MACD Buy Signal triggered on the close on October 8. DJIA, S&P 500 and NASDAQ have all broken out to new all-time closing highs. Russell 2000 has not. Weekly New Highs are bullishly trending higher while Advance/Decline lines are improving. Seasonal forces may aid the market with a sustained move higher into yearend.
Monetary: 0 – 0.25%. Next week the Fed will meet, and they are widely expected to transition from taper talk to taper action. Given current elevated inflation readings and softening growth, the Fed may be challenged to achieve a balance that adequately addresses both issues while keeping the market satisfied. We believe the Fed will announce a tapering strategy, but the pace is likely to be slow and data dependent.
Seasonal: Bullish. November is the first month of the “Best Six Months” for DJIA and S&P 500 and NASDAQ’s “Best Eight Months.” It’s also the first month of the market’s best three consecutive month span, November to January. November is the best S&P 500, Russell 1000 and 2000 month of the year. Second best for DJIA and S&P 500. In post-election years average performance improves modestly compared to all years.
Psychological: Improving. According to
Investor’s Intelligence Advisors Sentiment survey Bullish advisors have climbed to 48.9%. Correction advisors have retreated to 27.3% while Bearish advisors stand at 23.8%. Bullish sentiment bottomed in early October when correction sentiment had swelled to 37.10%. The difference between bulls and bears also shrunk to its lowest level since the pandemic began in early October and has begun to rebound. Overall sentiment remains marginally neutral but is likely to shift as the market continues to climb higher.
|
November Outlook: Best Months & Yearend Rally Begins
|
|
By:
Jeffrey A. Hirsch & Christopher Mistal
|
October 28, 2021
|
|
|
|
With one trading day left in October it looks as though the market has resisted Octoberphobia and averted the feared crashes or massacres that have given the month its bad reputation. More significantly for us though is the continuation of the return to normal seasonal patterns we began to see last month that had been off kilter through much of the pandemic. As you can see in the chart of the typical October pattern over the recent 21-year period stocks have tracked the seasonal pattern rather closely this month, but with above average gains ranging from 4.2% for Russell 2000 to 6.9% for NASDAQ.
![[Typical October Chart]](/UploadedImage/AIN_1121_20211028_Typical_October.jpg)
November leads the strongest seasonal period for stocks, kicking off the best consecutive 3-months, the Best Six Months for DJIA and S&P 500 and the Best Eight Months for NASDAQ. It benefits from “Fourth Quarter Market Magic” as detailed on page 102 of the 2021 Almanac. Trading around Thanksgiving has been lifted by the holiday spirit for many years, but the best short-term trading strategy in recent years has been to come into the week long and exit into strength on the shortened trading day the Friday after.
Since we issued our
Best Months Seasonal MACD Buy Signal on October 8 the market has done quite well with DJIA up 2.8%, S&P 500 up 4.7% and NASDAQ up 6.0% as of today’s close. This is already a good chunk of the typical Best Months with MACD timing historical average gains of 8.9% for DJIA and 13.4% for NASDAQ. We do not expect the blowout performance we had last year during the Best Months with DJIA up 19.1% and NASDAQ up 18.3%.
This is in keeping with our expectation for a reversion to the mean for overall market returns. Back in March on the one-year anniversary of the pandemic low when the S&P was up 75% for the rolling 1-year period we ran the numbers on the 1-year rolling returns for the S&P 500 back to 1949. While these giant spikes do come at the early stages of extended bull runs, gains of this magnitude have not been sustained and the market has tended to revert to the mean. The arithmetic mean or average rolling 1-year return since 1949 is 9.4%, which isn’t bad either.
As you can see in the chart the market is already heading quickly toward that mean. So we expect modest gains over the next several months in keeping with historical seasonal patterns. If we tack on a 1% gain on average each month over the next six-eight months that will be in keeping with the mean reversion to average rolling 1-year returns and overall historical market performance.
We expect the positive support from seasonal forces, solid corporate earnings, improving market internals and technical momentum to outweigh negative inputs from nagging transitory inflation, supply chain bottlenecks, the flattening yield curve and decelerating growth for the time being.
So we are bullish through yearend and into Q1 of 2022 when optics from midterm election campaigning and mudslinging are likely to make the market more susceptible to the headwinds it’s been able to stave off with support from easy money from the Federal Reserve and free money from the Federal Government. For now enjoy the yearend rally and Best Months of the year.
Pulse of the Market
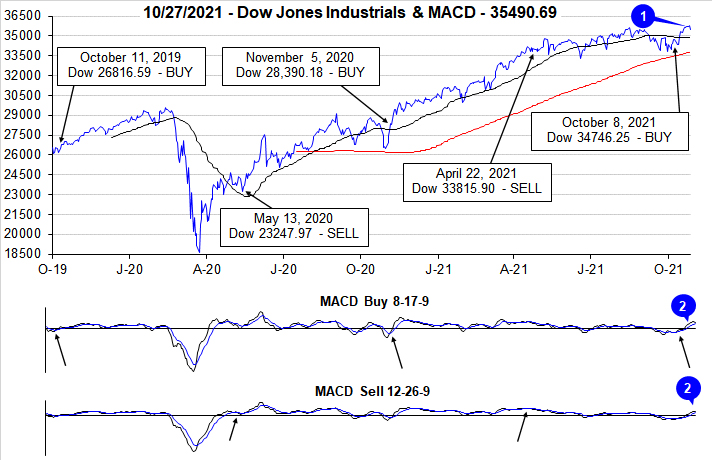
Following a rather typical and volatile September, the market regained its footing in early October and on the close of trading on October 8 the criteria to issue our Seasonal MACD Buy Signal for DJIA, S&P 500 and NASDAQ was satisfied. Since that day through yesterday’s close, DJIA has gained 2.1%, S&P 500 has climbed 3.7% and NASDAQ has jumped 4.5%. These gains have resulted in new all-time closing highs from DJIA (1), S&P 500 and NASDAQ (as of today). The shift in market direction and momentum has been confirmed by both the faster and slower moving MACD indicators (2). Both indicators remain positive and are trending bullishly higher. The “Best Months” have officially begun, and they are off to a solid start.
Once again, we must note the importance of keeping track of how DJIA trades on Friday and the following Monday. Historically Down Friday/Down Monday (DF/DM) occurrences have frequently proved to be important inflection points for the market. Many have foreshadowed further market declines, but others, most notably following a period of weakness and a shift in sentiment have occurred near market bottoms. The most recent and sixth DF/DM of the year (3) that was completed on October 11 thus far appears to the bullish type. DJIA, S&P 500 (4) and NASDAQ (5) have all advanced for three weeks straight with the majority of gains coming in the last two weeks after the DJIA DF/DM.
Bullishly, the markets gains have been supported by positive breadth metrics with NYSE Weekly Advancers outnumbering NYSE Weekly Decliners over the last two weeks (6). Historically, a larger number of Weekly Advancers has confirmed broad participation in the rally and has typically been associated with the greatest gains. The exact opposite occurred in September; Weekly Decliners outnumbered Weekly Advancers, with the exception of one week.
Further confirmation that the rally is underway and gaining momentum can be seen in the expanding number of Weekly New Highs and steadily shrinking Weekly New Lows (7). Current readings would appear to support further gains as New Highs are still below their peak of 951 reached in March of this year while New Lows can still decline further. Should the current trend in New Highs and New Lows continue, additional new all-time closing index highs are increasingly likely.
Despite all the attention headline inflation metrics have received lately, the current surge in inflation still does appear to be transitory in nature. The duration of this transitory period is likely to be longer than first anticipated, but with the weekly 30-year Treasury yield (8) hovering around 2%, the bond market appears to be signaling elevated inflation is not going to persist. For some context, using data provided by https://fred.stlouisfed.org, the weekly 30-year Treasury yield was over 15% in October 1981 when CPI (year-over-year) was at 10.3%. And last year in April the weekly 30-year Treasury yield sank to 1.19% when CPI came in at just 0.3%. It would seem that if inflation was expected to persist at current levels indefinitely, 30-year Treasury bond yields would not be at current levels.
Click for larger graphic…
|
Stock & ETF Portfolio Updates: Seasonal Buying Underway
|
|
By:
Christopher Mistal
|
October 28, 2021
|
|
|
|
Tactical Seasonal Switching ETF Portfolio Update
In accordance with our
Seasonal MACD Buy Signal Alert sent after the market closed on October 8,
SPDR DJIA (DIA),
SPDR S&P 500 (SPY),
Invesco QQQ (QQQ), and
iShares Russell 2000 (IWM) have been added to the Tactical Seasonal Switching Strategy ETF portfolio using their respective average prices on October 11.
iShares Core US Aggregate Bond (AGG) and
Vanguard Total Bond Market (BND) were also closed out of the portfolio on that day. Excluding dividends and trading costs, AGG and BND were closed out for a modest loss of less than 1%. On the bright side, the average gain of QQQ, IWM, DIA and SPY is 3% as of yesterday’s close.
Buy limits for QQQ, IWM, DIA and SPY appear in the following table and were calculated using their closing prices from October 8, plus 1% for now. We will evaluate these during the next update. As a reminder, we generally do not suggest a stop loss for these positions as the strategy has us holding until the next Seasonal MACD Sell Signal – the earliest it can trigger is the first trading day of April 2022.
Sector Rotation ETF Portfolio Updates
Also in accordance with our Seasonal MACD Buy Signal Alert sent after the market closed on October 8, XLP, XLV, XBI, IYW, IYT, XLY, XLF, XLI, XLB, XLK and VNQ have been added to the Sector Rotation ETF portfolio using their respective average prices on October 11. In the case of existing positions in XLP, XLV, XBI and IYW their respective “Presented Prices” have been adjusted for the additional buying.
Buy limits, stop losses and auto-sell prices have been adjusted for all positions except GLD, IYZ and SOXX. IYZ and SOXX were added to the portfolio during normal trading on October 8. Every position except GLD can still be considered on dips.
“Worst Months” trades in XLU and short IYT and XLI were closed out of the portfolio using their average daily prices on October 8 as detailed in the previous days
email Alert.
Almanac Investor Stock Portfolio Updates
Since the last portfolio update through yesterday’s close, S&P 500 climbed 0.8% higher while Russell 2000 advanced 0.1%. During the same time period the entire portfolio was off 0.8%, excluding dividends and any fees. Mid- and Large-cap positions were weakest down 2.7% and 2.4% respectively. Small caps fared best climbing 0.7% higher. Weakness in the period was primarily due to declines by defensive positions, most notably many of the utility sector positions held throughout the portfolio.
Algonquin Power (AQN) was stopped out on October 8 when it closed below its stop loss. Stephan Co (SCL) and South State Corp (SSB) were also stopped out. Broad weakness and previously mentioned utility weakness contributed to the declines.
New stock positions presented in our
October Small and Mid-Cap Stock Basket appear in the portfolio below. Five of the eight new trades have been added to the portfolio as they traded below their respective buy limits.
Encore Wire Corp (WIRE) appears to have run away but remains as an open trade idea as it appears susceptible to a pause and possibly a pullback.
With the exception of the eight newest ideas, all other positions in the portfolio are on Hold. Please see table below for specific stop losses and current advice for each position.
|
November Almanac: Best Consecutive Three-Month Span Begins
|
|
By:
Jeffrey A. Hirsch & Christopher Mistal
|
October 21, 2021
|
|
|
|
November maintains its status among the top performing months as fourth-quarter cash inflows from institutions drive November to lead the best consecutive three-month span November-January. However, the month has taken hits during bear markets and November 2000, down –22.9% (undecided election and a nascent bear), was NASDAQ’s second worst month on record—only October 1987 was worse.
November begins the “Best Six Months” for the DJIA and S&P 500, and the “Best Eight Months” for NASDAQ. Small caps come into favor during November, but don’t really take off until the last two weeks of the year. November is the number-two DJIA (since 1950) and NASDAQ (since 1971) month. November is best for S&P 500 (since 1950), Russell 1000 (since 1979) and Russell 2000 (since 1979). Average performance in all years ranges from 1.7% by S&P 500 to a solid 2.5% by Russell 2000.
In post-election years, November’s market prowess is essentially unchanged. DJIA has advanced in 14 of the last 17 post-election years since 1953 with an average gain of 1.9%. DJIA has been up 11-straight post-election year Novembers. DJIA’s last losing post-election year November was all the way back in 1973 (-14.0%, Arab oil embargo began 10/19/1973). S&P 500 has been up in 13 of the past 17 post-election years. Small caps perform well with Russell 2000 climbing in 8 of the past 10 post-election years, averaging 2.8%. The only real blemishes in the November post-election year record are 1969 (DJIA –5.1%) and 1973 (DJIA –14.0%, OPEC oil embargo).
![[Post-Election Year November Performance Table]](/UploadedImage/AIN_1121_20211021_PE_November_mini_table.jpg)
Options expiration often coincides with the week before Thanksgiving. DJIA posted ten straight gains 1993-2002 and has been up 19 of the last 28 weeks before Thanksgiving. The Monday of expiration week has been streaky, but the net result since 1994 is 17 DJIA gains in 27 years with 12 advances occurring in the last 17 years. Options expiration day has a clearly bullish bias, up 14 of the last 19. The week after expiration has been a mixed bag recently. DJIA has been up six of the last nine after being down five of six from 2006 to 2011.
Being a bullish month November has eight bullish days, though it does have weak points. NASDAQ and Russell 2000 exhibit the greatest strength at the beginning and end of November. Russell 2000 is notably bearish on the 12th trading day of the month; the small-cap benchmark has risen just nine times in the last 37 years (since 1984). The Russell 2000’s average decline is 0.37% on the day. Recent weakness around Thanksgiving has shifted DJIA and S&P 500 strength to mirror that of NASDAQ and Russell 2000 with the majority of bullish days at the beginning and end of the month. The best way to trade Thanksgiving is to go long into weakness the week before the holiday and exit into strength just before or after.
|
November 2021 Strategy Calendar
|
|
By:
Christopher Mistal
|
October 21, 2021
|
|
|
|
|
October Small/Mid-Cap Stock Basket: New Trades for Consideration
|
|
By:
Christopher Mistal
|
October 14, 2021
|
|
|
|
This basket is being presented in order to take advantage of the “Best Months” of the year (November through April/June) for stocks. We will look to add these 8 stocks, in the table below, near current levels or on minor dips. Many of the positions did strengthen today and are likely to open at or above the suggested buy limits. We will allocate a hypothetical $2000 from the cash position in the Stock Portfolio to each position. For each stock we have provided the ticker, name, sector, general business description, PE, price-to-sales ratio, market value and a suggested buy limit along with a stop loss.
These 8 stocks all have reasonably solid valuations, revenue and earnings growth. Most also exhibit positive price and volume action as well as other constructive technical and chart pattern indications. The group of 8 covers a broad array of sectors and industries with construction being well represented. For this basket we have elected to focus on the lower end of the market capitalization spectrum. Stocks selected today are a mix of small caps ranging from $50 million to $1billion in market cap along with mid-caps in the $1 to 5 billion range. Late-October and November has historically been a good time to buy small-cap and technology stocks.
We first sifted through the universe of nearly 8,000 U.S. traded stocks for those with a market cap of at least $50 million, but no greater than $5 billion and average daily volume of 50,000 shares or more on average over the past twenty trading sessions. Then we winnowed the list down to only those stocks with relatively low price-to-sales and price-to-earnings ratios with a few exceptions. A special nod was given to stocks with a below average number of analysts following them.
We then dug into numerous individual company charts before settling on these final 8 stocks. Our underlying theme was to find reasonably priced stocks that appear to be quietly growing sales and earnings while flying somewhat under the radar with only a limited number on The Street paying close attention to them. As market cap goes higher, this becomes increasingly challenging and a history of earnings surprises and future estimates becomes even more important.
At the end of the screening process we were left with a reasonably diverse small/mid-cap basket. Construction is well represented with four stocks, but the remainder of the basket includes medical, transportation, computer technology and consumer related stocks. We did not search specifically for top-performing stocks within any specific sector, this just happens to be what remained after our process. We anticipate performing a similar screen for Large-cap stocks in the near future that should provide another basket of stocks to consider.
|
Seasonal MACD & ETF Portfolios Updates
|
|
By:
Jeffrey A. Hirsch & Christopher Mistal
|
October 08, 2021
|
|
|
|
Faster moving MACD “Buy” indicators applied to DJIA, S&P 500 and NASDAQ are all positive as of today’s close. With all three indices confirming, we are now issuing our Seasonal MACD Buy Signal.
Tactical Seasonal Switching Strategy ETF Portfolio Trades
Buy SPDR DJIA (DIA), SPDR S&P 500 (SPY), Invesco QQQ (QQQ), and iShares Russell 2000 (IWM) in the Almanac Investor Tactical Seasonal Switching Strategy Portfolio. These positions will be equally weighted in the portfolio. Buy limits for DIA, SPY, QQQ and IWM are initially today’s closing price plus 1% (closing price * 1.01 = buy limit). For tracking purposes, these ETFs will be added to the portfolio using their respective average prices on Monday, October 11. This price will be calculated by summing the high and low prices and dividing by two.
Sell defensive “Worst Months” positions in iShares Core US Aggregate Bond (AGG) and Vanguard Total Bond Market (BND). For tracking purposes, these ETFs will be closed out using their respective average prices on October 11.
Sector Rotation ETF Portfolio Trades
In the Almanac Investor Sector Rotation Portfolio, Buy XLP, XLV, XBI, IYW, IYT, XLY, XLF, XLI, XLB, XLK and VNQ. Use a new 1% Buy Limit for these positions as detailed above. For tracking purposes, these ETFs will be added to the portfolio using their respective average prices also on October 11.
iShares DJ US Telecom (IYZ) and iShares Semiconductor (SOXX) were added to the portfolio today when they traded below their respective buy limits. Also use a new 1% Buy limit for IYZ and SOXX as detailed above for any new trades.
Existing positions in XLP, XLV, XBI and IYW will be adjusted for the additional trade’s new prices in the next full update.
|
Seasonal MACD Update: Still on Hold Due to End-of-Day Retreat
|
|
By:
Jeffrey A. Hirsch & Christopher Mistal
|
October 07, 2021
|
|
|
|
As of today’s close, our Seasonal MACD Buy Signal is still on Hold. Faster moving 8-17-9 MACD indicators applied to DJIA and S&P 500 have crossed over, but NASDAQ failed to confirm today. Without confirmation across all three indexes the criteria to issue our Seasonal Buy signal has NOT been met.
The criteria to issue our Seasonal MACD Buy Signal is:
1. A new buy signal crossover using our 8-17-9 MACD indicator AND
2. The crossover must occur on or after the first trading day of October AND
3. DJIA, S&P 500 and NASDAQ MACD indicators must all be in agreement.
Tactical Seasonal Switching Strategy Portfolio Update
In preparation for our upcoming Seasonal MACD Buy Signal, our usual core four ETF positions appear in the portfolio table below. Continue to hold defensive positions in iShares Core US Aggregate Bond (AGG) and Vanguard Total Bond Market (BND). When we issue our Seasonal MACD Buy, we will look to exit AGG and BND and consider establishing positions in DIA, IWM, QQQ and SPY.
|
ETF Trades: Seasonal Sector ETF Long Basket
|
|
By:
Christopher Mistal
|
October 07, 2021
|
|
|
|
Every year while preparing the annual Almanac, we revisit and analyze our sector seasonalities (STA 2021 pages 92, 94 and 96) in depth in order to make adjustments for any new or developing trends. There have been a few minor revisions made to our Sector Seasonalities table in recent years, but for the most part, sector seasonality has been reasonably on track with many sectors producing the bulk of their annual gains during their traditionally favorable periods. Years of sector research allows us to specify whether the seasonality starts or finishes in the beginning third (B), middle third (M) or last third (E) of the month based upon the number of trading days in the month.
The 2022 Almanac table follows. Both long and short trade opportunities are researched and the most statistically viable appear below. Because indexes are not directly tradable, highly correlated exchange-traded funds (ETFs) are chosen to execute trades. Performance over the last 5-, 10- and 15-year time periods is included. We prefer to focus on the 15-year average performance as this period has sufficient data to be seasonally significant.
These entry and exit points will be the basis for our seasonal trades over the coming year. They are guidelines, as we generally look to enter new positions before the start of the favorable period and exit before its end. Occasionally a trade is closed out well in advance of the seasonality’s end. An outsized advance may trigger a trade at the suggested auto-sell price (a price target based upon past historical performance of the specific seasonality) or should strength fail to materialize, a stop loss could be reached.
There are thirteen sector seasonalities that enter their favorable periods in October. The following trade ideas are made based upon these seasonalities. Currently, all buy limits are below current market levels. If Octoberphobia returns and the market struggles prior to our Seasonal MACD Buy Signal, we want to take advantage of any weakness or pullback to begin accumulating the following new positions. Any positions left open, will be considered when we issue our Seasonal MACD Buy Signal for DJIA, S&P 500 and NASDAQ.
Trades for October Sector Seasonalities
Transports enter their historically favorable season at the beginning of October and it runs until May. iShares DJ Transports (IYT) is attractive below current levels with a buy limit of $247.55. The stop loss is $222.80 and auto sell is $311.52. Top 5 holdings are: Union Pacific, United Parcel Service, CSX, Uber and Southwest Airlines. With nearly 70% of U.S GDP coming from consumers, seasonal strength in the consumer sector overlaps nicely with the transportation sector.
![[iShares DJ Transports (IYT) Chart]](/UploadedImage/AIN_1121_20211007_IYT.jpg)
Over the last 15 years, Telecom has generated an average return of 2.7% during its bullish seasonality from the middle of October through around yearend. The top ETF within this sector is iShares DJ US Telecom (IYZ). Use a buy limit of $32.85 and stop loss of $29.57. If above average gains materialize, take profits at the auto sell of $37.11. Top 5 holdings are: Comcast, Cisco Systems, Verizon, AT&T and Charter Communications. Aggressive competition has hindered the sector, but IYZ does boast a 12-month trailing yield of 2.46% as of August 31.
![[iShares DJ US Telecom (IYZ) Chart]](/UploadedImage/AIN_1121_20211007_IYZ.jpg)
Semiconductors come into favor near October’s end and remain so until the beginning of December. This trade has averaged 8.9% and 12.0% gains over the last 15- and 5-year periods, respectively. iShares Semiconductor (SOXX) is the top selection. Establish new positions with a buy limit of $445.25 and utilize a stop loss of $400.73. Take profits at the auto sell of $533.36. Top 5 holdings are: Intel, Broadcom, Nvidia, Texas Instruments and Qualcomm. These are the companies that design and supply the brains for the bulk of our favorite electronic devices; smart watches, smart phones, PCs, tablets, cameras, drones, refrigerators, air conditioners basically you name it. Recent shortages of semiconductors has only reinforced how important and significant the sector has become.
![[iShares PHLX Semiconductor (SOXX) Chart]](/UploadedImage/AIN_1121_20211007_SOXX.jpg)
Although consumer spending is spilt into two distinct sectors, Discretionary and Staples, their favorable seasons run concurrently from the beginning of October to the beginning of June in the following year. Over the past 15-years Discretionary has an average gain of 14.1% and Staples 7.9%. SPDR Consumer Discretionary (XLY) and SPDR Consumer Staples (XLP) are the preferred vehicles to execute these trades. XLY can be considered on dips below $180.50. An initial stop loss of $162.45 and an auto-sell at $226.55 are suggested. XLY Top 5 holdings are: Amazon.com, Tesla, Home Depot, McDonald’s and NIKE. XLP could be purchased on dips below $69.50. Update the existing stop loss to $62.55 and use an auto-sell of $82.49. XLP Top 5 holdings are: Procter & Gamble, Pepsi, Coca-Cola, Walmart and Mondelez. XLP is an existing holding in the ETF Portfolio. If you already own, continue to hold the existing position, if you do not currently hold XLP, a new position can be considered on dips below the buy limit.
![[SPDR Consumer Discretionary (XLY) Chart]](/UploadedImage/AIN_1121_20211007_XLY.jpg)
![[SPDR Consumer Staples (XLP) Chart]](/UploadedImage/AIN_1121_20211007_XLP.jpg)
The line between Broker/Dealer and Banking sectors is somewhat blurry with each sector averaging gains of 21.2% and 19.3% over the last 5 years, respectively. Instead of trading two smaller, somewhat less liquid ETFs, SPDR Financial (XLF) appears to be the better choice. Use a buy limit of $38.10 and a stop loss of $34.29 once a position has been entered. The auto sell is $47.27. Its holdings cover all things financial from insurance companies to stock exchanges. Top 5 holdings are: Berkshire Hathaway, JPMorgan Chase, Bank of America, Wells Fargo and Citigroup.
![[SPDR Financial (XLF) Chart]](/UploadedImage/AIN_1121_20211007_XLF.jpg)
Another area exhibiting a reasonable amount of overlap is the Healthcare and Pharmaceutical sectors, at least as far as many ETFs are concerned. Healthcare has racked up a 7.7% average return over the past five years while Pharmaceutical alone has been just 4.8%. SPDR Health Care (XLV) does an excellent job of representing both sectors and comes with the added bonus of holding several well-established biotechnology companies as well. XLV is attractive below current levels with a buy limit of $124.90. The stop loss is $112.41 and auto sell is $150.99. Top five holdings are: Johnson & Johnson, UnitedHealth Group, Pfizer, Thermo Fisher Scientific and Abbott Laboratories.
![[SPDR Health Care (XLV) Chart]](/UploadedImage/AIN_1121_20211007_XLV.jpg)
Industrials have a favorable period that runs from the end of October through the middle of May with historical returns averaging 11.0% over the last 15-year period. Buy SPDR Industrials (XLI) with a buy limit of $99.60. Once purchased, set a stop loss of $89.64 and an auto sell of $121.61. Top 5 holdings are: Honeywell, Union Pacific, Raytheon Technologies, United Parcel Service, and Boeing.
Materials have a favorable period that runs from the beginning of October through the beginning of May with historical returns of 14.3% over the last 15-year period. Buy SPDR Materials (XLB) with a buy limit of $80.05. Once purchased, set a stop loss of $72.05 and an auto sell of $100.65. Top 5 holdings are: Linde, Sherman-Williams, Air Products & Chemicals, Ecolab and Freeport-McMoRan.
Computer Tech comes into favor in early October and remains so until the beginning of January. This trade has averaged 8.2% and 8.2% gains over the last 15- and 5-year periods, respectively. SPDR Technology (XLK) is the top selection. Enter this trade with a buy limit of $150.15 and employ a stop loss of $135.14. Take profits at the auto sell of $178.71. Top 5 holdings are: Apple, Microsoft, NVIDIA, Visa and PayPal. Apple and Microsoft combined account for 43.31% of total assets as of October 6 close.
Real Estate has seen returns of 9.0% over the last 15 years from the end of October to the beginning of May. Vanguard REIT (VNQ) is our choice. Use a buy limit of $101.75 and a stop loss of $91.58 once a position has been entered. The auto sell is $122.00. Top 5 holdings are: Vanguard Real Estate II Index fund, American Tower, Prologis, Crown Castle Intl and Equinix.
Sector Rotation ETF Portfolio Updates
September’s market slump did ding some positions in the portfolio. iShares NASDAQ Biotech (IBB) was stopped out on October 4 as the market retested its recent lows. SPDR S&P Biotech (XBI) also retreated but remained above its stop loss. Since Biotech’s favorable season lasts until next March, XBI and be considered on dips below $120.00. Adjust XBI’s stop loss to $108.00.
Demand for crude oil apparently has caught suppliers off-guard and as a result price has been climbing higher. ProShares UltraShort Bloomberg Crude (SCO) was added to the portfolio on September 13 and then stopped out on September 27. With crude displaying strength in its typically seasonally weak period we will move on.
With the end of the Worst Months, May through October, approaching we are going to close out a few trades. SPDR Utilities (XLU) can be sold. Short trades in iShares Transportation (IYT) and SPDR Industrials (XLI) can be covered/closed out. For tracking purposes these three trades will be closed out of the portfolio using their respective average prices on October 8.
|
September Delivers Seasonal Weakness Setting Up October Buy
|
|
By:
Jeffrey A. Hirsch & Christopher Mistal
|
September 30, 2021
|
|
|
|
As S&P 500 and NASDAQ log their worst months since March 2020 and we head into October, it is the perfect time to prepare for our Best Months Seasonal MACD Buy Signal and yearend. October is the last month of the “Worst Months, and the first month of the much more bullish seasonal Q4 period – but has the notorious reputation for volatility and market selloffs. Our Best Months Seasonal MACD Buy Signal can trigger anytime on or after October 1. (See the accompanying MACD Update below for the particulars on that signal.)
The market did sell off around the 5% or so in September we projected last month. We do not expect a major correction in October, but another pullback near the September lows or lower in the 5% range from here is quite possible. That would be in the vicinity of the elusive 10% correction from the recent August/September highs. DJIA, S&P 500 and NASDAQ took out the September 21 closing lows at today’s close. Everyone is still buzzing about September/October seasonal weakness and “Octoberphobia” has been known to become a self-fulfilling prophecy.
Many of the same geopolitical, political, fundamental and technical headwinds we highlighted in the September and October Outlooks remain present. Congress passed the funding bill to avert a government shutdown just before the market closed today ahead of the September 30 midnight deadline. The biggest risk to the market remains the Fed. An uptick in taper talk or chatter about the Fed raising rates ahead of schedule could trigger another selloff.
But, any meaningful decline that occurs in October is most likely to be an excellent buying opportunity and a near perfect set up for our Seasonal MACD Buy Signal. Since our MACD Seasonal Sell Signals on April 22 for DJIA and S&P 500 and July 14 for NASDAQ, DJIA is now just 0.1% above that level, S&P 500 is 4.2% above and NASDAQ is -1.3% below it. Seasonality is alive and well. So we stick with system.
Sticking with the Seasonal Switching Strategy
Over the long-term, since 1950, our Best Months Switching Strategy with MACD timing has outperformed the major indexes (pages 54 and 60 of 2021 Almanac). Throughout those 71 years for DJIA and S&P 500 and 50 years for NASDAQ there were periods where the strategy outperformed and periods where it underperformed. The roaring bull market of the nineties was one period were our Switching Strategy lagged as the market generally roared higher all year long. But when that period came to an end, the Switching Strategy reclaimed lost ground as DJIA suffered “Worst Months” declines in seven out of eight years from 1998 to 2005.
Shortly thereafter the credit and housing market bubbles burst triggering the financial crisis of 2008-09 along with the worst bear market and recession since the Great Depression. In response, the Federal government and Fed took unprecedented (then) actions to support the economy and the market. TARP and massive fiscal stimulus was provided by the government while the Fed cuts interest rates to nearly zero and the market and economy began to recover. Quantitative easing (treasury and mortgage bond buying) by the Fed provided further support and liquidity to the financial system. As a result the market and the economy began to recover, and the market enjoyed well above average gains during the “Worst Months” of 2009.
![[BSM Table]](/UploadedImage/AIN_1121_20210930_BSM_Since_2009_Table.jpg)
Since the March 2009 market bottom, the market has enjoyed five periods of outsized gains during the “Worst Months.” The first was 2009; then again in 2010, 2013, 2017 and 2020. ZIRP (zero interest policy) and the recovery from the 2007-2009 Financial Crisis enhanced the Worst Months of 2010, a third round of QE boosted 2013, corporate tax cut anticipation lifted 2017 and the 2020 recovery from the Covid-19 shutdown and massive fiscal spending pumped up 2020. It is primarily these five years and the corresponding seemingly one-off events that have resulted in the market outperforming our Seasonal Switching Strategy over the last twelve years. We are of the opinion that this is an exception, not some kind of new normal where black swan events and major disruptions occur every few years.
Some gains have been left on the table by the Seasonal Switching Strategy however; this is only part of the bigger picture. The potential benefits of reduced risk have not been taken into consideration. NASDAQ has not suffered a single decline during its “Best Months” since 2007 (page 60 2021 STA) and its average gain has been 12.2%. 2020’s “Best Months” declines by DJIA and S&P 500 were their first since 2008. Even during the last twelve years the pattern of “Best Months” and “Worst Months” has held up. Though the current “Worst Months” period has not ended yet, average performance is still about two times (2X) better during the “Best Months.”
Based upon history, the Seasonal Switching Strategy may be on the verge of beginning its next stretch of outperformance. Life will be forever changed by Covid-19, but in general we have seen a return to a more normal economy and way of life this year. Uncertainty does remain high but many have resumed normal, pre-covid-19 activities. Recent market behavior indicates to us that seasonality is not dead and that the Seasonal Switching Strategy is likely poised for continued outperformance this year and beyond.
Seasonal MACD Buy Signal Update & Methodology
As we close the books on Q3 and turn the calendar to October the window for issuing our Seasonal MACD Buy signal opens. Using our pre-defined MACD parameters for our Seasonal Buy Signal of 8-17-9 we can see in the above charts that MACD has been trending lower since the early part of September with recent weakness only serving to push the indicator deeper into negative territory. Generally, the deeper below the zero-line MACD is the more reliable the subsequent crossover signal tends to be.
For recent and long-term members, the criteria to issue our Seasonal MACD Buy Signal is a new MACD crossover on or after October 1 from DJIA, S&P 500 and NASDAQ and all three indexes must agree. Tomorrow the date requirement will be met then it will be up to the market to get out of its recent funk. When all criteria have been met, we will issue an email Alert.