|
Market at a Glance - October 23, 2025
|
|
By:
Christopher Mistal
|
October 23, 2025
|
|
|
|
Please take a moment and register for our members’ only webinar, November 2025 Outlook & Update on Wednesday October 29, 2025, at 4:00 PM EDT here:
Please join us for an Almanac Investor Member’s Only discussion of recent market action with time for Q & A at the end. Jeff and Chris will cover their outlook for November 2025 and beyond, review the Tactical Seasonal Switching Strategy ETF, Sector Rotation ETF, and Stock Portfolio holdings and trades. We will also share our assessments of the economy, tariffs, Fed, inflation, geopolitical events as well as relevant updates to seasonals now in play.
If you are unable to attend the live event, please still register. Within a day of completion, we will send out an email with links to access the recording and the slides to everyone that registers.
After registering, you will receive a confirmation email containing information about joining the webinar and a reminder message.
Market at a Glance
10/23/2025: Dow 46734.61 | S&P 6738.44 | NASDAQ 22941.80 | Russell 2K 2482.66 | NYSE 21623.82 | Value Line Arith 12182.69
Seasonal: Bullish. November is the best DJIA and S&P 500 month of the year since 1950, second best NASDAQ month (since 1971). November is the first month of the “Best Six/Eight Months” and the best three consecutive month span, November to January. In post-election years, November remains a solid performer with average performance ranging from 1.6% from DJIA to 2.2% from NASDAQ. Seven-trading day Halloween Trade spans the last four days of October and the first three of November.
Fundamental: Mixed. According to the most recent update (October 17), the Atlanta Fed’s GDPNow model’s forecast for Q3 GDP is up to 3.9% and trending higher, but employment data has been soft and accompanied by negative revisions. The Fed is on course to cut interest rates, but inflation is still running above target. The Federal government is shutdown, at least partially, while tariff concerns, and the Russian-Ukraine war are still ongoing. In the near-term, more volatility and choppiness are likely as headlines swing from positive to negative.
Technical: Consolidating. DJIA, S&P 500, NASDAQ and Russell 2000 all logged new all-time closing highs this month. Most occurred near the beginning of the month. During the October 10th market selloff indexes tested their respective 50-day moving averages and then promptly rebounded. Market dips have repeatedly been brief and relatively shallow. There could be another headline-driven retest of 50-day moving averages, but it will likely be followed by another rebound and more all-time closing highs. A meaningful break below October 10th closes could be a concern.
Monetary: 4.00 – 4.25%. Absent some key economic data, the Fed’s job has only gotten more challenging in recent weeks. Current interest rate expectations strongly suggest at least two more 0.25% cuts by the end of the year. Potential benefits of lower rates appear to be already arriving with mortgage rates retreating to their lowest level in about a year. Refinance demand has also surged.
Sentiment: Neutral. According to
Investor’s Intelligence Advisors Sentiment survey Bullish advisors stand at 52.8%. Correction advisors are up to 32.1% and Bearish advisors were at 15.1% as of their October 22 release. The largest change in the past four weeks has been in the Correction advisors increasing in count from 24.5%. The decrease in Bullish advisors was adequate to undo the cautious stance from last month. Overall, sentiment appears to support a continued, yet selective approach to buying. The rather sizable number of “not” bulls could quickly get pulled back should the indexes break out and close at new all-time highs again.
|
November Outlook: Octoberphobia Sets Up Q4 Rally & Best 3 Months
|
|
By:
Jeffrey A. Hirsch & Christopher Mistal
|
October 23, 2025
|
|
|
|
October volatility has spooked many investors and may have spooked many of you. But as Almanac Investors you know this is prototypical market behavior this time of year. This Octoberhobia as we called it is precisely what sets up Q4 market magic rallies and the best three months of the year (November-January). And why we still expect a monster Q4 rally and S&P 7100 by yearend.
Next year is a different story entirely and you can read about it in our preliminary 2026 Outlook on pages 10-11 of the new 2026 Stock Trader’s Almanac, if you have not already. Most of you should have your complimentary copy by now (please let us know if you have not received it). Overseas Almanacs are still shipping. For now, we are bullish on the market’s prospects for the next several months and we are poised to break out to new highs shortly.
So, what’s really going on right now? There is a lot of headline volatility, bubble chatter, meme stock and hot stock action keeping traders and investors on edge. We hear lots of calls and discussions about “the top” across a multitude of social and mainstream media platforms and outlets as well as in our personal and professional circles. But we all know that bull markets end when everyone least expects it and bear markets get triggered by some external shock.
And what drives a bear market? Earnings, right? Stocks may look expensive, but the bulk of the market keeps reporting good numbers. Sure, there are some misses, but overall earnings and revenue of market leading companies continue to grow. The federal government may be officially shutdown while the politicians in congress jockey for position, but as far as we can tell the business of this country continues to power ahead. History shows that the market does just fine during and after these shutdown battles.
If the 10-year Treasury yield is any indication, and we believe it is, the recent dips below 4% are further evidence that rates are coming down and they appear to be coming down in an orderly fashion, not in response to some economic emergency. Mortgage rates fell to a 2025 low today which should give the housing market a boost. Lower rates increase stock buybacks, boost earnings and stock prices. Tax cuts and deregulation also continue to stimulate the economy and an influx of foreign investment in the U.S. doesn’t hurt. A quick look at the
CME FedWatch Tool shows a >90% probability of half point cut by yearend, we expect two quarter-point cuts at the next two FOMC meetings
Now let’s turn to the world stage. Despite the naysayers and doubters, the ceasefire in Gaza is holding and the current calm in the Mideast is bullish for stocks. The Russia/Ukraine war is another story and there does not appear to be much hope for ending that conflict anytime soon, but that is old news. Then there is China and the trade war and the recent rare earth dustup.
China is a one of the U.S.’s fiercest competitors; economically, diplomatically and geopolitically. China is a communist dictatorship that keeps extremely tight control over everything, including and especially rare earths. China’s latest directive on rare earths isn’t a new policy it’s another shot across Trumps bow in the trade war. The October 9 memo from the Ministry of Commerce just memorialized long standing policy. Beijing has treated rare earths as a national security asset since at least the 2010 export restriction episode with Japan. So, the memo that they will hold rare earths even tighter, is not a new stance, it’s just Xi playing hardball to cover for China’s deflating economy and other woes. The rest of the world is tiring of China’s strong-arm tactics.
“Best” Worst Six Months: Monster Q4 Rally, S&P 7100 Still in Play
Despite all the talk of spooky October market action, headline volatility and the bears coming out of the woodwork the S&P sold off a whopping 3.16% from the intraday high on 10/9 to the low on 10/10 and bounced right off the 50 DMA as illustrated in the candlestick chart of the S&P over the past six months. As of today’s close, S&P is up 0.7% for the month of October and heading into one of the most bullish short-term trades of the year.
We have also updated the S&P 500 Post-Election Year Seasonal Pattern chart, and the index remains on track with the most bullish post-election year pattern, the green “since 1985” line. Our Best-Case Scenario for a 20% gain for the S&P 500 remains in play. The Q4 Monster Rally is about to commence, and S&P 7100 is in our sights.
While we may be slightly off the new all-time highs reached two weeks ago this continues to be the “best” Worst Six Months since 1950. With six trading days left this May-October WSM is now up 21.0% at today’s close. As you can see from the updated table this bodes well for Q4, the full year and the next Best Six Months November-April.
Typical Octoberphobia struck again but the pullback has proven rather tame, shaving a mere 3.16% off S&P intraday two weeks ago. And now, as is clear from the updated Typical October chart, the market has likely turned higher to rally through month end and yearend.
Halloween Trade and Bitcoin Buy
This brings us to a couple of trades for you. One of the most bullish short-term stretches on the calendar are the last several trading days of October through the first few days of November, specifically the last 4 days of October plus the first 3 days of November. The “Halloween Trade.” Over this 7-day period Dow, S&P and NASDAQ are up 80.6% of the time since 1994 with average gains of 1.9% for Dow and S&P and 2.3% for NASDAQ. Russell 2000 is up 77.4% of the time with an average gain of 2.3%,
![[Halloween Trade Bar Chart]](/UploadedImage/AIN_1125_20251023_Halloween_Trade_900.jpg)
Finally, after getting stopped out of our iShares Bitcoin Trust ETF (IBIT), we are recommending buying IBIT again for the Q4 Rally with a Buy Limit at todays close of 62.56. No initial stop loss. It will be added to the portfolio at tomorrow’s average price (day’s high, plus low divided by 2) if it trades below 62.56 at anytime during the day. If it does not trade below 62.56 tomorrow, we will keep the buy recommendation live at the 62.56 buy limit and will add it at that price if it trades at or below that price until the next update.
So, ignore the headlines and bears and put your rally caps on for what promises to be a solid upside move over the next several months. The Best Three Months of the year are about to begin, the Q4 Monster Rally is lurking and the Santa Claus Rally is coming soon.
Pulse of the Market
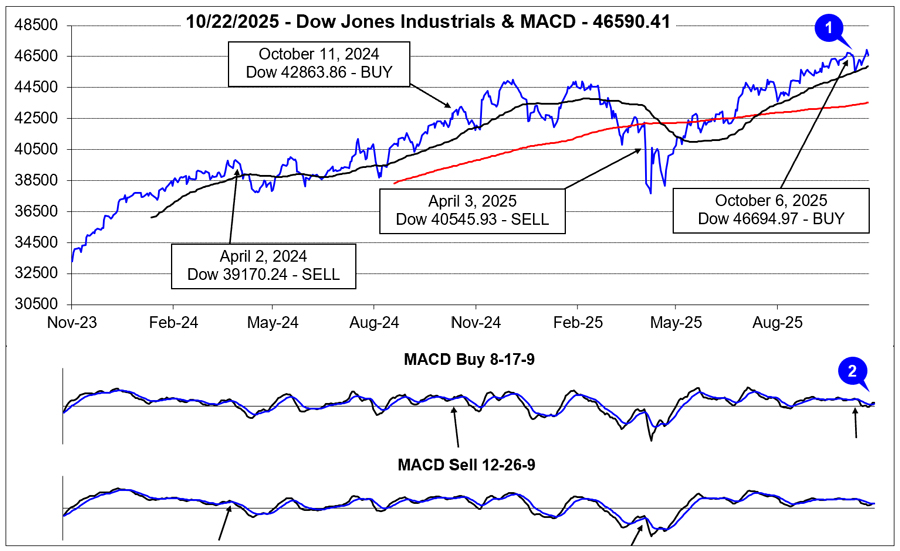
After kicking off October with new all-time closing highs, Octoberphobia struck with vengeance on October 10. DJIA dropped 1.9% that day and closed under its 50-day moving average (1). The catalyst was the threat of additional, steep tariffs on imports from China shortly after the communist dictatorship formally announced it was tightening its controls on exports of rare earth minerals. However, DJIA quickly recovered, erasing all of its declines and closed at a new all-time high earlier this week.
DJIA’s brisk retreat was exactly the “headline volatility” we mentioned
when the Seasonal MACD Buy signal triggered on the close on October 6th. Since then, the faster and slowing moving MACD indicators applied to DJIA briefly turned negative but are now both positive (2). In the near term, headline driven market volatility remains a headwind, but DJIA and the market still appear on course for a solid Q4 rally. Buying weakness while awaiting the end of the federal government shutdown, Fed interest rate cuts, and more trade deals can still be considered.
At first glance, the Pulse of the Market table contains quite a bit of red. This volatility has likely kept many on edge (and on the sidelines). Instead of focusing on that, note the gains that have occurred over the last 20 weeks. DJIA is up 8.0% from its June 6, close through last Friday (3). S&P 500 has climbed 11.1% (4) and NASDAQ has advanced a whopping 16.1% (5). Choppy week-to-week performance is likely to persist throughout the remainder of the year right along with further gains and new all-time highs.
Over the last four full weeks, market breadth has been seesawing with the major indexes (6). NYSE Weekly Advancers have outnumbered Weekly Decliners during positive weeks and vice-a-versa during negative weeks. Nothing unusual there. What would be of potential concern would be another week like week ending September 19th where NYSE Weekly Decliners outnumbered Weekly Advancers as the following week was down.
New 52-week Highs and Lows (7) are giving off mixed signals. Their respective trends have been choppy over the last four weeks, and the net result has been fewer New 52-week Highs and more New Lows. Some of the choppiness is likely the result of rotation due to the start of a new quarter. Another source could be just the retreat in the major indexes after closing at new all-time highs earlier this month. Ideally, we would like to see the number of New Highs steadily expanding while New Lows declined and/or stabilized around a low level.
Short-term and long-term Treasury bond yields continue to trend lower (8). Historically, lower interest rates have been positive for consumers and stocks. Interest rates may have also finally retreated sufficiently to revive the housing market with mortgage rates falling to the lowest level in about a year.
Click for larger graphic…
|
November 2025 Almanac: Best Month for DJIA & S&P 500
|
|
By:
Jeffrey A. Hirsch & Christopher Mistal
|
October 16, 2025
|
|
|
|
[Publishing schedule update: Our November Outlook will be emailed after the market’s close on October 23 and our Member’s only Webinar will be held on October 29.]
November begins the “Best Six Months” for the DJIA and S&P 500, and the “Best Eight Months” for NASDAQ. Small caps come into favor during November, but don’t really take off until the last two weeks of the year. November is the best month of the year for DJIA, S&P 500 (since 1950), Russell 1000 (since 1979), and Russell 2000 (since 1979). November is the second best for NASDAQ (since 1971). Average performance ranges from 1.9% by DJIA and S&P 500 to a solid 2.6% by Russell 2000.
November maintains its status among the top performing months as fourth-quarter cash inflows from institutions have historically driven November to lead the best consecutive three-month span November-January. However, the month has taken hits during bear markets and November 2000, down –22.9% (undecided election and a nascent bear), was NASDAQ’s second worst month on record—only October 1987 was worse.
![[Best Consecutive 3-Months Bar Chart]](/UploadedImage/AIN_1125_20251016_Best_3_Months_Barchart.jpg)
In post-election years, November’s market prowess is essentially unchanged. DJIA has advanced in 14 of the last 18 post-election years since 1953 with an average gain of 1.6%. DJIA had been up 11-straight post-election year Novembers until 2021. Prior to that DJIA’s last losing post-election year November was all the way back in 1973 (-14.0%, Arab oil embargo began 10/19/1973). S&P 500 has been up 13 in the past 18 post-election years. Small caps perform well with Russell 2000 climbing in 8 of the past 11 post-election years, averaging 2.1%. The only real blemishes in the November post-election year record are 1969 (DJIA –5.1%), 1973 (DJIA –14.0%, OPEC oil embargo), and 2021 (DJIA –3.7%).
![[Post-Election-Year Novembers Table]](/UploadedImage/AIN_1125_20251016_PE_November_Mini_table.jpg)
Monthly options expiration often coincides with the week before Thanksgiving as it does this year. DJIA posted ten straight gains 1993-2002 and has been up 21 of the last 32 weeks before Thanksgiving but has been down six of the last eight. The Monday of expiration week has been streaky, but the net result since 1994 is 19 DJIA gains in 31 years with 14 advances occurring in the last 21 years. Options expiration day has a bullish bias, DJIA up 16 of the last 23, but five of the declines have come in the last nine years. The week after expiration has been a mixed bag more recently. DJIA has been up nine of the last thirteen after being down five of six from 2006 to 2011.
![[Recent 21-Year November Seasonal Pattern Chart]](/UploadedImage/AIN_1125_20251016_November_Seasonal_Chart.jpg)
Being a bullish month, November has twelve bullish days based upon S&P 500, with a string of six in a row starting on its first trading day. Although historically a bullish month, November does have weak points. DJIA and Russell 2000 have exhibited the greatest strength at the beginning and end of November. Russell 2000 is notably bearish on the 12th trading day of the month; the small-cap benchmark has risen just eleven times in the last 41 years (since 1984). The Russell 2000’s average decline is 0.41% on the day. Some recent weakness around Thanksgiving has shifted DJIA and S&P 500 strength to mirror that of NASDAQ and Russell 2000 with the majority of bullish days at the beginning and end of the month. The best way to trade Thanksgiving is to go long into any weakness before the holiday and exit into strength just before or after.
|
November 2025 Strategy Calendar
|
|
By:
Christopher Mistal
|
October 16, 2025
|
|
|
|
|
Stock & ETF Portfolio Updates: October New All-Time Highs Bullish
|
|
By:
Christopher Mistal
|
October 09, 2025
|
|
|
|
Yesterday, October 8, S&P 500 and NASDAQ both closed at new all-time highs (ATH). For S&P 500 it was the fifth time this October while it was NASDAQ’s third time closing at a new ATH. Despite concerns about the length and gains of the market’s rally since its early April lows, new ATHs in October have historically been bullish in the near-term.
Including this year, S&P 500 has closed at one or more new ATHs 22 times in the month of October since 1950. In nine of the previous 21 occurrences, S&P 500 closed at a new ATH five or more times (year and performance in bold). Whether it was once, five times, or more average performance in Q4 improved compared to All Years and after five ATHs, Q4 was up 100% of the time with an average gain of 5.62%. In the near-term, data suggests fear of missing out, expectations for Fed interest rate cuts and then holiday cheer will likely keep the market’s bullish momentum alive and well through yearend.
Tactical Seasonal Switching Strategy ETF Portfolio Updates
In accordance with our
Seasonal MACD Buy signal email Issue sent after the close on Monday, October 6,
SPDR DJIA (DIA),
SPDR S&P 500 (SPY),
Invesco QQQ (QQQ), and
iShares Russell 2000 (IWM) have all been added to the portfolio using their respective average daily price from October 7.
DIA, SPY, QQQ, and IWM can still be considered at current levels up to their buy limits. As of October 8, close, these four positions were up an average of 0.4% with QQQ performing the best.
“Worst Months” positions in iShares 20+ Year Treasury Bond (TLT), iShares Core US Aggregate Bond (AGG) Vanguard Total Bond Market (BND), iShares Short Treasury Bond (SHV), and iShares 0-3 Month Treasury Bond (SGOV) were also closed out of the portfolio using their respective average prices on October 7. Excluding dividends and any trading fees, these five bond ETFs were essentially unchanged. AGG eked out a 1.5% price advance while TLT slipped 2.1%. Reasonably solid economic growth and inflation remaining above 2% are two likely reasons why TLT, AGG, and BND did not advance. However, SHV and SGOV did perform as expected. Their price remained relatively stable while paying a handsome monthly dividend, yielding 4.3% and higher over the past five months or so.
Sector Rotation ETF Portfolio Updates
Also in accordance with our Seasonal MACD Buy signal, all eleven new ETF Trades from the
October ETF basket have been added to the Sector Rotation portfolio using their respective average prices from October 7. Corresponding buy limits, stop losses, and auto-sell prices have been updated in the table below.
IYT, IYZ, SOXX, XLY, XLP, XLF, XLV, XLI, XLB, XLK, and VNQ can still be considered on dips or at current levels.
IBB, XBI, IYW, and IBIT were also added to the portfolio using their average price on October 7. IBB, XBI, IYW, and IBIT can still be considered at current levels or on dips below their buy limits.
For tracking purposes, the existing position in SPDR Consumer Staples (XLP) has been closed out. This position was held as a “Worst Months” defensive position. As a result of broad market strength during this year’s “Worst Months,” XLP declined 4.9%.
SPDR Utilities (XLU) was also closed out of the portfolio on October 3 for a 19.0% gain when it first traded above its auto-sell price. Rising electricity prices driven by AI demand were a catalyst for XLU’s well above average gain this year.
The trade in iShares Silver (SLV) is cancelled. There could be additional upside potential available in SLV but with an existing position in SPDR Gold (GLD) that is also working well we have adequate precious metals exposure already.
Disclosure note: Officers of Hirsch Holdings Inc hold positions in DBA, DIA, EFAV, EFV, EZU, FXE, FXF, IBIT, IDV, IWM, and QQQ in personal accounts.
Stock Portfolio Updates
Over the past four weeks, through the close on October 8, the Almanac Investor Stock Portfolio was up 0.9%, excluding dividends and any potential interest on the cash position, compared to a 3.4% advance by S&P 500 and a 4.5% gain by Russell 2000. Across the portfolio, mid-cap positions were best on average, advancing 6.1% followed by small-caps, up 0.6%.
From the
September Stock Basket, 13 of the 16 new trade ideas have been added to the portfolio.
Ezcorp (EZPW), Rambus (RMBS), and Medpace Holdings (MEDP) have not traded below their buy limits and can still be considered on dips. Of the 13 that have been added, five were positive and eight were down as of the close on October 8.
Collegium Pharmaceutical (COLL) had a solid run ahead of and after its earnings release in August. Shares appear to be consolidating those gains now. Its core opioid market is mature and likely slowly shrinking, but its new management is shifting focus into the growing ADHD market with Jornay PM. COLL can be considered at current levels.
HealWell AI (HWAIF) can still be considered on dips below its buy limit of $1. Shares have recently reawakened trading as high as $1.23 intraday in late September. Management recently announced the global launch of AmadeusAI. HWAIF is still a Ground Floor stock. Management is making progress, revenues are growing and it is profitable, but it still needs a U.S.-based exchange listing and broader “AI” awareness. If you are looking for a potentially undervalued AI company, HWAIF is worth a deeper look.
Hess Midstream (HESM) is the worst performing new trade idea, off 15.2%. HESM did close below its stop loss today, but we are not going to close this position out. HESM woes began shortly after it was added to the portfolio when it provided updated financial guidance. At first quick look it did seem negative, however, all they really did was move the goal post to the lower end of an existing range. The resultant selloff does appear to be overdone at this point. Shares closed at a new 52-week low today and volume has retreated, suggesting selling pressure could be abating. HESM can be considered at current levels with a stop loss at $31.97.
All other positions from the September Stock Basket can still be considered on dips or at current levels. Please note some stop losses and buy limits have been updated to account for recent market moves.
Disclosure note: Officers of Hirsch Holdings Inc. held positions in APH, AROC, BOOT, CBRE, COLL, CVLT, EHC, ENSG, HESM, HWAIF, JLL, PAHC, SMCI, SNEX, TBBK in personal accounts.
|
Seasonal MACD & Tactical Switching Strategy Portfolio Updates
|
|
By:
Jeffrey A. Hirsch & Christopher Mistal
|
October 06, 2025
|
|
|
|
Faster moving MACD “Buy” indicators applied to DJIA, S&P 500 and NASDAQ are all positive as of today’s close. With all three indices confirming, we are issuing our Seasonal MACD Buy Signal.
After the tariff induced market selloff in April, the market has been resilient rallying straight through the worst two months of the year, August and September, and closing at new all-time highs repeatedly. This bullish action has pushed our outlook for the remainder of the year to our most bullish scenario from the 2025 Forecast. S&P 500 appears to be on course for 7100 by yearend and a full-year gain of around 20%. Economic growth appears to be picking up after GDP was negative in Q1. AI-driven spending and investment remain robust, and the Fed is on a path to additional interest rate cuts.
Headwinds do remain and headline volatility is still a concern. We are in the midst of a federal government shutdown. Inflation continues to be stubbornly above the Fed’s 2% target. Conflict is still ongoing in the Mideast and an end to Russia’s invasion of Ukraine still appears distant. Valuations are also stretched. Even so, the major indexes continue to climb to new all-time highs. Though never a certainty, we will stick with the system and begin establishing new long positions in the ETF portfolios.
Tactical Seasonal Switching Strategy ETF Portfolio Trades
Buy SPDR DJIA (DIA), SPDR S&P 500 (SPY), Invesco QQQ (QQQ), and iShares Russell 2000 (IWM) in the Almanac Investor Tactical Seasonal Switching Strategy Portfolio. These positions will be equally weighted in the portfolio. Buy limits for DIA, SPY, QQQ and IWM are initially today’s closing price plus 1% (closing price times 1.01 = buy limit). For tracking purposes, these ETFs will be added to the portfolio using their respective average prices on Tuesday, October 7. This price will be calculated by summing the high and low prices and dividing by two.
Sell “Worst Months” partial positions in iShares 20+ Year Treasury Bond (TLT), iShares Core US Aggregate Bond (AGG) and Vanguard Total Bond Market (BND). All three have pulled back from recent highs and are showing mixed performance as of today’s close (October 6). For tracking purposes, they will also be closed out of the portfolio on Tuesday, October 7, using their respective average daily prices.
Sell iShares Short Treasury Bond (SHV) and iShares 0-3 Month Treasury Bond (SGOV). For tracking purposes, they will also be closed out of the portfolio on Tuesday, October 7, using their respective average daily prices.
Sector Rotation ETF Portfolio
Buy new long positions in IBB, IYW, IBIT, IYT, IYZ, SOXX, XLY, XLP, XLF, XLV, XLI, XLB, XLK, and VNQ. Use a new 1% Buy Limit based upon today’s closing price for these positions as detailed above. For tracking purposes, these ETFs will be added to the portfolio using their respective average prices also on October 7. Once these positions are added to the portfolio, we will update their respective stop loss and auto-sell prices.
Disclosure note: Officers of Hirsch Holdings Inc hold positions in DBA, EFAV, EFV, EZU, FXE, FXF, IDV, and XLP in personal accounts.
|
ETF Trades: October ETF Basket & Seasonal MACD Update – Still Pending!
|
|
By:
Christopher Mistal
|
October 02, 2025
|
|
|
|
For those who were unable to attend the member’s only webinar on Wednesday, the slides and video recording are available
here (or copy and paste in a new browser window:
https://www.stocktradersalmanac.com/LandingPages/webinar-archive.aspx). Jeff made the case for how S&P 500 could reach 7100 by the end of the year along with presenting updated versions of many of the seasonal pattern charts we have been tracking throughout the year. He also touched on Bitcoin, Ether, gold, silver, copper, crude oil and natural gas technicals and their respective seasonal setups and outlooks.
Historically when the market has defied typical seasonal weakness in August and September, subsequent performance in Q4 has been above average. Despite a mixed labor market, the economy appears to be on reasonably firm footing. Tariffs have not caused inflation to surge. The Fed is easing monetary policy while the AI-fueled boom continues. Barring the occasional headline induced volatility, the path of least resistance for the market is still higher. A trend that has been firmly in place since early April. Further confirmation from our Seasonal MACD Buy signal is likely to arrive soon.
Seasonal MACD Buy Signal Update
As of today’s close, our Seasonal MACD Buy Signal is still on Hold. Faster moving 8-17-9 MACD indicators applied to DJIA and NASDAQ are negative. S&P 500’s modest gain did turn its MACD positive. Without agreement across DJIA, S&P 500, and NASDAQ, our Seasonal MACD Buy criteria have not been fully satisfied.
The criteria to issue our Seasonal MACD Buy Signal is:
1. A new buy signal crossover using our 8-17-9 MACD indicator AND
2. The crossover must occur on or after the first trading day of October AND
3. DJIA, S&P 500 and NASDAQ MACD indicators must all agree.
Currently it would take single-day gains of +32.45 DJIA points (+0.07%) and +26.83 NASDAQ points (+0.12%) to turn DJIA and S&P 500 MACD indicators positive. If S&P 500 declines –6.42 points (–.10%), its MACD will turn negative. Continue to hold defensive, “Worst Months” positions. When all of the above criteria have been met, we will send a Special Email Alert.
Annual October Sector ETF New Trade Ideas
Each year while preparing the annual Stock Trader’s Almanac, we review and re-analyze our sector seasonalities (STA 2025 and 2026 pages 94, 96 and 98) to adjust for any new or developing trends. There have been some minor revisions made to our Sector Seasonality table in recent years, but for the most part, sector seasonality has been reasonably on track with many sectors producing the bulk of their annual gains during their traditionally favorable periods. There have also been a few exceptions recently, most notably the Semiconductor sector that enjoyed substantial outsized gains due to AI developments and expectations. Years of sector research allow us to specify whether the seasonality starts or finishes in the beginning third (B), middle third (M) or last third (E) of the month based upon the number of trading days in the month.
The 2026 Almanac table follows. Both long and short trade opportunities are researched and the most statistically viable appear below. Because indexes are not directly tradable, highly correlated exchange-traded funds (ETFs) are chosen to execute trades. When selecting a correlated ETF, we consider daily liquidity, length of time available, fees, and how closely it correlates to the sector index. Frequently this results in the use of many iShares and SPDR ETFs. Numerous other ETFs and mutual funds are available that may also be a better fit for your specific investment and trading objectives, and they are perfectly acceptable to substitute. Performance over the last 5-, 10- and 25-year time periods is included. We prefer to focus on the 25-year average performance as this period has sufficient data to be statistically significant by including bullish, bearish, and possibly even a flat year or two.
![[Stock Trader’s Almanac 2026 Sector Seasonality Table]](/UploadedImage/AIN_1125_20251002_2026_Sector_Seasonality_Table.jpg)
Entry and exit points in the above table will be the basis for our seasonal trades over the coming year. They are guidelines, as we generally look to enter new positions before the start of the favorable period and exit before its end. Occasionally a trade is closed out well in advance of the seasonality’s end. An outsized advance may trigger a trade at the suggested auto-sell price (a price target based upon past historical performance of the specific seasonality plus an additional percentage gain of 10% or 20%) or should strength fail to materialize, a stop loss could be reached.
There are thirteen sector seasonalities that enter their favorable periods in October. The following trade ideas are made based upon these seasonalities. Currently, all buy limits (the suggested maximum to pay for a share) are below current market levels as the market appears to be searching for support as longer-term Treasury yields have been creeping higher and geopolitical concerns are elevated. When our Seasonal MACD Buy signal triggers, we will evaluate adding open trade ideas at that time.
Trades for October Sector Seasonalities
Transports enter their historically favorable season at the beginning of October, and it generally lasts until May. iShares DJ Transports (IYT) is attractive on dips below current levels with a buy limit of $70.50. The suggested stop loss is $62.22 and auto-sell is $88.98. Top 5 holdings are: Uber, Union Pacific, United Parcel Service, Norfolk Southern, and CSX Corp. Consumers are facing headwinds, but betting against them has not been a good strategy over any lengthy time period. This sector delivers for the consumer. Tariffs are likely dampening international activity, but if their intended consequence is to boost domestic production then this sector’s domestic operations could thrive.
![[iShares DJ Transports (IYT) Chart]](/UploadedImage/AIN_1124_20241003_IYT.jpg)
Over the last 25 years, Telecom has generated an average return of 5.1% during its bullish seasonality from the middle of October to around yearend. The top ETF within this sector is iShares DJ US Telecom (IYZ). Use a buy limit of $31.95 and stop loss of $28.20. If above average gains materialize, take profits at the auto-sell of $36.95. Top 5 holdings are: Cisco Systems, AT&T, Verizon, AST SpaceMobile and Arista Networks. Lower interest rates and AI’s use of networks is likely to continue to drive the sector higher.
![[iShares DJ US Telecom (IYZ) Chart]](/UploadedImage/AIN_1125_20251002_IYZ.jpg)
Semiconductors come into favor near October’s end and remain so until around mid-February. This trade has averaged 16.6% and 27.3% gains over the last 25- and 5-year periods, respectively. iShares Semiconductor (SOXX) is the top selection. Establish new positions with a buy limit of $276.20 and utilize a stop loss of $243.75. Take profits at the auto-sell of $354.35. Top 5 holdings are: Broadcom, Nvidia, Advanced Micro Devices, Qualcomm, and Micron Technology. Aside from AI, these companies design and produce the chips that run or provide advanced features to nearly every modern convenience enjoyed daily around the world.
![[iShares Semiconductor (SOXX) Chart]](/UploadedImage/AIN_1125_20251002_SOXX.jpg)
Although consumer spending is spilt into two distinct sectors, Discretionary and Staples, their favorable seasons run concurrently from the beginning of October to the beginning of June in the following year. Over the past 25 years Discretionary has an average gain of 13.1% and Staples 8.5%. SPDR Consumer Discretionary (XLY) and SPDR Consumer Staples (XLP) are the preferred vehicles to execute these trades. XLY can be considered on dips below $238.10. An initial stop loss of $210.12 and an auto-sell at $296.25 are suggested. XLY Top 5 holdings are: Amazon.com, Tesla, Home Depot, McDonald’s, and Booking Holdings. Please note that AMZN and TSLA represent over 42% of XLY’s holdings as of October 1, 2025.
XLP could be purchased on dips below $77.40. Our suggested stop loss is $68.31 and set an auto-sell at $92.35. XLP Top 5 holdings are: Walmart, Costco Wholesale, Procter & Gamble, Coca Cola, and Philip Morris. For tracking purposes, there are two XLP trades listed in the Sector Rotation ETF portfolio. The older position will be closed out when our Seasonal MACD Buy Signal triggers. Members holding an existing position could continue to hold and/or add to their existing XLP position.
![[SPDR Consumer Discretionary (XLY) Chart]](/UploadedImage/AIN_1125_20251002_XLY.jpg)
![[SPDR Consumer Staples (XLP) Chart]](/UploadedImage/AIN_1125_20251002_XLP.jpg)
The line between Broker/Dealer and Banking sectors is somewhat blurry with each sector averaging gains of 12.8% and 11.9% over the last 25 years, respectively. Instead of trading two smaller, somewhat less liquid ETFs, SPDR Financial (XLF) still appears to be the better choice. Consider using a buy limit of $52.85 and a stop loss of $46.64 once a position has been entered. The auto-sell is $65.08. Its holdings cover all things financial from insurance companies to stock exchanges. Top 5 holdings are: Berkshire Hathaway, JPMorgan Chase, Visa, Mastercard, and Bank of America. As long as the jobs market remains reasonably firm, profits for these two sectors are likely to hold up. And as the Fed cuts rates the yield curve is likely steepen, which has historically been positive for banks.
![[SPDR Financial (XLF) Chart]](/UploadedImage/AIN_1125_20251002_XLF.jpg)
Another area exhibiting a reasonable amount of overlap is the Healthcare and Pharmaceutical sectors, at least as far as many ETFs are concerned. Healthcare has racked up an 8.7% average return over the past 25 years while Pharmaceutical alone has been 6.2%. SPDR Health Care (XLV) does an excellent job of representing both sectors and comes with the bonus of also holding several well-established biotechnology companies. XLV is attractive, below current levels with a buy limit of $140.50. The stop loss is $123.99, and the auto-sell is $168.06. Top five holdings are: Eli Lilly, Johnson & Johnson, AbbVie, UnitedHealth Group, and Abbott Laboratories.
![[SPDR Health Care (XLV) Chart]](/UploadedImage/AIN_1125_20251002_XLV.jpg)
Industrials have a favorable period that runs from the end of October through the middle of May with historical returns averaging 11.3% over the last 25-year period. Buy SPDR Industrials (XLI) on dips with a buy limit of $152.65. Once purchased, set a stop loss of $134.71 and an auto-sell of $186.89. Top 5 holdings are: GE Aerospace, Caterpillar, RTX Corp, Uber, and GE Vernova. AI, Federal infrastructure spending, conflict in Europe and Mideast, and a growing global population will all support expanding demand for the products and services supplied by this sector.
![[SPDR Industrials (XLI) Chart]](/UploadedImage/AIN_1125_20251002_XLI.jpg)
Materials have a favorable period that runs from the beginning of October through the beginning of May with historical returns of 15.4% over the last 25-year period. Buy SPDR Materials (XLB) on dips with a buy limit of $87.45. Once purchased, set a stop loss of $77.17 and an auto-sell of $110.99. Top 5 holdings are: Linde, Newmont Corp, Sherman-Williams, Ecolab, and Vulcan Materials. U.S. GDP has improved this year which is likely to continue to create steady demand for the products supplied by the materials sector.
![[SPDR Materials (XLB) Chart]](/UploadedImage/AIN_1125_20251002_XLB.jpg)
Computer Tech has historically come into favor in early October and remained so until the beginning of January. This trade has averaged 11.4% and 13.2% gains over the last 25- and 5-year periods, respectively. SPDR Technology (XLK) is the top selection. Enter this trade on dips with a buy limit of $281.25 and employ a stop loss of $248.20. Take profits at the auto-sell of $344.67. Top 5 holdings are: NVIDIA, Microsoft, Apple, Broadcom, and Palantir. Apple, Microsoft, and NVIDIA combined account for 39.56% of total assets as of the October 1 close. It’s safe to say you are already familiar with these companies and currently use their products and/or services. Many are directly investing in AI and/or automation that is likely to continue to fuel the economy and market higher.
![[SPDR Technology (XLK) Chart]](/UploadedImage/AIN_1125_20251002_XLK.jpg)
Real Estate has seen returns of 10.7% over the last 25 years from the end of October to the beginning of May. Vanguard REIT (VNQ) is our choice. Use a buy limit of $90.55 and a stop loss of $79.91 once a position has been entered. The auto-sell is $110.22. Top 5 holdings are: Vanguard Real Estate II Index fund, Welltower, Prologis, American Tower, and Equinix. Lower interest rates should continue to support the real estate sector.
Sector Rotation ETF Portfolio Updates
There are two SPDR Consumer Staples (XLP) trades in the portfolio table below. For tracking purposes, the oldest position will be closed out when our Seasonal MACD Buy signal triggers and the new position will be added. As a “Worst Months” defensive position, XLP was essentially flat excluding dividends and any trading fees. If you hold an existing position in XLP, it can still be held or added to for the upcoming bullish seasonality.
SPDR Utilities (XLU), the other “Worst Months” position will also be closed out when our Seasonal MACD Buy signal triggers. XLU has performed well this year and was up 17.8% as of the close on October 1.
The three trades put in place to potentially benefit from a weaker U.S. dollar, FXE, FXF, and DBA are on Hold. The U.S. dollar has weakened, but the pace of its decline as slowed. Lower interest rates could cause the dollar to weaken further, but many other developed countries are also cutting their lending rates and weakening their own currency.
SPDR Gold (GLD) is on Hold. Gold has enjoyed a record setting run with repeated new all-time highs, but its rally may have gotten ahead of itself. It could be due for a pause and period of consolidation before resuming its rally. Silver has also surged higher. Unfortunately, iShares Silver (SLV) did not dip below its buy limit before the rally. If gold does take a breather, silver could also. SLV can still be considered on dips.
IBB, XBI, and IYW can also be considered on dips below their buy limits or when our Seasonal MACD Buy signal triggers. Associated sector seasonalities for biotech and infotech run until next year leaving ample time for further gains.
Our seasonal-based bitcoin trade, iShares Bitcoin (IBIT), just missed trading below our buy limit in late September. IBIT can still be considered on dips below $67.00 or when our Seasonal MACD Buy signal triggers.
Tactical Seasonal Switching Strategy ETF Portfolio Updates
In preparation for the start of the “Best Months” and our Seasonal MACD Buy,
Invesco QQQ (QQQ),
iShares Russell 2000 (IWM),
SPDR DJIA (DIA) and
SPDR S&P 500 (SPY) have been added to the portfolio table. These are our preferred ETFs to trade our Seasonal Switching Strategy. Alternate ETFs and mutual funds are also perfectly acceptable. If you do not have access to these exact ETFs, the idea would be to find ETFs or mutual funds with similar characteristics and/or holdings to trade instead. Your plan/account administrator is one resource to consider using. Another is the “free” sections of
https://www.morningstar.com/. Page 38 of the
2026 Almanac also has additional details.
Positions in bond ETFs, TLT, AGG, and BND are on hold. Their performance this year was mixed when dividends are not considered. SHV and SGOV have offered a fair yield around 4% and a generally stable price during the “Worst Months.” SHV and SGOV are also on Hold.
Disclosure note: Officers of Hirsch Holdings Inc hold positions in DBA, EFAV, EFV, EZU, FXE, FXF, IDV, and XLP in personal accounts.