|
August 2017 Trading & Investment Strategy
|
|
By:
|
July 27, 2017
|
|
|
|
|
Market at a Glance - 7/27/2017
|
|
By:
Christopher Mistal
|
July 27, 2017
|
|
|
|
7/26/2017: Dow 21711.01 | S&P 2477.83 | NASDAQ 6422.75 | Russell 2K 1442.28 | NYSE 11964.91 | Value Line Arith 5645.59
Psychological: Frothy. According to the most recent
Investors Intelligence Advisors Sentiment survey bulls are back above 60%, a level that suggests taking defensive measures. The CBOE Volatility index trading under 10 for eleven trading sessions (as low as 8.84 yesterday) is also concerning. The bullish, long trade is looking quite crowded.
Fundamental: Stalled. Outside of corporate earnings many other data points are flat or slipping. GDP is stuck around 2%, the unemployment rate has settled into a range around 4.5%, auto sales likely declined for the fifth consecutive month in July and existing home sales are probably topping out as prices climb into record territory and supply remains constrained. The Trump Administration has put the brakes on new regulation and rolled back some, but major policy initiatives remain in limbo. At some point stock market valuations could matter again.
Technical: Stretched. New all-time highs for DJIA, S&P 500, NASDAQ and Russell 2000 have stretched Stochastic, MACD and relative strength indicators into or near overbought territory. Today’s intraday reversal by S&P 500 and NASDAQ, plus a greater than 3% decline by the Dow Jones Transportation (DJT) could be early signs that the rally is about to take a breather.
Monetary: 1.00-1.25%. Ahead of the Fed’s July meeting, focus had already shifted from the “next hike” to when the Fed will begin shrinking its balance sheet. They have provided a plan, but not a starting date and we are still waiting. The removal of liquidity from the financial system could have a more immediate impact than a few small rate increases.
Seasonal: Bearish. August is the worst DJIA and S&P 500 month from 1988-2016 with average declines of 1.3% and 1.0% respectively. It is also the worst month for NASDAQ (–0.3%) and second worst for Russell 2000 (–0.7%) over the same time period. Post-election year Julys also rank at or near the bottom with even greater average declines.
|
August Outlook: Typical Strong Post-Election July Points to August-September Break
|
|
By:
Jeffrey A. Hirsch & Christopher Mistal
|
July 27, 2017
|
|
|
|
We are currently experiencing a typically strong post-election July. With VIX low, sentiment high and stocks up, the time is nigh for the August-September slide. In addition we now have a Dow Theory Signal as the Dow Transports have just fallen rather sharply, down 5.7% in the past two weeks including a 3.1% drop today. All this weakness in the Transports has occurred while the Dow Industrials continues to log multiple new highs this month.
This lack of confirmation or synergy between the two oldest U.S. market benchmarks just triggered a Dow Theory Sell Signal. When the backbone of our economy that transports goods across the nation does not perform well it is an indication that there is underlying economic woe. It is not always right and like everything else it is subject to interpretation, but it does have a solid track record and is worth heeding here as our other indicators are pointing to a summer selloff around the corner.
They say “one man’s loss is another man’s gain,” and this DJT downturn is a boon for our seasonal short trade in iShares DJ Transports (IYT), trimming our 10% loss in the position by two thirds to 3.5%. In the face of all this overvaluation, frothy sentiment and the upcoming seasonal weakness we usually get in August and September, we are pleased to already be in a rather defensive risk off position.
Sentiment as measured by the trusty
Investors Intelligence Bullish and Bearish Advisors % continues to move evermore bullish to over 60% bulls and down to under 17% bears with an expanding spread between bulls and bears to near-peak levels of 43.7%. These are the levels associated with market corrections. At the same time volatility remains super low, but ticking up from historic lows under 9 intraday. If volatility begins to pick up and sentiment retreats look for the market to turn lower.
Concurrently, 2017 continues to track the 1-year seasonal pattern of Positive January Indicator Trifecta (Years when our 3 January indicators, January Barometer, First Five Days and Santa Claus Rally are all up) and Post-Election Years. As you can see in the updated chart below this suggests further upside this year, but not before a pause or more serious pullback during the August through October timeframe.
The beginning of August is notoriously weak as investors, traders and money managers take off en masse on vacations. This is followed by a
mid-month surge then a weak close, September trouble and the feared syndrome called Octoberphobia. So keep your powder dry, sit tight and take some risk off before the summer market swoon.
Pulse of the Market
This July has lived up to its reputation as a solid performer in post-election years. DJIA, S&P 500, NASDAQ and Russell 2000 have all logged new all-time highs this month. DJIA (1) is closing in on 22,000, S&P 500 was climbing towards 2500 and NASDAQ was over 6400 until today. DJIA was lagging earlier in the month and is catching up now. The shift in DJIA’s momentum is being confirmed by both its faster and slower MACD indicators turning positive (2) yesterday, but this is a tepid confirmation occurring above the zero line.
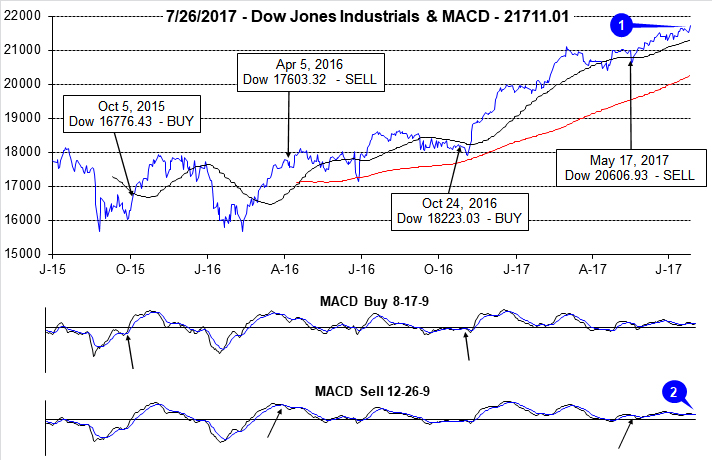
DJIA (3) and S&P 500 (5) have both recorded weekly gains in seven of the last nine weeks and are on course for an eighth gain this week. During this streak of weekly strength, traders and investors have not shied away from buying on Fridays. DJIA has been up six of the last nine Fridays (4). But, there is been little follow through on subsequent Mondays with DJIA down modestly six of the last nine. This week’s DJIA Down Friday/Down Monday is the first in seven weeks and has been ignored thus far. Historically, sometime during the 90 calendar days after a Down Friday/Down Monday occurrence, DJIA has registered a meaningful decline.
After a tough finish to the second quarter, NASDAQ has come roaring back (6) with three straight weekly gains. Prior to today’s intraday reversal, NASDAQ was on track for a fourth consecutive weekly gain this week. NASDAQ’s Midyear Rally got off to a late start, but finished well with a 2.6% weekly gain.
NYSE Weekly Advancers and Decliners (7) continue to be a mixed bag. For the week ending June 30, DJIA, S&P 500 and NASDAQ were all down, but Weekly Advancers still outnumbered Weekly Decliners and then one week later the exact opposite occurred. However, Weekly Advancers and Decliners have been responding in a more typical manner the past two weeks. A return to mixed readings or an outright reversal in the positive trend could be a sign that weakness is just around the corner.
NYSE Weekly New Highs (8) appear to have turned a corner as well and have been increasing for the past two weeks. Weekly New Lows have also been declining which is also positive. If these trends persist, then the recent breakout rally has a good chance of continuing. But if they begin to revert back to mixed levels then the breakout will likely fail.
The spread between the 90-day Treasury Rate and the 30-Year Treasury Rate (9) continues to shrink as the Fed increases short-term rates and inflation and growth expectations over the long-term remain tepid. At some point, this flattening could become an issue for the Fed and the market.
|
August Almanac: Weak Early and Late, Brief Strength Mid-Month
|
|
By:
Christopher Mistal & Jeffrey A. Hirsch
|
July 27, 2017
|
|
|
|
Money flows from harvesting made August a great stock market month in the first half of the Twentieth Century. It was the best month from 1901 to 1951. In 1900, 37.5% of the population was farming. Now that less than 2% farm, August is amongst the worst months of the year. It is the worst DJIA and S&P 500 month from 1988-2016 with average declines of 1.3% and 1.0% respectively. August is also the worst month for NASDAQ (–0.3%), Russell 1000 (–0.9%) and Russell 2000 (–0.7%) over the same time period. In post-election years since 1953, Augusts’ rankings are little changed: #12 DJIA, #11 S&P 500, #11 NASDAQ (since 1973), #11 Russell 1000 and #10 Russell 2000 (since 1981).
![[August Post-Election Year Stat Table]](/UploadedImage/AIN_0817_20170727_August_PE_Stats.jpg)
Contributing to this poor performance since 1987; the shortest bear market in history (45 days) caused by turmoil in Russia, the Asian currency crisis and the Long-Term Capital Management hedge fund debacle ending August 31, 1998 with the DJIA shedding 6.4% that day. DJIA dropped a record 1344.22 points for the month, off 15.1%—which is the second worst monthly percentage DJIA loss since 1950. Saddam Hussein triggered a 10.0% slide in August 1990. The best DJIA gains occurred in 1982 (11.5%) and 1984 (9.8%) as bear markets ended. Sizeable losses in 2010, 2011, 2013 and 2015 of over 4% on DJIA have widened Augusts’ average decline. A strong August in 2014 of S&P 3.8% and NASDAQ 4.8% preceded corrections of 7.4% and 8.4% respectively from mid-September to mid-October.
The first nine trading days of the month have exhibited weakness while mid-month is strongest. Note the bullish cluster from August 15-17. The end of August tends to get whacked as traders evacuate Wall Street for the summer finale. The last five days have suffered in 13 of the last 21 years with the S&P 500 up only five times on the next to last day in the past 21 years. In the last 21 years, the last five days of August have averaged losses of: Dow Jones Industrials, –1.0%; S&P 500, –0.9%; NASDAQ, –0.6% and Russell 2000, –0.02%.
On Monday of expiration the Dow has been up 15 of the last 22 times with four up more than 1%, while on expiration Friday it has been down six of the last seven years (–3.1% in 2015). Expiration week as a whole is down slightly more than half the time since 1990, but some of the losses have been steep (-2.6% in 1990, -2.3% in 1992, -4.1% in 1997, -4.0% in 2011, 2.2% in 2013 and 5.8% in 2015). The week after expiration is mildly stronger up 16 of the last 27.
| August Vital Stats (1950-2016) |
| |
DJI |
SP500 |
NASDAQ |
Russell
1K |
Russell 2K |
| Rank |
|
10 |
|
11 |
|
11 |
|
10 |
|
9 |
| #
Up |
|
37 |
|
36 |
|
25 |
|
23 |
|
22 |
| #
Down |
|
30 |
|
31 |
|
21 |
|
15 |
|
16 |
| Average
% |
|
-0.2 |
|
-0.1 |
|
0.1 |
|
0.2 |
|
0.2 |
| 4-Year Presidential Election Cycle Performance
by % |
| Post-Election |
|
-1.8 |
|
-1.5 |
|
-1.5 |
|
-1.5 |
|
-0.7 |
| Mid-Term |
|
-0.7 |
|
-0.4 |
|
-1.8 |
|
-0.1 |
|
-1.9 |
| Pre-Election |
|
0.9 |
|
0.5 |
|
0.7 |
|
0.3 |
|
-0.0001 |
| Election |
|
0.7 |
|
0.9 |
|
2.7 |
|
2.0 |
|
3.3 |
| Best & Worst August by % |
| Best |
1982 |
11.5 |
1982 |
11.6 |
2000 |
11.7 |
1982 |
11.3 |
1984 |
11.5 |
| Worst |
1998 |
-15.1 |
1998 |
-14.6 |
1998 |
-19.9 |
1998 |
-15.1 |
1998 |
-19.5 |
| August Weeks by % |
| Best |
8/20/82 |
10.3 |
8/20/82 |
8.8 |
8/3/84 |
7.4 |
8/20/82 |
8.5 |
8/3/84 |
7.0 |
| Worst |
8/23/74 |
-6.1 |
8/5/11 |
-7.2 |
8/28/98 |
-8.8 |
8/5/11 |
-7.7 |
8/5/11 |
-10.3 |
| August Days by % |
| Best |
8/17/82 |
4.9 |
8/17/82 |
4.8 |
8/9/11 |
5.3 |
8/9/11 |
5.0 |
8/9/11 |
6.9 |
| Worst |
8/31/98 |
-6.4 |
8/31/98 |
-6.8 |
8/31/98 |
-8.6 |
8/8/11 |
-6.9 |
8/8/11 |
-8.9 |
| First Trading Day of Expiration Week: 1990-2016 |
| #Up-#Down |
|
18-9 |
|
21-6 |
|
23-4 |
|
22-5 |
|
20-7 |
| Streak |
|
U3 |
|
U3 |
|
U7 |
|
U3 |
|
U4 |
| Avg
% |
|
0.3 |
|
0.4 |
|
0.5 |
|
0.3 |
|
0.4 |
| Options Expiration Day: 1990-2016 |
| #Up-#Down |
|
11-16 |
|
12-15 |
|
13-14 |
|
13-14 |
|
13-14 |
| Streak |
|
D4 |
|
D4 |
|
D2 |
|
D2 |
|
D4 |
| Avg
% |
|
-0.3 |
|
-0.3 |
|
-0.3 |
|
-0.2 |
|
0.01 |
| Options Expiration Week: 1990-2016 |
| #Up-#Down |
|
12-15 |
|
15-12 |
|
17-10 |
|
15-12 |
|
18-9 |
| Streak |
|
D2 |
|
D2 |
|
U1 |
|
D2 |
|
U1 |
| Avg
% |
|
-0.5 |
|
-0.1 |
|
0.3 |
|
-0.1 |
|
0.4 |
| Week After Options Expiration: 1990-2016 |
| #Up-#Down |
|
16-11 |
|
18-9 |
|
17-10 |
|
18-9 |
|
18-9 |
| Streak |
|
D1 |
|
D1 |
|
D1 |
|
D1 |
|
U4 |
| Avg
% |
|
0.4 |
|
0.4 |
|
0.7 |
|
0.4 |
|
0.07 |
| August 2017 Bullish Days: Data 1996-2016 |
| |
14,
17, 29 |
15-17,
22, 29 |
14-17,
22, 29 |
15-17,
22, 29 |
14, 16, 17, 22 |
| |
|
|
|
|
25, 29 |
| August 2017 Bearish Days: Data 1996-2016 |
| |
1,
21, 30 |
11,
18, 21, 30 |
7,
8, 18, 21 |
21,
25, 30 |
2, 7, 8, 21 |
| |
|
|
|
|
|
|
August 2017 Strategy Calendar
|
|
By:
Christopher Mistal
|
July 27, 2017
|
|
|
|
|
Mid-Month Update: Five Market Disciplines Point Summer Shakeout
|
|
By:
Jeffrey A. Hirsch
|
July 20, 2017
|
|
|
|
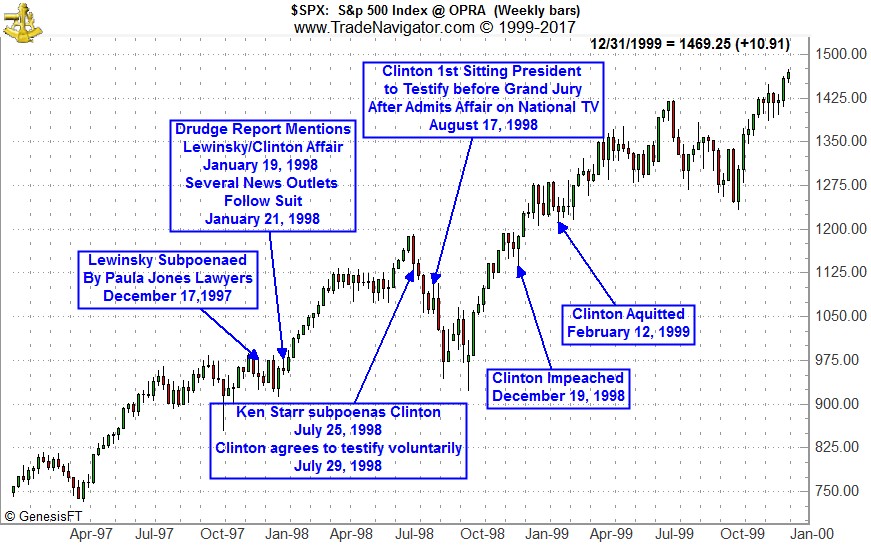
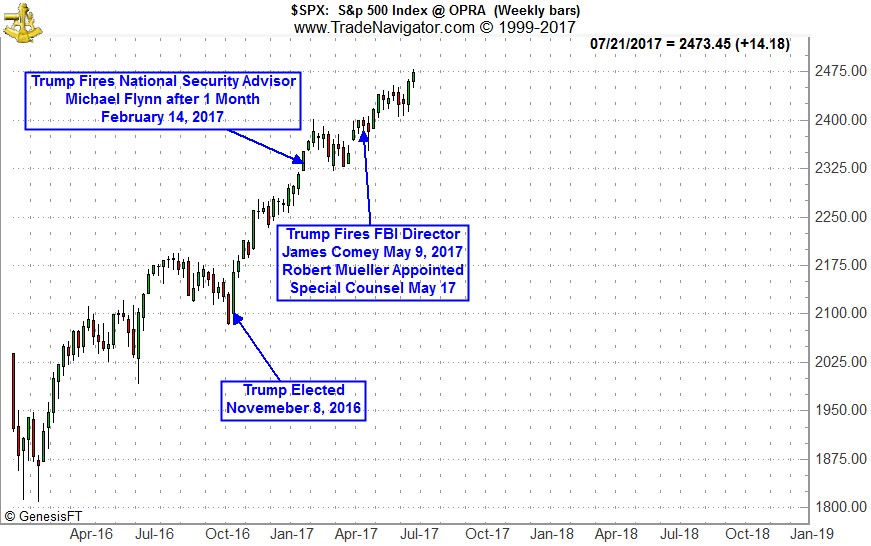
All of the scuttlebutt in DC these days has created a form of gridlock that is keeping any changes at bay and companies and markets like the status quo. But if the situation in the US federal political arena unravels as it did for Bill Clinton in the summer of 1998 with the Lewinsky Scandal and for Richard Nixon in 1973 with the Watergate hearings, the market would likely be at least mildly adversely impacted.
It remains to be seen what will come of special prosecutor Mueller’s investigation if anything at all, but one thing is sure, whatever it is it will take some time to develop. A comparison of the timelines of the Clinton and Nixon scandals versus this Trump Russia probe investigation reveals that at a bare minimum, if anything ever comes of this it will likely not influence the market negatively in a major way for some time to come.
It is even likely to take longer now that Mueller has just expanded the investigation into all of Trump’s business dealings. And it could end up more like Lewinsky/Clinton for the market which was the shortest bear market on record. But if there is a trail of collusion it could be ugly. Only time will tell. But as you can see from the charts below of the Clinton and Nixon scandal timelines it will be the better part of a year before we know.
We are not big bears here. Yes we expect the next 5-10%, or 15% move for the market to be lower. We do not expect this imminent summer slump to be the end of the bull market, but a solid buying opportunity for the next and final leg of the bull market that we expect will end with a bear market that begins in middle of 2018.
Readings from our Five Market Disciplines (Psychological, Fundamental, Technical, Monetary and Seasonal) in our
Market at a Glance point to a correction over the next 2-3 months. While the market has continued to log new all-time highs, which in and of itself is bullish, stocks appear stuck and struggle to make any significant headway higher.
Swirling currents of news, investigations and a stalled legislative agenda in Washington are not poised to help the market power through this upcoming historically weak period from mid-July through October. The market has been on quite a run since the election but now that valuations are a bit rich and sentiment is pretty high the timing is right for the froth to come off and a summer shakeout to begin soon that is likely to give us the first 10% correction since February 2016.
Let’s review all the different seasonal patterns we have been tracking vis-à-vis the current year: Post-Election Years, Seventh Year of Decades, Positive January Trifecta and First Elected Republicans. Take out the Positive January Indicator Trifecta and things look scary over the next four months. That is one of the main reasons we don’t expect a major bear market at this juncture. If not for the market’s positive performance through January and its continued rise to a 10.5% gain for the S&P 500 so far this year, we’d be more concerned. However, all the patterns below suggest some sort of pause.
Overlaying the prospects in the above chart with our understanding of the troublesome and volatile nature of the market from this point in the year through Labor Day, the end-of-Q3, and Octoberphobia; on top of the political maelstrom at home and abroad combined with tepid fundamentals, frothy sentiment and an overbought, cantilevered market, we are ripe for a fall.
More bulls piled on the bandwagon last week as noted by
Investors Intelligence Bullish Advisors %, which jumped from 50.0% to 57.8%. Most of the new bulls came out of the correction camp and the Bearish Advisors % fell slightly to 16.7%, widening the bull-bear spread to an alarming 41.1%. For the record, we are obviously counted in II’s correction camp.
The VIX is below 10% at historically low numbers and everyone is jumping in the pool. As folks head for the beaches and mountains and other vacation destinations and more focus is directed more toward the Mueller investigation, look for stocks to retreat in the near term. Remember the first nine trading days of August are notoriously weak and we’ve had plenty of trouble in August and September over the years, recent years included.
So, if you have not shored up your portfolio for the usual summer storm now is as good a time as any. Check out our
portfolio updates, take some risk off, get rid of your losers, tighten stops, raise some case and put on some prevent defense with our bond positions and perhaps some shorts.
|
Seasonal Sector Trade: S&P 500 Stumbles in Late July
|
|
By:
Christopher Mistal & Jeffrey A. Hirsch
|
July 13, 2017
|
|
|
|
Selling the September S&P 500 futures contract on or about July 17 and holding until on or about July 26 has a 60% success rate registering 21 wins against 14 losses in the last 35 years. The best win was $19,150 in 2002, and the worst loss was in 2009, posting a $12,650 bereavement. This trade had been successful in 13 of 15 years from 1990 to 2004. However since then it has nearly the opposite record, posting losses in 9 of 12 years from 2005-2016.
![[S&P Trade History Table]](/UploadedImage/AIN_0817_20170713_SP_History.jpg)
In these recent years, weakness did materialize however; it was not perfectly aligned with the window defined by this trade. In some years weakness arrived early and was fleeting while in other years it was later and lasted into the early part of August. In 2015 this trade returned and was nearly perfectly aligned with the seasonal trend. This year the setup is compelling as the market is struggling to breakout above resistance at recent all-time highs. Expectations for major reform by the new Republican administration are also in question. Congress is, and has been, bogged down in healthcare overhaul and little else has been done.
![[S&P 500 (SP) Weekly Bars (Pit Plus Electronic Continuous contract) & Seasonal Pattern since 1982]](/UploadedImage/AIN_0817_20170713_SP_Seasonal.jpg)
Looking at the chart above, you will see the average price tendency is for a summer sell-off that usually begins in mid-July and lasts until mid-October (blue arrow). This trade targets the initial part of weakness (shaded yellow). Part of the reason is perhaps due to the fact that July starts the worst four months of the year for NASDAQ and also falls in the middle of the worst six months for DJIA and S&P 500. Mid-July is also when we typically kick off earnings season, where a strong early month rally can fade, as active traders may have “bought the rumor” or bought ahead on anticipation of good earnings expectations and then turn around and “sell the news” once it hits the street.
For the Almanac Investor ETF Portfolio, our top choice to execute a trade based upon this seasonality is ProShares UltraShort S&P 500 (SDS). This trade is not for the faint at heart or those without the desire or ability to routinely monitor as SDS is leveraged two times the daily move of the S&P 500. This relationship can be seen in the following chart comparing SDPR S&P 500 (SPY) (daily bars) to SDS (solid black line). We will add SDS to the ETF Portfolio if SPY breaks down below its projected monthly pivot point (blue dashed line) at $242.16. Once added to the ETF Portfolio, a 3.5% trailing stop loss, based upon daily closing prices of SDS, is suggested.
|
Stock Portfolio Updates: Adding Short Positions
|
|
By:
Christopher Mistal
|
July 13, 2017
|
|
|
|
Over the past month since last update, S&P 500 climbed 0.6% higher while Russell 2000 was up 0.4% as of yesterday’s close. The Almanac Investor Stock Portfolio’s blend of cash and long positions was not as strong, up 0.2% over the same time period excluding dividends and any trading costs. Our Large-Cap portfolio performed best, up 1.7% while Mid-Caps climbed 1.2%. Small-Caps edged 0.4% lower.
Small-cap performance was held in check by Rocky Mountain Chocolate Factory (RMCF). Last updates 4.9% was completely surrendered and RMCF is now showing a minor 0.1% loss. The Hershey Company (HSY), in the Large-cap section of the portfolio, also experienced a similar decline of slightly greater magnitude; from a 5.2% gain last update to a 2.9% loss at yesterday’s close. Lower cocoa prices were the prime catalyst for purchasing RMCF and HSY and cocoa is once again near levels not seen in years. Even if demand for RMCF and HSY products slips during the hot summer months, lower input costs could still give profits a boost. RMCF and HSY are on Hold.
Scotts Miracle-Gro (SMG) was the highlight of the Mid-cap portfolio, up almost 11% since last update and up 39.4% since addition to the portfolio. As we have said before, SMG’s hydroponic products and its well-established business make it a stock to consider if you are in search of cannabis industry exposure and are not comfortable owning many of the smaller plays in the sector. SMG is on Hold.
Per standard trading guidelines, half of the original position in Arista Networks (ANET) was sold on June 23 when it traded above $162.30. ANET did pullback with technology shares in late June, but it is rebounding and its long-term uptrend is still in place. ANET remains on Hold.
Last month’s
Short Stock Basket trading ideas have been entered into the Stock Portfolio table below. Thus far, six short trade ideas have been added to the Stock Portfolio. Two each from small-, mid-, and large-cap sections have been added to the
Almanac Investor Stock Portfolio. Short trade ideas can quickly be identified in the table below as they are designated with “(S)” following their names.
PDFS, ASND, BPMC, IRWD, MOS and TSLA have been added to the portfolio and are currently on Hold.
All other short positions can still be considered. As a reminder, the higher price listed in the “Presented Price” column is resistance and the lower price listed in “Current Advice” is support. Short positions can be executed at resistance or on a breakdown through support with corresponding negative technical indicators as confirmation.
All other positions, not mentioned above, are currently on Hold. Please refer to the updated portfolio table below for Current Advice about each specific position. Please note that some stop losses have been updated. Although July is one of the “Worst Four Months” of the year, weakness typically does not begin
until after the middle of July.
Disclosure Note: At press time, officers of the Hirsch Organization, or accounts they control held positions in, ANET, BUSE, CCS, HSY, MHO, RMCF and SMG.
|
ETF Portfolio Updates & A Change of Pace
|
|
By:
Christopher Mistal & Jeffrey A. Hirsch
|
July 06, 2017
|
|
|
|
First of all we want to thank you all for entrusting us with your time and money, and for your loyal support. We hope our service has been helpful and profitable for you. We know change can be tough on folks, but we believe the changes we are making to our Almanac Investor digital newsletter service are for the better and will prove to be wise moves in the future.
Since we launched Almanac Investor newsletter in July 2001, the market, the world and our service has been through a great deal. We have continued to improve and hone our market timing, sector rotation and stock selection processes and systems into a well-oiled highly, effective-machine. Our results speak for themselves.
The world changed rather dramatically shortly after we launched in July 2001. Less than three months later we suffered the attack of 9/11. Then, six and half years later in March 2008, the bottom fell out triggering the Great Recession and the worst bear market since The Depression. Along the way we made some pretty solid calls and provided reliable guidance.
Here’s a few of the big market calls:
October 16, 2002 Almanac Investor headline “BUY! BUY! BUY!”
2008 Almanac Investor headlines: January 16 “Long-Hibernating Bear Awakes in Bull’s Season, Steepest Correction Since 2003, Looming Recession, Negative Early Readings Portend More Carnage;” February 13 “Negative January Barometer Points to Further Declines, Don’t Get Snared By the Bear Market Rally;” December 12 “Bottom May Be In and a New Bull Market Underway…”
Next Super Boom – Dow 38820 By 2025 forecast, first revealed at Dow 10,783 May 13, 2010 in Almanac Investor.
Over the past 50 years of Stock Trader’s Almanac and several previous newsletters and the past sixteen years of Almanac Investor we have made a plethora of changes to our newsletter services. The time has come to make some adjustments to your subscription service. You will still receive all of the same timely and trenchant market analysis and trade ideas, and more.
In this age of information overload we are refocusing on quality versus quantity. These days our inboxes are inundated with junk and spam and a constant barrage of requests, offers, updates and unnecessary information we are required to sift through. This is why we have decided to bombard you with less email.
Instead of two brief alerts per week, we will be sending you one thorough weekly update and a comprehensive monthly newsletter that covers everything for the month ahead in the Almanac, on our seasonal sector rotation calendar, our best months switching strategy, our market outlook and a review of all the holdings in our stock and ETF portfolios as well as any new recommendations.
Weekly updates will focus on what is on the market’s docket in the week ahead, stock and ETF updates, more Proving Grounds and new stock and sector investing and trading opportunities. We will continue to send interim Alerts on our Best Months Seasonal MACD Buy and Sell Signals as well as any pressing portfolio trades and adjustments that come up.
This effort will allow us to provide you with more videos, webinars and interactive online subscriber events. From now on you will receive one, regularly scheduled email Alert every Thursday except on the last Thursday of every month when we will publish and email you our new more comprehensive newsletter.
We apologize if this change causes any of you any inconvenience so please send us your
feedback and let us know what else you’d like to see us do differently.
New Trade Ideas for August Seasonalities
Biotechnology sector enters its historical favorable season in August. iShares NASDAQ Biotech (IBB) could be bought on dips below $277.00. The stop loss is $249.30 and auto sell is $349.49. A 14.7% average gain has occurred over the last 15 years while an average gain of 22.2% has taken place the most recent 5 years. Biotech had been hot in recent years and even though valuations are still arguably elevated, this is where growth can still be found. It is also quite likely that this sector will play a significant part in the next secular bull market. Unlike other areas of the market, IBB spent the majority of the year plodding along until a mid-June pop.
![[iShares NASDAQ Biotech (IBB) Daily Bar Chart]](/UploadedImage/AIN_0817_20170706_IBB.jpg)
Over the last 15 years, High-Tech has generated an average return of 11.9%, and for the last five years the average has been 9.1% during its bullish season from mid-August to mid-January. Our top ETF within this sector is iShares DJ US Tech (IYW). A buy limit of $124.50 and stop loss of $112.05 are appropriate. If high-tech produces above average gains, profits will be taken at the auto sell of $153.25. IYW had been soaring ever higher since breaking out late last year until mid-June. It has since broken down below its 50-day moving average and appears to be making a beeline towards its much lower 200-day moving average just below $129.
Buy limits for IBB and IYW are well-below current prices. We want to be patient and not rush into new long-positions. Seasonal strength for these two sectors generally does not start until August and both appear poised for further losses in the short term. It will most likely not be a straight line lower, but rather a choppy trend down.
ETF Portfolio Updates
Per our
Seasonal MACD Sell Signal Alert for NASDAQ emailed after the close on June 9, remaining technology and small-cap related positions were closed out using their respective prices on June 12. IYW, IWM and QQQ were all sold for gains of better than 16% (excluding any dividends or fees). XLK was closed out for a 15.3% gain, the smallest of the group.
CurrencyShares British Pound (FXB) was also closed out on June 12 after it closed below its stop of $124.50 on June 9 for a 4.0% gain over three months.
Defensive positions in iShares 20+ Year Bond (TLT), iShares Core US Aggregate Bond (AGG), iShares Silver (SLV) and SPDR Gold (GLD) were also expanded in the time since issuing our NASDAQ Sell Signal as all four traded below their respective buy limits. SLV’s “Presented” Price has been adjusted to reflect the additional purchases. TLT, AGG, SLV and GLD can all still be considered on dips or at current levels (see table below for updated buy limits).
iPath Bloomberg Livestock (COW) and PowerShares DB Agriculture (DBA) have also been added to the portfolio. DBA is slightly higher while COW is slightly lower. Both are on hold.
NASDAQ’s Midyear Rally is off to a bumpy start. In that Alert there were two possible entry points presented, the first was on dips below $135.95 and the second was on a buy signal from MACD (8,17,9). A MACD buy signal occurred on Friday June 23 and
PowerShares QQQ (QQQ) was added to the ETF Portfolio on Monday June 26 using its average price of $141.32. Appling the suggested 2% trailing stop loss to this entry price resulted in the position in QQQ being stopped out on June 27 when QQQ closed below $138.49. Because the MACD buy criteria were satisfied, the portfolio will officially recognize the 2% loss.
If you did not use the MACD Buy Indicator as the entry point and instead choose the price of $135.95 (QQQ traded below today) or entered near the close on June 27 then a stop loss of $134.76 is suggested. QQQ is rather oversold now and it could easily turn around and rally into mid-month.
Disclosure Note: At press time, officers of the Hirsch Organization, or accounts they control held positions in AGG, COW, DBA, GLD, SLV, TLT, XLP and XLV.