|
2021 Forecast: Yearend Rally Continues, Seasonal Patterns Endure and 2021 Looks Like A Good Year
|
|
By:
Jeffrey A. Hirsch & Christopher Mistal
|
December 17, 2020
|
|
|
|
Global pandemic was certainly not in our forecast last year and neither was the economic shutdown that came with it. Covid-19 has dramatically changed the world, the economy and the market forever. Some industries are still struggling, while others have adapted and changed. The “stay-at-home” economy stocks, technology in general and biotech industries are having a major impact that is keeping the economy humming along and the market rallying to new highs.
Our outlook is bullish for next year. Covid cases, deaths and hospitalizations are elevated and on the rise, but vaccines are rolling out and much of the economy has learned how to adjust and deal with the restrictions and new socially distant mores. Our big concern is the struggling industries and their workers that are not finding new jobs.
The travel, leisure, hospitality, restaurant and similar service industries are in dire straits. Vast numbers of restaurants and small businesses have closed or gone out of business due to Covid and the level of Jobless Claims and the recent uptick are emblematic of the economy’s struggles.
The chart below tells quite a dramatic story. Using the most excellent St. Louis Fed’s FRED database we have charted Initial Weekly Jobless Claims along with the Wilshire 5000 overlaid with the NBER (National Bureau of Economic Research) recession bars. The spike in Claims to nearly 7 million on the right side of the chart when the world shut down in March is astonishing and miles above any previous high. Claims have come down but are still at pre-Covid record levels. And this week’s uptick is concerning. We will need to see major improvement on the jobs front for our Best Case scenario for 2021 to pan out.
![[Jobless Claims Chart]](/UploadedImage/AIN_0121_20201217_Claims.JPG)
Next year is also a post-election year with a new president from a new party. Historically, post-election years have not been great for the market as presidents, new or reelected, make changes early in the term and try to push through the their most disruptive policy initiatives. But post-election years have improved in recent years. Perhaps recent election-year weakness, which can be attributed to more contentious, campaigning of late, has benefitted post-election years.
Control of Congress also hangs in the balance with the outcome of the Georgia Senate runoff on January 5, 2021. If the republicans win they secure control of the Senate, making it harder for President-elect Joe Biden to get through legislation. If the democrats win both seats in Georgia with the two independents that caucus with democrats it will be 50/50 in the Senate making it easier for Biden to implement more new policy and break the gridlock that often limits sweeping change.
Post-election years after an incumbent party loses the White House have been rather weak, up only 2.3% on average for the S&P 500 since 1949. This is represented in the red line in the chart below of the S&P 500 One-Year Seasonal Pattern Since 1949. This chart also shows the historical seasonal patterns for all years since 1949 and since 1988 as well as all post-election years and the 1st Year of a new democratic president.
Admittedly, there are limited data points for first year democrats with only four. But change in party with a new, first year democratic president came with democratic control of Congress and significantly higher performance for the S&P 500, averaging 10.6% with a median gain of 15.1%. 1977, Jimmy Carter’s first year, was the only negative one down -11.5%. S&P 500 was up 23.1% in 1961, Kennedy’s first year; 7.1% in 1993, Clinton’s first year and 23.5% in 2009, Obama’s first year.
Four Horseman of the Economy
The Dow is our lead horsemen and it along with the rest of the stock market has been logging new highs and tracking seasonal patterns since September. We expect this trend to continue unless the Covid pandemic spirals out of control, the vaccines prove ineffective and/or earnings outlooks deteriorate.
Consumer confidence is still rather glum as folks struggle to navigate and survive the economic disruptions from the pandemic and related restrictions. Travel and leisure struggles reflect this lack of confidence. The Fed can’t get much easier so a retreat in the spread of Covid, vaccine success, a new stimulus package and some light at the end of the tunnel that there will be a resumption of a more normal economy will do much to improve consumers’ outlook.
The Unemployment Rate is still elevated and likely to remain so as jobless claims are still historically high and on the rise. Some vision of a full economic reopening, where folks can get back to work in the hospitality business, travel and freely go out will help companies start to rehire. But it will likely be some time before workers whose businesses closed find new jobs or new fields.
Our inflation horseman as measured by our 6-month exponential moving average calculations on the CPI and PPI have been in retreat since before Covid and the PPI has gone deeper negative since last year. Pent up demand once Covid is in check and the economy reopens should help bring inflation out of the doldrums.
Pulse of the Market
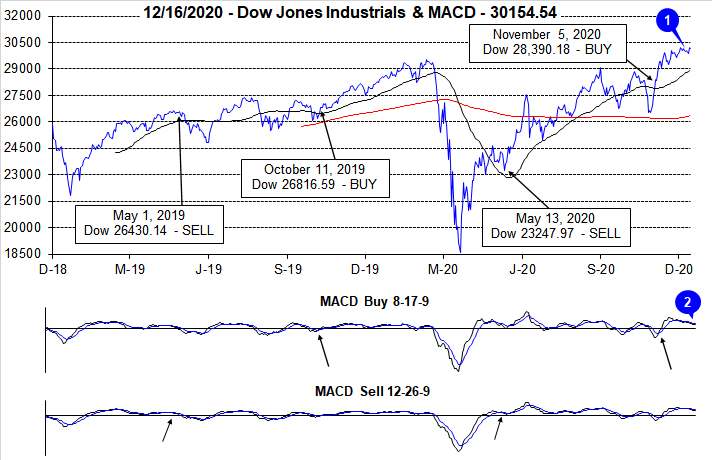
Thus far this December has unfolded in line with
historical seasonal patterns. DJIA started the month with solid gains and a new all-time closing high above 30,000 on the fourth trading day (1). From then through yesterday DJIA was modestly lower to flat. Today, just past the mid-month mark, DJIA made another new all-time high. Today’s broad move could be the beginning of the market’s typical second half of December rally. Both the slower and faster moving MACD indicators (2) are still negative but trending toward a positive “buy” confirmation.
DJIA’s positive Monday streak noted last month came to an abrupt end on the last day of November (3). Monday has been a loser since while Friday has improved. Strength on Fridays has historically been positive as it shows traders are less concerned with headline or breaking news risk over the weekend. Early December strength followed by weakness is evident in the table with a weekly gain to start the month followed by DJIA, S&P 500 (4) and NASDAQ (5) weekly loss. We view the return of seasonal patterns as a welcome and bullish sign.
Market breadth measured by NYSE Weekly Advancers and NYSE Weekly Decliners (6) has remained mostly positive as the market climbed higher into early December with only the mildest amount of weakness last week. Advancers have outnumbered Decliners by a robust margin over five of the last six weeks. This broad participation in the rally is bullish and suggests the rally can persist.
DJIA, S&P 500, NASDAQ and Russell 2000 have broken out to new all-time closing highs at various times over the past three weeks (and today) As a result, Weekly New Highs (7) had expanded to their highest level since February of this year last week. Weekly New Lows have also declined to the lowest levels since June. Expanding New Weekly Highs is a bullish trend. It also suggests that the rally has broad participation and is not due to just a handful of mega-cap stocks carrying cap-weighted indexes higher.
One potential area of concern is the Weekly Put/Call ratio (8). For the week ending December 4, the 0.39 reading is the lowest in our data set going back to May 2001. Combine this with nearly equally low readings the week before and after and it’s clear that this sentiment indicator is clearly stretched to a bullish extreme. The closest comparable period to now was in April 2010. Just a few brief weeks later in 2010, the market suffered a “flash” crash and S&P 500 slipped into a correction. Things are different this time as Covid-19 vaccines are shipping and the economy is still recovering from a deep contraction lending support to bullish sentiment.
Click for larger graphic…
2021 Forecast
- Worst Case – DJIA & S&P 500 up 4-8%. NASDAQ up 6-10% - Covid-19 worsens; earnings outlook slips. Market correction with recovery by year end with modest single digit gains.
- Base Case – DJIA & S&P 500 up 8-12%. NASDAQ up 15-20% - Typical Post-Election year with a new Democrat in the White House.
- Best Case – DJIA & S&P 500 up 15-20%. NASDAQ up 22-27% - Covid-19 vaccine rolls out perfectly, additional fiscal stimulus, leisure, hospitality and travel surges, and unemployment dives.
We will be keeping you fully abreast of all readings from our three January Trifecta Indicators: Santa Claus Rally, First Five Days and the full-month January Barometer and will make adjustments on the close of January 2021. In closing, with DJIA above 30,000 again it sure seems like our Super Boom forecast, first made in May 2010 in this space around DJIA 10,000, for DOW 38,820 by the year 2025 is ahead of schedule. We will publish a more complete update next year.
Happy Holidays & Happy New Year, we wish you all a healthy and prosperous 2021!
|
Market at a Glance - 12/17/2020
|
|
By:
Christopher Mistal
|
December 17, 2020
|
|
|
|
12/17/2020: Dow 30303.37 | S&P 3722.48 | NASDAQ 12764.75 | Russell 2K 1978.05 | NYSE 14516.73 | Value Line Arith 7898.62
Fundamental: Still Mixed. Limited quantities of vaccines are shipping, but it will take time to reach all that desire one. Covid-19 continues to spread and weekly initial jobless claims have started creeping higher. Many areas of the economy have shown improvement however, the lofty number of weekly claims suggests there could be a cap on how far and how long positive trends can continue.
Technical: Breaking out. DJIA, S&P 500 NASDAQ and Russell 2000 all broke out to new all-time closing highs today. Strength across all four indexes is bullish as it shows broad participation and support from stocks. Barring an exogenous event, the typical yearend rally most likely has begun.
Monetary: 0 – 0.25%. During the last Fed meeting of the year this week, the Fed once again confirmed its commitment to doing essentially whatever it takes, within their powers, to support the economy. Low rates, yes, more QE at a pace of $120 billion a month, yes and they stand ready to respond further if new risks emerge. Historically, an accommodative Fed has benefited the stock market and this time looks no different.
Seasonal: Bullish. January is the third month of the Best Six/Eight, but it is the last of the Best-Three-Consecutive-month span. January is the top month for NASDAQ (since 1971) averaging 2.8%, but it has slipped to sixth for DJIA and fifth for S&P 500 since 1950. Post-election-year Januarys have been weaker (DJIA +0.6%, S&P 500 +0.8% NASDAQ +2.3%), but still positive. The Santa Claus Rally ends on January 5th and the First Five Days early-warning system ends on the 8th. Both indicators provide an early indication of what to expect in 2021. We will wait until the official results of the January Barometer on January 29 are in before tweaking our Annual Forecast. Email Alerts will be sent after the close on these dates.
Psychological: Nearly Euphoric. According to
Investor’s Intelligence Advisors Sentiment survey Bullish advisors stand at 63.6%. Correction advisors stand at 19.2% while Bearish advisors are at 17.2%. However, Bullish advisors actually declined fractionally from their previous peak of 64.7% from two weeks earlier. This is a high level, but it is lower than the January 2018 peak of 66.7% Bullish advisors. Bullish sentiment is clearly lofty, but not without reason. It is the holiday season and Covid-19 vaccines are shipping.
|
January Almanac: An Indicator Trifecta Historically Bullish
|
|
By:
Jeffrey A. Hirsch & Christopher Mistal
|
December 22, 2020
|
|
|
|
Publication Note: Today’s Alert will be our last regularly scheduled Alert of 2020. Our next email will be on January 5, 2021. However, if market conditions warrant an interim update, one will be sent. Happy Holidays and Happy New Year!
January has quite a reputation on Wall Street as an influx of cash from yearend bonuses and annual allocations has historically propelled stocks higher. January ranks #1 for NASDAQ (since 1971), but fifth on the S&P 500 and sixth for DJIA since 1950. January is the last month of the best three-month span and holds a full docket of indicators and seasonalities.
DJIA and S&P rankings did slip from 2000 to 2016 as both indices suffered losses in ten of those seventeen Januarys with three in a row, 2008, 2009 and 2010 and then again in 2014 to 2016. January 2009 has the dubious honor of being the worst January on record for DJIA (-8.8%) and S&P 500 (-8.6%) since 1901 and 1931 respectively. The early stages of the Covid-19 pandemic mostly spoiled January in 2020 as DJIA, S&P 500, Russell 1000 and Russell 2000 all suffered declines. Only NASDAQ was positive.
In post-election years, Januarys have been modestly weaker. DJIA and S&P 500 slip to number #7 and #6 respectively but do maintain positive average performance. NASDAQ holds the outright best ranking of the five at 5th place, but the frequency of gains has historically been mixed. DJIA, S&P 500 and NASDAQ have all advanced in seven of the last nine post-election year Januarys. The two down post-election years since 1985 were 2005 and 2009.
On pages 110 and 112 of the Stock Trader’s Almanac 2020 we illustrate that the January Effect, where small caps begin to outperform large caps, actually has started in mid-December. Early signs of the January Effect can be seen when comparing iShares Russell 2000 (IWM) to SPDR S&P 500 (SPY) since December 15. Historically, the majority of small-cap outperformance is normally done by mid-February, but strength can last until mid-May when indices typically reach a seasonal high.
The first indicator to register a reading in January is the Santa Claus Rally. The seven-trading day period will begin on the open on December 24 and ends with the close of trading on January 5. Normally, the S&P 500 posts an average gain of 1.3%. The failure of stocks to rally during this time has tended to precede bear markets or times when stocks could be purchased at lower prices later in the year.
On January 8, our First Five Days “Early Warning” System will be in. In post-presidential election years this indicator has a solid record. In the last 17 post-presidential election years 13 full years followed the direction of the First Five Days. The full-month January Barometer has a slightly better record in post-presidential election years with 14 of the last 17 full years following January’s direction.
Our flagship indicator, the January Barometer created by Yale Hirsch in 1972, simply states that as the S&P goes in January so goes the year. It came into effect in 1934 after the Twentieth Amendment moved the date that new Congresses convene to the first week of January and Presidential inaugurations to January 20.
The long-term record has been stupendous, an 85.7% accuracy rate, with only ten major errors since 1950. Major errors occurred in the secular bear market years of 1966, 1968, 1982, 2001, 2003, 2009, 2010 and 2014 and again in 2016 as a mini bear came to an end. The tenth major and most recent error was in 2018 as a hawkish Fed continued to hike rates even as economic growth slowed and longer-term interest rates fell. The market’s position on the last trading day of January will give us a better read on the year to come. When all three of these indicators are in agreement it has been prudent to heed their call.
| January (1950-2020) |
| |
DJI |
SP500 |
NASDAQ |
Russell 1K |
Russell 2K |
| Rank |
|
5 |
|
5 |
|
1 |
|
4 |
|
4 |
| #
Up |
|
45 |
|
43 |
|
33 |
|
26 |
|
23 |
| #
Down |
|
26 |
|
28 |
|
17 |
|
16 |
|
19 |
| Average
% |
|
1.0 |
|
1.1 |
|
2.8 |
|
1.2 |
|
1.5 |
| 4-Year Presidential Election Cycle Performance
by % |
| Post-Election |
|
0.6 |
|
0.8 |
|
2.3 |
|
1.6 |
|
1.8 |
| Mid-Term |
|
-0.5 |
|
-0.7 |
|
0.01 |
|
-0.6 |
|
-0.6 |
| Pre-Election |
|
3.9 |
|
4.1 |
|
6.8 |
|
3.4 |
|
3.9 |
| Election |
|
-0.1 |
|
0.1 |
|
1.7 |
|
0.1 |
|
0.8 |
| Best & Worst January by % |
| Best |
1976 |
14.4 |
1987 |
13.2 |
1975 |
16.6 |
1987 |
12.7 |
1985 |
13.1 |
| Worst |
2009 |
-8.8 |
2009 |
-8.6 |
2008 |
-9.9 |
2009 |
-8.3 |
2009 |
-11.2 |
| January Weeks by % |
| Best |
1/9/76 |
6.1 |
1/2/09 |
6.8 |
1/12/01 |
9.1 |
1/2/2009 |
6.8 |
1/9/87 |
7.0 |
| Worst |
1/8/16 |
-6.2 |
1/8/16 |
-6.0 |
1/28/00 |
-8.2 |
1/8/16 |
-6.0 |
1/8/16 |
-7.9 |
| January Days by % |
| Best |
1/17/91 |
4.6 |
1/3/01 |
5.0 |
1/3/01 |
14.2 |
1/3/01 |
5.3 |
1/21/09 |
5.3 |
| Worst |
1/8/88 |
-6.9 |
1/8/88 |
-6.8 |
1/2/01 |
-7.2 |
1/8/88 |
-6.1 |
1/20/09 |
-7.0 |
| First Trading Day of Expiration Week: 1990-2020 |
| #Up-#Down |
|
18-13 |
|
14-17 |
|
13-18 |
|
12-19 |
|
12-19 |
| Streak |
|
U1 |
|
U1 |
|
U1 |
|
U1 |
|
U1 |
| Avg
% |
|
-0.02 |
|
-0.05 |
|
-0.05 |
|
-0.07 |
|
-0.16 |
| Options Expiration Day: 1990-2020 |
| #Up-#Down |
|
20-11 |
|
19-12 |
|
18-13 |
|
19-12 |
|
18-13 |
| Streak |
|
U10 |
|
U6 |
|
U6 |
|
U6 |
|
D1 |
| Avg
% |
|
0.07 |
|
0.08 |
|
0.01 |
|
0.08 |
|
0.08 |
| Options Expiration Week: 1990-2020 |
| #Up-#Down |
|
17-14 |
|
13-18 |
|
18-13 |
|
13-18 |
|
17-14 |
| Streak |
|
U3 |
|
U3 |
|
U3 |
|
U3 |
|
U3 |
| Avg
% |
|
-0.05 |
|
-0.02 |
|
0.18 |
|
-0.02 |
|
0.09 |
| Week After Options Expiration: 1990-2020 |
| #Up-#Down |
|
16-15 |
|
18-13 |
|
17-14 |
|
18-13 |
|
22-9 |
| Streak |
|
D1 |
|
D2 |
|
D1 |
|
D2 |
|
U5 |
| Avg
% |
|
-0.25 |
|
-0.10 |
|
0.04 |
|
-0.07 |
|
0.09 |
| January 2021 Bullish Days: Data 2000-2020 |
| |
4,
25, 26 |
6,
11, 12, 19, 25 |
4,
8, 11, 12 |
6,
11, 12, 25 |
11, 12, 19, 26, 29 |
| |
|
|
19,
26 |
|
|
| January 2021 Bearish Days: Data 2000-2020 |
| |
8,
22 |
None |
None |
None |
21, 28 |
| |
|
|
|
|
|
|
January 2021 Strategy Calendar
|
|
By:
Christopher Mistal
|
December 22, 2020
|
|
|
|
|
2020 Free Lunch Stocks Served: Just 3 New Lows Make the Grade
|
|
By:
Jeffrey A. Hirsch & Christopher Mistal
|
December 20, 2020
|
|
|
|
2021 Stock Trader’s Almanac Shipping Update: Shipping was delayed this year due to production delays with the publisher, John Wiley & Sons. Currently the 2021 Almanac is in route to our warehouse and is expected to arrive early next week (on December 21 or 22). As soon as the 2021 Almanac arrives, we will begin shipping to subscribers. We apologize for the delay.
Publication Note: On Tuesday, December 22nd we will deliver to you our last regularly scheduled Alert of 2020 covering the January 2021 Almanac and Strategy Calendar, along with Stock Portfolio Updates. Our next email will be on January 5, 2021 (Santa Claus Rally results). However, if market conditions warrant an interim update, one will be sent. Happy Holidays and Happy New Year!
Our “Free Lunch” strategy is purely a short-term strategy reserved for the nimblest traders. Traders and investors tend to get rid of their losers near yearend for tax loss purposes, often driving these stocks down to bargain levels. Our research has shown that NYSE stocks trading at a new 52-week low on or about December 15 will usually outperform the market by February 15 in the following year. We have found that the most opportune time to compile our list is on the Friday of December quarterly options and index futures expiration – AKA Triple Witching Day.
This strategy takes advantage of several year-end patterns and indicators. First, the stocks selected are usually technically, deeply oversold and poised for a bounce, dead cat or otherwise. Second, all of the stocks are of the small- and mid-cap variety that will benefit from the January Effect which is the tendency for small-caps to outperform large-caps from mid-December through February. Lastly, the strategy spans the usually bullish Santa Claus Rally and the First Five Days of January.
To be included in this year’s list, the stock must have traded at a new 52-week low on Friday, December 18, 2020. To remain on this year’s list, the stock had to still be trading at $1.00 or higher as several online trading platforms place additional restrictions on a trade when shares are below $1.00. Preferred stocks, funds, splits, special high dividends and new issues were eliminated.
This year there were only a handful of new lows before applying long-standing rules even after expanding the selection process to include OTCBB stocks. No stocks from the American Stock Exchange made the cut and only one each from NYSE, NASDAQ and OTCBB did. The three stocks that remain may not be suitable for everyone. Like past year’s we strongly encourage reviewing the stocks and preforming your own additional due diligence.
Our suggested guidelines for trading these Free Lunch stocks is to initiate a position at a price no greater or less than 2% of Friday’s closing price and to implement an 8% trailing stop on a closing basis from your execution prices. If the stock closes below 8% of the execution price or a subsequent high watermark, then the stock would be closed out of the portfolio. If any of these stocks trade in a window between -2% to +2% of Friday’s closing price on Monday, December 21, it will be tracked in the Almanac Investor Stock Portfolios using the trade’s execution price with an 8% trailing stop on closing basis.
If you buy these stocks, please note the following:
1. Consider selling them as soon as you have a significant gain and utilize stop losses.
2. The stocks all behave differently and there is no automatic trigger point to sell at.
3. Standard trading rules from the Almanac Investor Stock & ETF Portfolios do not apply for these stocks.
4. We think you should be out of all of these stocks between the middle of January and the middle of February.
5. Also, be careful not to chase these stocks if they have already run away.
DISCLOSURE NOTE: Officers of the Hirsch Organization do not currently own any of the shares mentioned. However, we may participate in the Free Lunch Strategy.
|
Seasonal Sector Trades: Copper’s Run Likely to Continue
|
|
By:
Christopher Mistal & Jeffrey A. Hirsch
|
December 10, 2020
|
|
|
|
For the most part, this December has unfolded in rather typical seasonal fashion. The market started the month off with solid gains and continued to rally through the fourth trading day before turning somewhat mixed. Russell 2000 and NASDAQ advanced an additional two trading days while DJIA, S&P 500 and Russell 1000 see-sawed essentially sideways until yesterday, the seventh trading day of December.
![[Typical December Seasonal Pattern Chart 1999-2019]](/UploadedImage/AIN_0121_20201210_December_Seasonal.jpg)
Currently the major indexes are navigating the often-dull period that has historically begun around the fourth trading day of the month through the eighth. Afterwards, later this week into early next week, another patch of weakness is possible. Then right around mid-month, the rally that began in at the beginning of November, is likely to resume. The resumption could be bumpy but once quarterly options expiration passes our Santa Claus Rally will begin on the open of trading on December 24. Since 1969, S&P 500 has enjoyed an average gain of 1.3% during the Santa Claus Rally that spans the last five trading days of this year and the first two trading days of next year.
Copper’s Bullish Seasonality
Copper has a tendency to make a major seasonal bottom in November/December and then a tendency to post major seasonal peaks in April or May. This pattern could be due to the buildup of inventories by miners and manufacturers as the construction season begins in late-winter to early-spring. Auto makers are also preparing for the new car model year that often begins in mid- to late-summer. Traders can look to go long a May futures contract on or about December 14 and hold until about February 24. In this trade’s 48-year history, it has worked 31 times for a success rate of 64.6%. After four straight years of declines from 2012 to 2015, this trade was successful three years in a row with increasing theoretical gains. Last year the trade was a bust as Covid-19 emerged in China and eventually spread to be a global pandemic.
Cumulative profit, based upon trading a single futures contract excluding commissions and fees, is a respectable $74,025. Just over one-fourth of that profit came in 2007, as the cyclical boom in the commodity market magnified that year’s seasonal price move. However, this trade has produced other big gains per single contract, such as a $14,475 gain in 2011, and even back in 1973, it registered another substantial $9,475 gain. These numbers show this trade can produce big wins and big losses if not properly managed. A basic trailing stop loss could have mitigated many of the historical losses.
![[Long Copper (May) Trade History Table]](/UploadedImage/AIN_0121_20201210_HG_History.jpg)
In the following chart, the front-month copper futures weekly price moves and seasonal pattern are plotted. Typical seasonal strength in copper is highlighted in yellow in the lower pane of the chart. Last year’s seasonal period was cancelled by Covid-19 triggered shutdowns. But, there is light at the end of the Covid-19 pandemic tunnel now that vaccines are becoming available and copper’s rally since its late-March bottom has accelerated in recent weeks. An accommodative Fed, with near zero rates, and the strong possibility of another Federal stimulus bill are also likely to lift copper prices which in turn could boost the shares of the companies that explore, mine and bring copper to market.
![[Copper (HG) Bars and Seasonal Pattern Chart (Weekly Data December 2019 – December 10, 2020)]](/UploadedImage/AIN_0121_20201210_HG_Seasonal.jpg)
One option to take advantage of copper’s seasonal move is iPath Series B Bloomberg Copper Sub-Index TR ETN (JJC). As a reminder, ETNs differ from ETFs. An ETN is debt whose current value is based upon the returns of the index it was designed to track. In the case of JJC, it is linked to the Bloomberg Copper Sub-Index Total Return, which represents the potential return of an unleveraged investment in one or more relevant futures contracts plus the rate of interest that could be earned on cash invested in specific Treasury bills. JJC trading volume is quite thin, trading just a few thousand shares per day on average. Volume has picked up when copper does move, but we will pass on JJC.
A second option that provides exposure to the copper futures market without having to have a futures trading account, is United States Copper (CPER). This ETF tracks the daily performance of the SummerHaven Dynamic Copper Index Total Return plus interest income from CPER’s holdings less fund expenses. CPER’s daily volume is also on the light side, but it does appear to be more liquid that JJC. Stochastic, relative strength and MACD technical indicators applied to CPER are all positive now, but at or near overbought levels. A position in CPER can be considered on dips below $21.00. If purchased an initial stop loss of $18.50 is suggested. Should CPER not dip below its below limit, CPER could also be considered on a breakout above $22.30 (projected monthly resistance, red dashed line in chart below). This trade will be tracked in the Almanac Investor Sector Rotation ETF Portfolio.
![[United States Copper (CPER) Daily Bar Chart]](/UploadedImage/AIN_0121_20201210_CPER.jpg)
Another way to gain exposure to copper and its seasonally strong period is through the companies that mine and produce copper. Global X Copper Miners ETF (COPX) holds shares of some of the largest copper miners and producers from across the globe. Its top five holdings as of December 9, 2020 are: Vedanta LTD, First Quantum, KGHM Polska Miedz SA, Glencore and Antofagasta. COPX could be considered on dips below $28.00. If purchased, an initial stop loss of $23.75 is suggested. Should COPX not dip below its below limit, COPX could also be considered on a breakout above $29.00 (just above projected monthly resistance, red dashed line in chart below). This trade will also be tracked in the Sector Rotation section of the ETF Portfolio.
|
ETF Trades & Updates: Oil & Gas in Play as Vaccine Rollout Nears
|
|
By:
Christopher Mistal
|
December 03, 2020
|
|
|
|
Tomorrow morning the Bureau of Labor Statistics will release its Employment Situation report for November. Depending upon your preferred source, the consensus estimate is for a gain of approximately 450,000 net new nonfarm jobs. That would be much better than the 307,000 that ADP reported yesterday. Historically, the market has responded favorably to the jobs report released in December. S&P 500, NASDAQ, Russell 1000 and Russell 2000 have all advanced fifteen times in the last twenty years. DJIA’s record has one more loss. Average gains range from a low of 0.36% by DJIA to 0.69% by Russell 2000. Sizable losses in 2018 do drag down historical average performance, but the overall trend spanning the last twenty years remains bullish.
New December Seasonality
Oil companies typically come into favor in mid-December and remain so until late April or early May in the following year (yellow box in chart below). This trade has averaged 5.7%, 5.0%, and –0.5% over the last 15-, 10-, and 5-year periods. Sizable declines in 2017 and this year are depressing average performance and seasonal strength in crude oil has been ending sooner, typically in late April or early May instead of late June or July over the past ten years. This seasonality is not based upon the commodity itself (crude oil or natural gas); rather it is based upon NYSE ARCA Oil & Gas index (XOI). This price-weighted index is composed of major companies that explore for and produce oil and gas.
Crude oil and XOI have been under pressure since January and natural gas has been stuck in a downward trend for years with only the occasional brief rally. More recently, crude oil has been rallying since Pfizer announced the effectiveness of its vaccine on November 9 while natural gas had been rising since late July before weakening in November. The global Covid-19 pandemic has cut demand while supplies remain more than sufficient. Global warming and a new administration that is more favorable towards alternative energy sources are two additional major hurdles that will remain even if wide-scale vaccinations curtail Covid-19. Given current fundamentals, this year’s seasonal rally could also be below average, but pent-up demand could surprise and support an above average seasonal rally.
![[NYSE Arca Oil Index (XOI) Weekly Bars and Seasonal Pattern since 11/9/1984]](/UploadedImage/AIN_0121_20201203_XOI_Seasonal.jpg)
SPDR Energy (XLE) is the top pick to trade this seasonality. A new position in XLE could be established near current levels up to a buy limit of $39.70. Employ a stop loss of $32.03. Take profits at the auto sell of $46.16. Chevron is the top holding in XLE at 23.37%. The remaining top five holdings of XLE are Exxon Mobil, ConocoPhillips, Schlumberger and Phillips 66.
Sector Rotation ETF Portfolio Update
Since issuing our Seasonal MACD Buy signal on the close of November 5, the market and the portfolios, have continued to rally with only the occasional dip along the way. As of yesterday’s close, the portfolio’s average open position gain was 10.6%. In accordance with the
Seasonal Buy Alert, all open positions have been added to the portfolio. Additionally, existing positions were also added to. Due to additional purchases, the Presented Price for XLP, IBB, XBI, IYW and XLV have been adjusted. Purchase Prices, Buy Limits, Stop Losses and Auto Sells (where used) have been updated.
ProShares UltraShort Bloomberg Crude Oil (SCO) was stopped out on November 9. This was the day Pfizer announced initial effectiveness results for their Covid-19 vaccine. The positive news lifted stocks and crude oil. Due to SCO being inverse and leveraged, it gapped right through its stop loss and was closed out for a modest 2.4% loss.
With the exception of SPDR Gold (GLD) and iShares Silver (SLV), all other positions can still be considered on dips below their respective buy limits. There is ample time remaining of the Best Months and individual sector seasonalities for these positions to rise further. GLD and SLV are on Hold as their corresponding sector seasonalities comes to an end in December. Semiconductor and Telecom strength has also traditionally ended in December, but more recently, strength has been lasting longer. Please see table for updated buy limits and stop losses.
Tactical Seasonal Switching Strategy Portfolio Update
Our overall outlook remains bullish for the Best Months. Thus far, despite the occasional setback, this has been the correct view as the average gain in the Tactical Seasonal Switching portfolio is 6.4% since we issued our Seasonal Buy Signal. iShares Russell 2000 (IWM) is the best performing position, up 11.2%. The laggard so far is Invescos QQQ (QQQ), up a still respectable 3.8%. We have noted the rotation from technology stocks back into reopening stocks in previous Alerts and this is well reflected by the varying degrees of gains by just these four ETFs.
Historically the first few trading days of December have been positive followed by some weakness and consolidation as early tax-loss selling pressures the market through around mid-month. Today’s trading may be an early indication that the market could be headed for a bit of a breather. Any weakness between now and mid-December could be used to add to existing positions or to establish new positions as the market historically has rallied to close out December. All positions in the portfolio can be considered on dips below their respective buy limits.
As a reminder, these positions are intended to be held until we issue corresponding Seasonal MACD Sell Signals next year after April 1. As a result, no stop loss is suggested on these positions.