Today’s rally was encouraging with the S&P 500 closing above the big round 4000 number. And the across-the-board gains in the major averages and sectors were also constructive. We remain bullish on the yearend rally and the prospect for continuing gains into 2023, but not without concerns for the headwinds the market faces from inflation, Fed rate hikes, geopolitics and perhaps some fallout from the crypto crumble.
We have entered the most bullish time of the year, the Best Six Months (November-April) and the most bullish time of the 4-Year Cycle, “Sweet Spot” from Q4 midterm year to Q2 pre-election year. We are encouraged by the prototypical midterm election year bear market we have already suffered and what looks like a classic October bottom.
The market is still trying to recover from the technical damage while the economy recovers from some structural damage. So, while we expect further upside in December and next year, we suspect it will come with ups, downs and sideways along the way as it climbs the proverbial Wall of Worry.
Tempered Yearend Gains When S&P Down YTD Thanksgiving
Last year at this time on the Tuesday before Thanksgiving S&P 500 was up 24.9% year-to-date. November 2021 gave back a fractional loss, but December and the Santa Claus Rally delivered solid gains. But then the stuff hit the fan. Inflation became non-transitory, the Fed began tapering asset purchases and telegraphing imminent rate hikes, Russia invaded Ukraine and the
bear came out of hibernation.
This year on the Tuesday before Thanksgiving the market is in an entirely different situation with S&P down -16.0% YTD. The table here shows how the market claws its way back in most years with fewer but sizable losses bringing the averages down. The fact that November 2022 is up so far is supportive for continued upside. What stands out to us in this table is the rather solid performance for the Tuesday before Thanksgiving-Santa Claus Rally trade as well as solid gains for the Santa Claus Rally itself.
If Santa Claus Should Fail to Call…
And that brings us to the rather full seasonal docket for December. It is important to remember that while it is the most bullish time of the year there are weak spots and early December is one of them.
In the updated STA Aggregate Cycle graph, it is encouraging to see the S&P 500 in 2022 (orange line) continue to track the trend of this cycle which is an aggregate since 1946 of all years, midterm years and years ending in “2”. At this juncture we remain on track for a rally into the end of November and the first few days of December before tax-loss selling ramps up, of which there should be plenty this year, driving stocks lower into mid-December.
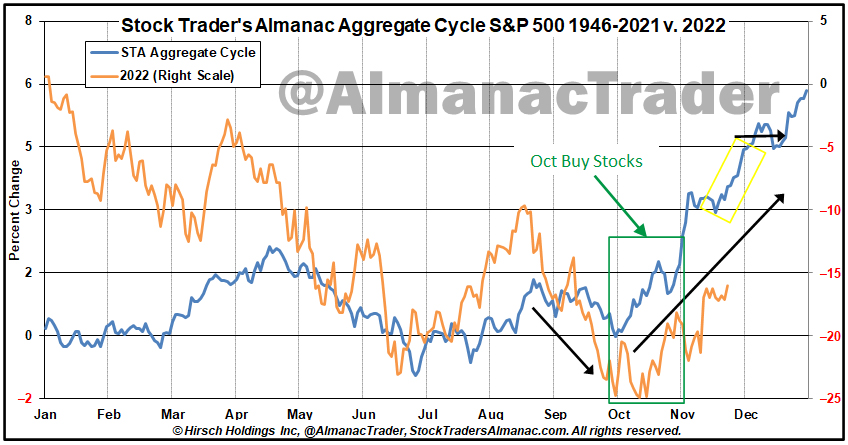
Then the “January Effect” (small caps outperforming large caps in the month of January) kicks in. These days most of the so-called January Effect takes place in the last half of December (2023 Almanac pages 112 & 114). The January Effect is not to be confused with the January Barometer (2023 Almanac page 18), which states as the S&P 500 goes in January, so goes the year. January’s gains in general for all the major averages have been pulled forward into December, but the Russell 2000 takes the lead as you can see in the typical December chart in last week’s
December Almanac.
Just before Chanukah and Christmas we give our “Free Lunch” stock picks from the lists of stocks making new 52-week lows on December Triple-Witching Friday which lands on December 16 this year and present the basket to subscribers over the weekend before the open the following Monday (see 2022 Almanac page 116). This strategy is built to capitalize on the January Effect and the Santa Claus Rally.
The Santa Claus Rally was defined by Yale Hirsch in 1972 as the last five trading days of the year and the first two trading days of the New Year. This short, sweet rally is usually good for about 1.3% on the S&P 500, but the real significance of the SCR is as an indicator.
It is our first seasonal indicator of the year ahead. Years when there was no Santa Claus Rally (SCR) tended to precede bear markets or times when stocks hit significantly lower prices later in the year. We get an even better indication of the New Year when we combine SCR with the First Five Days (FFD) Early Warning System (2023 Almanac page 16) and the full-month January Barometer (JB) reading. We call this the “January Indicator Trifecta.”
When all three are up the S&P 500 has been up 90% of the time, 28 of 31 years, with an average gain of 17.5%. When any of them are down the year’s results are reduced and when all three are down the S&P was down 3 of 8 years with an average loss of -3.6% with bear markets in 1969 (-11.4%), 2000 (-10.1%) and 2008 (-38.5%), flat years in 1956 (2.6%), 1978 (1.1%) and 2005 (3.0%). Down Trifectas were followed by gains in 1982 (14.8%) and 2016 (9.5%). This year SCR was up but the FFD and full month JB were down, and it was a valuable bearish indication for this year.
In the absence of a major systemic event in the market from crypto or somewhere else, or a serious escalation in the Ukraine war, or some extremely hawkish shift from the Fed or an economic surprise, we expect stocks to continue to move higher with some down and sideways moves mixed in as it climbs the Wall of Worry in this nascent bull market. We will want to see more progress in reclaiming the down trend. Having the S&P 500 reclaim its 200-day moving average would be a good start. Then some improvement in market internals.
For now, it appears to us that inflation may have peaked and is trending lower with three consecutive lower readings. According to the Atlanta Fed’s reliable GDPNow Q4 GDP is estimated to be over 4%. And with the Fed Funds Target Rate Upper Limit at 4% and the latest FOMC dot plot upper range at 5% we can surmise the Fed is near the end of the tightening cycle. So, we remain cautiously bullish. Happy Thanksgiving! We are thankful for all of you, our faithful and loyal subscribers.
Pulse of the Market
With five trading days remaining in midterm- year November, DJIA is on track to easily exceed its historical average performance. As of today’s close (11/22), DJIA is up 4.2% compared to 2.5% average in the last 18 midterm Novembers. Bullishly DJIA has spent the majority of this month above its 200-day moving average and the 50-day moving average has turned higher (1). The pace of gains has slowed since the surge higher in October but appears to be picking up once again today. Faster and slower MACD indicators applies to DJIA have turned mixed (2). The slower moving MACD remains positive while the faster moving MACD is modestly negative. Today’s DJIA gain has begun to reverse the faster MACD’s negative reading.
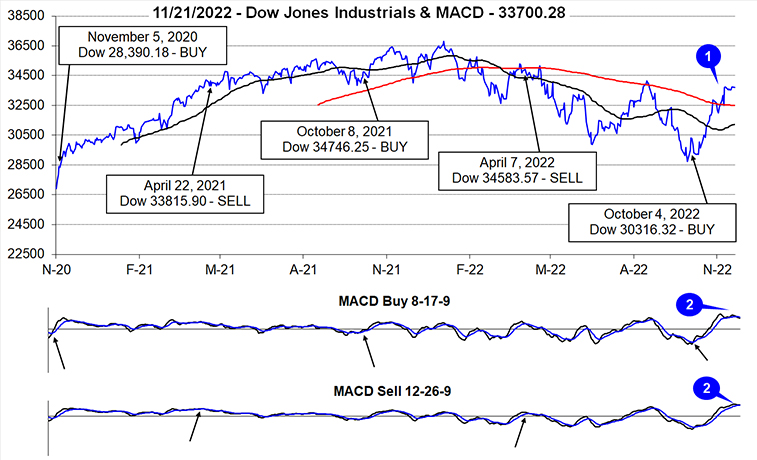
Even though midterm elections have come and gone, volatility has persisted. Despite this, DJIA has been up on Friday for five straight weeks now (3), and three of the gains were over 1%. Prior to the current streak, DJIA declined eight out of nine Fridays. Historically, strength on Fridays (or the last trading day of the week) has been generally bullish as it has tended to coincide with the return of confidence in the market and a corresponding bullish trend.
Last week’s declines by DJIA (3), S&P 500 (4) and NASDAQ (5) were in line with the recent 21-year seasonal trend in November. Provided no significant surprises occur in data or geopolitically between now and the end of the month, the historical trend suggests further gains through the end of the month. Last year, news of the Omicron Covid variant broke and wreaked havoc starting the day after Thanksgiving.
NYSE Weekly Advancers and Weekly Decliners (6) have been consistent with the market’s overall moves. Weekly Decliners easily outnumbered Weekly Advancers during down weeks while the opposite was true in advancing weeks. Bullishly it appears that fewer and fewer stocks are participating in down weeks. Recent down weeks have had far more Advancing issues in November when compared to similar down weeks in September.
Weekly New Highs (7) had been gaining momentum growing in number up until last week when they retreated slightly. New Weekly Lows have continued to decline and on the verge of falling below 100. The last time that happened was during the first week of November 2021. The resumption of expanding New Weekly Highs would be a welcome confirmation.
For the first time since April 2007, the 30-year Treasury bond yield has fallen below the 90-day Treasury yield (8). That was also the last time when the Fed was anyway near its present level with the Fed funds rate. Better than expected CPI and PPI readings this month combined with persistently hawkish comments from Fed members appear to be the main catalyst for the deepening inversion of the Treasury yield curve. It would appear the Treasury bond market believes the Fed has tightened sufficiently already. Whether or not the Fed listens remains up for debate.