Last month we warned you about the market’s propensity to take a
break in February, especially after a run-up like we had and a positive January. February played out rather close to its history as the weak link in the “Best Six Month” and delivered typical choppy market action. S&P 500, NASDAQ and Russell 1000 remain in the red for the month at today’s close while DJIA and Russell 2000 are positive with the small cap benchmark in the lead, up 2.4%.
Seasonal softness, elevated volatility, and lost momentum near the top of the current trading range do not necessarily indicate a structural breakdown. There does not appear to be any major reason for this pullback. This seems like a classic combination of market consolidation, typical midterm election year seasonal weakness and some sector rotation. Beneath the surface, technical support remains intact, seasonal patterns remain aligned with expectations, and economic fundamentals—particularly jobless claims—continue to signal resilience. Today’s initial jobless claims number was lower than estimates and remains historically supportive, even as headlines continue to lean negative.
We’ve covered significant ground off last year’s lows, and it’s natural to see some toppy behavior in leading indexes. Some technicians are noting Hindenburg omens and other cautionary signals floating around. But we’ve heard these false alarms before. Nothing in our observations suggests a major breakdown—rather, a market nearing the ceiling of its recent range and preparing for the next rotation.
Our seasonal charts continue to indicate the potential for additional upside into the end of the Best Six Months, though gains from here are likely to be modest. Notice in the updated S&P 500 Midterm Election Year Seasonal Pattern chart how the market begins to flatten out around the Ides of March (mid-month) in the midterm year. This is a good reminder that we are approaching the window where the market often settles into the classic midterm election year Q2-Q3 weak spot.
Elevated Sentiment Concerns
Our favorite sentiment indicator has now become concerning. The difference between
Investors Intelligence Bullish Advisors % less Bearish Advisors % has been elevated for some time now. The bull-bear spread tracked in the chart below has been above +40 six times in the last seven weeks and it’s the second push above this danger zone level in the past four months. As you can see in the yellow shades it was last at these levels in October/November 2025.
This looks like the pattern we traced out in 2024 ahead of the early 2025 tariff-induced correction. We are not anticipating as severe a correction as the tariff tumble but highlighting that a third push above +40 bulls is likely to lead to a more sustained pullback, which would align well with our seasonal “Worst Six Months” May-October and the Midterm Year Q2-Q3 Weak Spot.
Technical Levels to Watch
Our outlook for the full year remains bullish with our base case scenario of 8-12% annual gains on track. The
positive January Barometer reading has affirmed our bullish stance. And while the January Barometer rules, there are some technical levels we are watching. Number one is the Dow’s December Closing Low indicator (page 36 STA 2026), which we detailed in the
February Outlook. The December Low Indicator is based on the Dow closing below its December Closing Low in the first quarter of the New Year. DJIA’s December closing low was 47289.33 on 12/1/2025. DJIA is currently 2210 points higher than that level today. But it is still a line in the sand to watch.
As you can see from the chart below, this December low level also lines up with support for the S&P 500 in the black line around 6700. Near term support sits at about 6800 as indicated in the short horizontal blue line right at the February 5 low which has encouragingly held so far this month with one day to go. Should we break this 6700-6800 support area the next level of support sits at about 6500 near the October and November lows and the late August/early September consolidation area. Below that is 6200 around the end-of-July/first day-of August four-day correction and the bottom of the early July consolidation. Below that is the 6000 area near the June gap higher, but that is unlikely at this juncture.
![[S&P 500 Technical Chart]](/UploadedImage/AIN_0326_20260226_SPX_TA_Support.jpg)
Sentiment remains elevated, momentum is slowing, and we are increasingly seeing a sideways range develop. This transition is right on seasonal schedule. Any number of catalysts can trigger the soft patch: more AI disruptions, tariff and trade tensions, geopolitical flare-ups, shifting Fed and interest rate expectations and midterm election-year politicking. Whatever the case, the market environment is clearly ripening for some seasonal weakness. After one more push higher to perhaps marginal new highs the market is likely to begin a more sustained pullback and move sideways from mid-March through the end of April. Stick with the data, lean on seasonality, and avoid overreacting to short-term narratives and tune out the negative noise.
Pulse of the Market
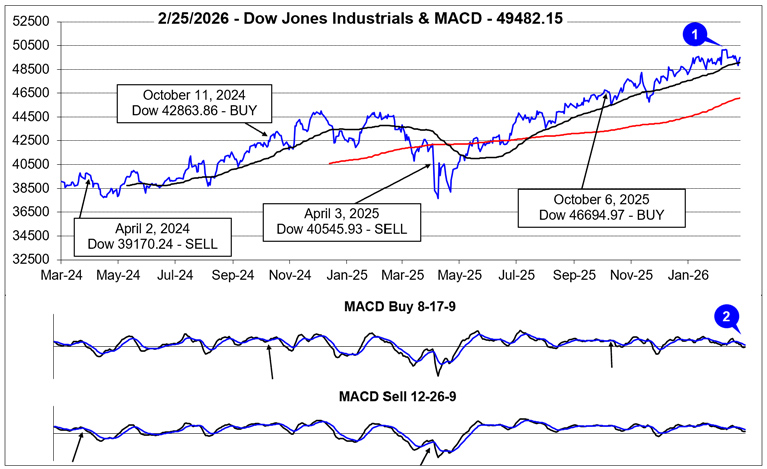
Although it may feel like it has been a painfully long time since everyone was last talking about new all-time closing highs, it will be just three weeks since DJIA first closed above 50,000 on Friday, February 6. DJIA went on to close above this key psychological level three additional days in a row (1) before succumbing to the drag of AI everything concerns. Nonetheless, DJIA has proven its resilience, holding onto a 1.2% February gain. With one trading day left in February it is on the verge of extending its historic monthly winning streak to 10 in a row.
DJIA’s loss of positive momentum around mid-February is confirmed by both the faster and slower moving MACD indicators being negative and trending lower (2) as of the close on February 25. Bullishly, DJIA’s dip below its 50-day moving average was limited with just a single close below and its uptrend from last spring still remains intact.
For all the chop and volatility, the market has been exhibiting, trader and investor sentiment appears to be holding up. Aside from the single Down Friday/Down Monday (DF/DM) occurrence in January and three modest DJIA weekly declines (3) performance on Fridays and Mondays (or first trading day of the week) has not been overly negative. If traders and investors are comfortable enough to hold positions over the weekend and then buy again on Mondays, it would seem expectations for additional gains are still holding up. Should market performance significantly deteriorate on Fridays and/or Mondays, this could be a sign that market expectations are shifting negatively.
Given all the red weekly losses for DJIA (3), S&P 500 (4), and NASDAQ (5) since the start of 2026, it may come as a surprise that only NASDAQ is down year-to-date as of today’s close (February 26). Also of note is NASDAQ’s five week losing streak that ended last week on February 20, was its longest consecutive weekly losing streak since May of 2022 when it was down seven straight and 10 out of 11. Cumulative losses during this year’s weekly losing streak have been relatively mild compared to similar past streaks. This would appear to suggest rotation and repositioning rather than an outright exit.
Market breadth over the last three weeks has been positive with Weekly Advancers outnumbering Weekly Decliners (6) despite S&P 500 and NASDAQ weekly declines in two of the three weeks. This also appears bullish and supportive of a rotation/reposition theme rather than broad-based selling. Technology shares have had an impressive run and some of those profits appear to be moving to other potentially more attractive corners of the market.
Another positive and bullish indication is that the number of new 52-week Highs (7) hit a high of 653 during the week ending February 13. However, new 52-week Lows also briefly expanded before declining in each of the last two weeks. This also appears to support a rotation theme rather than an outright exit. A steady trend higher in the number of new 52-week Highs accompanied by an opposite trajectory for new 52-week Lows would be ideal. Any meaningful deviation from the ideal scenario would warrant additional caution especially as the “Weak Spot” of the 4-Year Presidential Election Cycle draws near (page 46 of STA 2026).
Short-term and long-term Treasury bond yields appear to be settling into a range (8) now that Fed interest rate cuts appear to be on hold for the near-term. Lingering disruptions due to last fall’s Federal government shutdown are also likely weighing on rates as economic data has become increasingly mixed recently. Rate stability combined with relatively low rates has historically benefited the stock market. Any dramatic change in interest rates would likely be disruptive no matter if it was lower or higher.
Click for larger graphic…
Seasonally Speaking!
On March 11 Jeff is joining Fausto Pugliese’s
Cyber Trading University with a host of other top traders for
March’s Cyber Expo Trading Summit for two intensive days of cutting-edge strategies, market analysis, and tools to help you trade. March 11-12 | Live Online – Reserve Your Free Spot Here:
https://cybertradingexpo.com/march-2026-traders-almanac
Then in April he will be presenting at The 2026 MoneyShow Masters Symposium Hollywood Florida which will run from April 9-11 at the exclusive Diplomat Beach Resort. Over three days at the oceanfront venue, you’ll learn about the greatest investing and trading opportunities in 2026 – from dozens of the nation’s leading financial experts.
Here are my two sessions at the Expo on Thursday, April 9, 2026:
Should you Sell in May in the Midterm Election Year 2026?
Stock Panel: The NEW Leaders: A Case for Small Caps, Out-of-Favor Sectors, and “Forgotten” Stocks