|
Market at a Glance - January 29, 2026
|
|
By:
Christopher Mistal
|
January 29, 2026
|
|
|
|
Please take a moment and register for our members’ only webinar, February 2026 Outlook & Update on Wednesday February 4, 2026, at 4:00 PM EDT here:
Please join us for an Almanac Investor Member’s Only discussion of recent market action with time for Q & A at the end. Jeff and Chris will cover their outlook for February 2026, review the Tactical Seasonal Switching Strategy ETF, Sector Rotation ETF, and Stock Portfolio holdings and trades. We will also share assessments of the economy, the Fed, inflation, geopolitical events, gold, silver, copper, energy as well as relevant updates to seasonals now in play.
If you are unable to attend the live event, please still register. Within a day of completion, we will send out an email with links to access the recording and the slides to everyone that registers.
After registering, you will receive a confirmation email containing information about joining the webinar and a reminder message.
Market at a Glance
1/29/2026: Dow 49071.56 | S&P 6969.01 | NASDAQ 23685.12 | Russell 2K 2654.78 | NYSE 22875.46 | Value Line Arith 12764.88
Seasonal: Neutral. February can be a “weak link” in the “Best Months.” Longer-term market performance has been rather tepid in February with average performance ranging from –0.02% from S&P 500 (since 1950) to 1.0% by Russell 2000 (since 1979). In midterm years, February has been better with average gains across the board ranging from 0.3% to 1.3%. S&P 500 performance in February has followed January’s direction 61.8% of the time since 1950, however when S&P 500 was up 2% or more in January, it has consolidated or pulled back in February 66.7% of the time.
Fundamental: Mixed. Government generated economic data has yet to fully recover from the last shutdown as another partial shutdown looms in just days. Nonetheless, available data has generally indicated improvement or at a minimum resilience. Inflation still exists and is running above the Fed’s stated target, but it has been stable enough for the Fed to cut rates. The Atlanta Fed’s GDPNow model’s forecast for Q4 GDP is 4.2% January 29 update. This is down from an impressive 5.4% in its previous update. Even 4.2% would suggest an acceleration of growth. Our favorite labor market indicator, Initial Claims (not seasonally adjusted) is in retreat signaling employment is holding up. Big tech earnings have been mixed but generally remain positive. Corporate guidance is as important as ever.
Technical: Consolidating. DJIA, S&P 500, and Russell 2000 have all closed at new all-time highs this year. NASDAQ has not. All four are above their respective 50- and 200-day moving averages, confirming they are still in uptrends. Until proven otherwise, recent weakness is likely just a healthy pause to consolidate gains since Thanksgiving.
Monetary: 3.50 – 3.75%. The Fed has shifted back into “wait and see” mode putting the future of additional interest rate cuts back in limbo. Big picture, they are in a rate-cutting cycle, which has historically been bullish for the stock market. One action they could consider if they are truly concerned about their independence might be to go back into the background where they operated for decades instead of constantly giving speeches and interviews to anyone at any time. Less “Fed speak” and commentary could actually be better for everyone.
Sentiment: Elevated. According to
Investor’s Intelligence Advisors Sentiment survey Bullish advisors stand at 61.5%. Correction advisors are at 23.1% and Bearish advisors were just 15.4% as of their January 28 release. Bullish advisors have been trending higher since Thanksgiving and have now reached a level where some caution is warranted. Bullish sentiment can and has lingered at elevated levels in the past with continued market gains but eventually something has given. Either the bulls get spooked and retreat and/or the market pulls back. The exact timing and trigger are challenging to pinpoint, hence a cautious stance.
|
February Outlook: A Pause That Refreshes the Bull
|
|
By:
Jeffrey A. Hirsch & Christopher Mistal
|
January 29, 2026
|
|
|
|
We head into February on solid footing. Markets shrugged off a disappointing earnings release and call from Microsoft and rallied off the morning lows with the Dow and Russell 2000 closing in the green, S&P off fractionally and NASDAQ clawing back a good chunk of the early losses. With one day left our January Barometer remains on track for a positive reading, supporting the bullish outlook we laid out in our
annual forecast.
Recent volatility generated mostly by President Trump’s Greenland/EU tariff gambit has raised awareness for “The December Low Indicator” that has been featured in the Stock Trader’s Almanac for years (STA 2026 page 36). Originated by Lucien Hooper, a Forbes columnist and Wall Street analyst back in the 1970s, the December Low Indicator is based on the Dow closing below its December Closing Low in the first quarter of the New Year. DJIA’s December closing low was 47289.33 on 12/1/2025.
Several of our esteemed colleagues, most notably, the venerable Larry McMillan in his excellent Option Strategist newsletter, have expressed concern that if the S&P 500 breaks below its December closing low of 6721.43 on 12/17/2025, it would be a bearish indication. So, we ran the numbers, and lo and behold, what really matters most is our January Barometer, at least statistically.
January Barometer Rules
This December Low Indicator study is based entirely on the S&P 500 data instead of using the Dow as we have in the Almanac based on Hooper’s original work. We used S&P 500 December Closing Low data along with our January Barometer stats. In the table below we have broken out the 35 years since 1950 when S&P 500 closed below its previous December’s closing low into the 27 years that the January Barometer was down and the 8 years it was higher.
Years when the S&P 500’s December Low Indicator was breached and the January Barometer was down, were weaker years, down 14 of the 27 years or 51.8% of the time with an average loss of -3.07%. On the other hand, when January Barometer was up and the December Low was crossed, the years were stronger. While only 50% of these years were up there are only two double-digit losses and the average gain was 4.76%. Additionally, these 8 years experienced smaller corrections of -10.15% from the cross to the low versus -14.49% for the 27 years the January Barometer was down and the December low was crossed.
But when it comes down to it the January Barometer is all that really matters with these New Year indicators. As we pointed out two weeks ago in “
January Barometer 101: Why It Works,” January is the perfect combination of indicative power, early warning and significant time frame. The Santa Claus Rally and First Five Days are early and helpful but short time frames that are more prone to being impacted by exogenous events. The December Low Indicator is useful as well but can come as late as March 31, which is well into the year.
When our S&P 500 January Barometer is positive the full year is up 41 of 46 years or 89.1% of the time for an average gain of 16.95%, the next 11 months are up 87.0% of the time for an average gain of 12.24%. When it’s down, the year is up only 50% of the time with an average loss of -1.75% and the next 11 months are up 60% of the time with a paltry average gain of 2.07%.
February Break
February is the weak link in the “Best Six Months” from November to April (STA 2026 pages 52 and 54) and the market often takes a breather in February. February tends to follow the current trend, though big gains in January often correct or consolidate in the second month of the year as Wall Street reevaluates and adjusts market outlooks based on January performance and earnings season.
When the S&P 500 gains 2% or more in January, February has corrected or consolidated with gains of 1% or less or losses 66.67% of the time. When January is down, February has followed lower 60% of the time and when January is up, February has followed higher 63% of the time.
As we noted in last week’s
February Almanac, February usually starts out strong but fades out in the middle part of the month after Presidents’ Day. Any weakness can be used to establish new long positions or add to existing positions as the market tends to resume its rally toward the end of the month or the beginning of March and continues to run until the end of the Best Six Months in April.
DJIA Historic 9-Month Winning Streak
If DJIA can hold its 2.1% gain for this January with one more trading day left, DJIA’s current monthly winning streak will reach 9 in a row. Since 1901, this would be just the 7th time that DJIA has been positive in nine consecutive months. Reviewing the previous 6 times DJIA was up 9 months in a row, we see performance holding strong 1-month later, with 5 gains and a single loss with an average gain of 3.17%. Two months later, average performance improved even further to +5.34% and frequency of gains climbed to 100%.
However, positive momentum faded by the 3- and 6-month later marks as average performance dripped to +4.83% 3-months after, a modest retreat from the 2-month mark. 6-month performance remains positive, but there were two declines. Historical performance suggests the current “Best Months” are likely to see further upside from current levels followed by some typical Q2-Q3 midterm weakness during the traditionally poorest performing two-quarter span of the 4-year cycle. This “Weak Spot” of the 4-Year Presidential Election cycle is then followed by the “Sweet Spot,” the best 3 consecutive quarter span.
S&P 500 Tracking Bullish 6th Year of Presidency
As you can see from the updated S&P 500 Midterm Election Year Seasonal Pattern chart the market is tracking the bullish base case scenario, we gave a 70% probability to in our 2026 Forecast that was published 7 weeks ago on December 11. Unless the market tanks tomorrow and the January Barometer turns negative, our outlook for 8-12% for 2026 will remain intact.
The president’s political party usually loses House and Senate seats during the midterm elections, driven by the inherent let down from unmet campaign promises. Considering the razor-thin majority the Republicans currently have, the odds of his party losing control of Congress are high. As most two-term presidents do, we expect President Trump to continue to do everything in his power solidify his legacy before the midterm elections. These efforts should keep the country moving on a positive economic trajectory, which is likely to push the market higher.
While there are some troubling events transpiring domestically and geopolitically, if you tune out the noise you can see that the underlying bullish foundation is solid. Economic growth remains resilient. AI spending and productivity gains continue to fuel growth. And the Fed’s interest rate policy remains stable. Inflation appears to be contained enough to not raise rates and the employment situation, which folks were getting worried about, has stabilized enough to justify holding rates steady. Bottom line the market prefers rate stability. So, don’t be alarmed if the market takes a breather in February. Use any weakness to add to longs. The macro backdrop of the AI Super Boom, the 6th year of the presidency, economic and corporate data and market action suggest the trend remains bullish.
Pulse of the Market
Given the hit taken by Microsoft (MSFT) today, DJIA showed resilience today by gaining a modest 0.11%. With a single trading session left in January, DJIA is currently up 2.10% year-to-date and on the verge of extending its monthly winning streak to an impressive nine straight. Although a relatively rare occurrence since 1901, historically DJIA has continued to log solid gains during the following two months of previous nine-month winning streaks.
DJIA’s monthly winning streak lifted it to new all-time closing highs in December and January (1) with the most recent taking place on January 12. DJIA has since surrendered some of its gains but remains less than 2% below its all-time closing high. DJIA’s fading positive momentum is confirmed by both the faster and slower MACD indicators (2). The faster moving MACD turned negative on January 14 and the slower MACD followed suit on January 20. However, it currently appears that DJIA is just consolidating recent gains and barring any external shock it will likely resume climbing higher through the remainder of its “Best Months.”
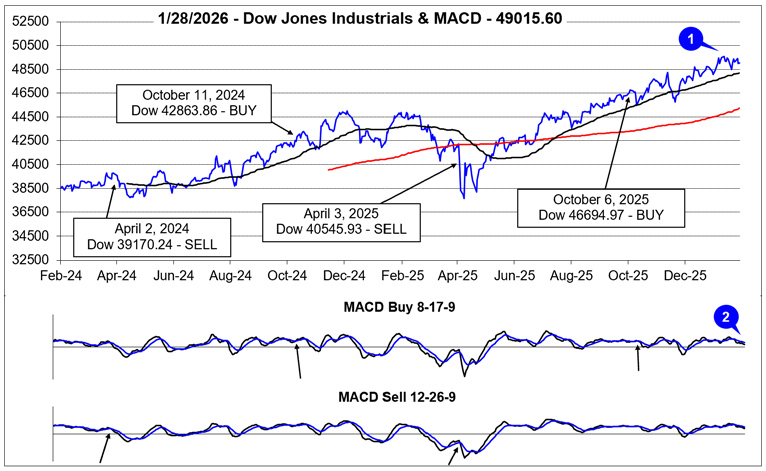
Over the past two months DJIA has logged three Down Friday/Down Monday (DF/DM) occurrences. The most recent was completed on Tuesday after Martin Luther King Jr. holiday closing (3). Despite the three DF/DM’s, DJIA has powered ahead, gaining over 600 points. This appears to suggest a healthy amount of skepticism exists which can support additional upside. DJIA’s “dips” have been bought.
Although DJIA, S&P 500 (4) and NASDAQ (5) have declined in three of the last four weeks, all three are up more than 1.8% this month as of the January 29 close. For our January Barometer, which is based upon the S&P 500, this is a welcome, encouraging sign, especially with just a single trading day remaining in January. We plan to send an email Issue after the close on January 30 with the January Barometer’s final result.
Market breadth has remained somewhat choppy over the past two months but generally positive and consistent with the overall market direction. For the week ending January 16, Weekly Advancers did solidly outnumber Weekly Decliners (6) even as the major indexes dipped slightly. That week stands out as proof that the broader market was/is participating in the rally. The rising tide has been lifting more “ships,” most notably small caps.
Another positive and bullish indication is the number of new 52-week Highs (6) hit a high of 481 during the week ending January 16. This is the greatest number of new weekly highs since November 2024. It is also a sign that the market’s rally is broadening. Weekly Highs did ease modestly last week but Weekly Lows remained subdued below 100. We would anticipate more Weekly Highs once the market’s rally resumes.
Compared to mid-December levels, short-term and long-term Treasury bond yields have moved modestly higher (8). However, the “Sell America” trade does not appear to be substantiated by the magnitude of the move or its orderly movement. Compared to levels from one year ago, the 90-day Treasury interest rate is 0.63 points lower (3.59% now versus 4.22%), and the 30-year Treasury bond interest rate is just 0.02 points higher (4.86% now versus 4.84%). The Fed cutting its lending rate is responsible for the decline in the 90-day Treasury rate while firming economic growth expectations are more likely responsible for the tiny increase in the 30-year rate than foreign Treasury bond holders selling.
|
February Almanac: Performance Better in Midterm Years
|
|
By:
Jeffrey A. Hirsch & Christopher Mistal
|
January 22, 2026
|
|
|
|
February is in the middle of the Best Six Months, but its long-term track record, since 1950, is not all that impressive. February ranks no better than sixth and has recorded meager average performance except for Russell 2000. Small cap stocks, benefiting from “January Effect” carry over in some years; historically tend to outpace large cap stocks in February. The Russell 2000 index of small cap stocks turns in an average gain of 1.0% in February since 1979, the sixth best month for that benchmark. Russell 2000 has had a banner January this year handily outpacing the other major indexes and appears to be benefiting from a strong “January Effect” this year. Should this momentum persist, Russell 2000 could continue to exhibit strength this February.
![[Midterm-Election Year February Performance Mini Table]](/UploadedImage/AIN_0226_20260122_February_2026_Midterm_Year_mini_table.jpg)
In midterm years, February’s performance improves with average returns generally increasing. Here again it is the Russell 2000 small-cap index that shines brightly, gaining 1.3% on average since 1982. DJIA and Russell 1000 tie for second best, averaging gains of 0.5% each, but DJIA enjoys the greatest frequency of gains. NASDAQ averages a gain of 0.4% (since 1974) while S&P 500 lags with average advance of 0.3% (since 1950).
![[February 2025 Seasonal Pattern Chart]](/UploadedImage/AIN_0226_20260122_February_2026_Seasonal_Paterns.jpg)
The first trading day of February is bullish for DJIA, S&P 500, NASDAQ, Russell 1000 and 2000. Average gains on the first day over the most recent 21-year period (solid lines in above chart) range from 0.39% by DJIA to 0.78% by Russell 2000. However, after a strong opening day, positive momentum has tended to stall out until around the seventh or eighth trading days. From there until around the 12-trading day all five indexes have historically enjoyed gains. But those gains have not held through the end of February. Midterm-year February performance (dotted lines in above chart) has taken a different trajectory with weakness typically prevailing until around the sixth trading day, but afterwards the major indexes have demonstrated strength through the end of February with some consolidation around monthly options expiration and/or Presidents’ Day holiday.
Monthly options expiration week had a spotty longer-term record and was improving prior to the arrival of COVID-19 in 2020. Since then the week has been down four to six times depending on the index. S&P 500 and Russell 1000 have been down six weeks straight. Russell 2000 had resisted the negative trend in 2023 and 2024 but dropped 3.7% in 2025. The week after was also improving prior to 2020 but also appears to have returned to its bearish longer-term tendency.
Presidents’ Day is the lone holiday that exhibits weakness the day before and after (Stock Trader’s Almanac 2026, page 80). The Friday before this mid-winter three-day break can be treacherous and average declines persist for three trading days after the holiday going back to 1980. In recent years, trading before and after the holiday has been more bullish. S&P 500 has been up 10 of the last 15 years on the day before and NASDAQ has been up 8 of the last 13 years on the day after.
|
February 2026 Strategy Calendar
|
|
By:
Christopher Mistal
|
January 22, 2026
|
|
|
|
|
January Barometer 101: Why It Works
|
|
By:
Jeffrey A. Hirsch & Christopher Mistal
|
January 15, 2026
|
|
|
|
We calculate our January Indicator Trifecta readings and market performance in general from close to close. This is standard operating procedure for all performance numbers throughout the industry. Daily, weekly, monthly, and annual market performance as well as all our indicator readings, and strategy and recommendation performance are not calculated from the open to the close. They are calculated from close to close. It may be different in day trading and crypto circles, but when you talk about an index’s percent change, gain or loss, it's from the close on one day to the close on the other day. Not after-hours trading, not pre-market trading, not the open to the close, it is the close to the close.
For the calculation for the First Five Days (FFD) Indicator, you take the close and the last trading before the first trading day of the year to the close on the fifth trading day of the year: from the 6,845.50 close on 12/31/2025 to the 6,921.46 close on 1/8/2025 S&P 500 was up 1.1% so the FFD was up this year. Using indicators like our January Trifecta is a bit of an art. Readings are not binary. It’s not one-dimensional where it triggers a buy or sell like MACD does with our Best Months Tactical Switching Strategies. It does not signal a bull or bear market has ended or begun. It’s a warning to use other analyses, wits and experience to adjust our outlook and portfolio positions if needed.
Why is the Trifecta so important? Since 1950, when all three January Indicators, Santa Claus Rally (SCR), First Five Days and the full-month January Barometer (JB) are up, S&P 500 is up 90.6% of the time 29 out of 32 years for an average gain of 17.7%. When one or more of the Trifecta are down the year is up only 61.4% of the time, 27 of 44, for a paltry average gain of 3.9%. 2022 was a perfect example. We did come into the year with a cautious outlook as it was a midterm year where many bear markets occur and bottom. The Santa Claus Rally was positive in January 2022, but FFD and JB were negative and we
called the bear in February 2022 and the bottom in
October 2022.
JB Holds the Key
As we discuss in our January 8 and 5 email Issues, even though the SCR was negative and FFD was positive, a positive January Barometer is key to maintaining a full-year 2026 bullish outlook. 2024 and 2025 were cases in point. SCR and FFD were both negative in 2024 and the JB was positive; S&P 500 was up 23.3% in 2024. SCR was down in 2025 while FFD and JB were up; S&P was up 16.4% last year. In both cases when JB came in green, we reiterated our bullish outlooks and guided you to stay bullish. The December Low Indicator (2026 STA, page 36) should also be watched with the line in the sand at the Dow’s December Closing Low of 47289.33 on 12/1/2025.
At this juncture we remain bullish, and our base case scenario outlined in our
2026 Annual Forecast is still in play. In our forecast, we noted that while midterm years are the worst year of the 4-year cycle, it is not the case for the second midterm year, which is significantly more bullish. Even though President Trump’s two terms are not consecutive this is still his second and last term in office (unless the law changes, which seems highly unlikely).
2026 and second midterm years in general are all about presidents cementing their legacy. Like it or not, Trump 2.0 has delivered on many of his promises, particularly regarding fiscal policies. The Big Beautiful Bill delivered tax reform, there has been a reduction in regulations, inflation is down, growth is up and the worst-case negative impact from tariffs has not materialized. Add in the Fed easing cycle, a solid economy and the continuing AI Tech Super Boom and our 70% probability base case scenario for annual gains in the 8-12% range seems quite plausible. We do expect some volatility, likely strongest in Q2 and Q3. But this sets up the Sweet Spot of the 4-Year Cycle from midterm Q4 to pre-election year Q2 that boasts average gains of 20.2% for S&P 500 and 29.3% for NASDAQ over the three-quarter stretch.
The History of the January Barometer
Devised by Yale Hirsch in 1972, the January Barometer (JB) has registered 12 major errors since 1950 for an 84.0% accuracy ratio. This indicator adheres to propensity that as the S&P 500 goes in January, so goes the year. Of the twelve major errors Vietnam affected 1966 and 1968. 1982 saw the start of a major bull market in August. Two January rate cuts and 9/11 affected 2001. In January 2003, the market was held down by the anticipation of military action in Iraq. The second worst bear market since 1900 ended in March of 2009 and Federal Reserve intervention influenced 2010 and 2014. In 2016, DJIA slipped into an official Ned Davis bear market in January. 2018 was the tenth major error overall as a hawkish Fed, a trade war and slowing global growth concerns resulted in the worst fourth quarter performance by S&P 500 since 2008. Covid-19 impacted 2020 & 2021. Of the 12 major errors, nine have occurred since 2001. Including the eight flat years yields a .733 batting average.
January is host to many important events, indicators, and recurring market patterns. U.S. Presidents are inaugurated and have historically solidified their annual agendas in January. New Congresses convene. Financial analysts release annual forecasts. We return to work and school collectively after holiday celebrations. On January’s second trading day, the results of the official Santa Claus Rally are known and on the fifth trading day the First Five Days “Early Warning” system sounds off, but it is the whole-month gain or loss of the S&P 500 that triggers our January Barometer.
And yet for some reason, every February or sooner, if January starts off poorly, our January Barometer gets raked over the coals. It never ceases to amaze us how our intelligent and insightful colleagues, that we have the utmost professional respect for and many of whom we consider friends, completely and utterly miss the point and relentlessly argue the shortcomings of our January Barometer. Again, this year we are not waiting until this happens. Instead, here is why the January Barometer is still highly relevant and why it should not be quickly dismissed.
1933 “Lame Duck” Amendment—Why JB Works
Many detractors refuse to accept the fact the January Barometer exists for one reason and for one reason only: the Twentieth “Lame Duck” Amendment to the Constitution. Passage of the Twentieth Amendment in 1933 created the January Barometer. Since then, it has essentially been “As January goes, so goes the year.” January’s direction has correctly forecasted the major trend for the market in many of the subsequent years.
Prior to 1934, newly elected Senators and Representatives did not take office until December of the following year, 13 months later (except when new Presidents were inaugurated). Defeated Congressmen stayed in Congress for all of the following session. They were known as “lame ducks.”
Since 1934, Congress convenes in the first week of January and includes those members newly elected the previous November. Inauguration Day was also moved up from March 4 to January 20.
January’s prognostic power is attributed to the host of important events transpiring during the month: new Congresses convene and the President typically presents an annual budget and sets national goals and priorities. These events clearly affect our economy and Wall Street and much of the world. Add to that January’s increased cash inflows, portfolio adjustments and market strategizing and it becomes apparent how prophetic January can be. Switch all of these events to any other month and chances are the January Barometer would become a memory.
JB vs. All
Over the years there has been much debate regarding the efficacy of our January Barometer. Skeptics never relent and we don’t rest on our laurels. Disbelievers in the January Barometer continue to point to the fact that we include January’s S&P 500 change in the full-year results and that detracts from the January Barometer’s predicative power for the rest of the year. Others attempt to discredit the January Barometer by going further back in time: to 1925 or 1897 or some other random year.
After the Lame Duck Amendment was ratified in 1934 it took a few years for the Democrat’s heavy congressional margins to even out and for the impact of this tectonic governing shift to take effect. In 1935, 1936 and 1937, the Democrats already had the most lopsided Congressional margins in history, so when these Congresses convened it was anticlimactic. Hence our January Barometer starts in 1938.
In light of all this debate and skepticism we have compared the January Barometer results along with the full year results, the following eleven months results, and the subsequent twelve months results to all other “Monthly Barometers” using the Dow Jones Industrials, the S&P 500 and the NASDAQ Composite.
Here’s what we found going back to 1938. There were only 13 major errors. In addition to the 12 major errors detailed above: in 1946 the market dropped sharply after the Employment Act was passed by Congress, overriding Truman’s veto, and Congress authorized $12 billion for the Marshall Plan.
Using these 13 major errors, the accuracy ratio is 85.2% for the full 88-year period. Including the 9 flat year errors (less than +/– 5%) the ratio is 75.0% — still effective. For the benefit of the skeptics, the accuracy ratio calculated on the performance of the following 11 months is still solid. Including all errors — major and flat years — the ratio is still a decent 68.2%.
Now for the even better news: In the 54 up Januarys there were only 4 major errors for a 92.6% accuracy ratio. These years went on to post 16.3% average full-year gains and 11.8% February-to-December gains.
Let’s compare the January Barometer to all other “Monthly Barometers.” For the accompanying bar charts we went back to 1938 for the S&P 500 and DJIA — the year in which the January Barometer came to life — and back to 1971 for NASDAQ when that index took its current form.
The accuracy ratios listed are based on whether or not the given month’s move — up or down — was followed by a move in the same direction for the whole period. For example, in the 88 years of data for the S&P 500 for the January Barometer, 66 years moved in the same direction for 75.0% accuracy.
The Calendar Year ratio is based on the month’s percent change and the whole year’s percent change: i.e., we compare December 2025’s percent change to the change for full-year 2025. By contrast the 11-month ratio compares the month’s move to the move of the following eleven months. February’s change is compared to the change from March to January. The 12-month change compares the month’s change to the following twelve months. February’s change is compared to the change from March to the next February.
Though the January Barometer is based on the S&P 500 we thought it would clear the air to look at the other two major averages as well. You can see for yourself in the charts that no other month comes close to January in forecasting prowess over the longer term.
There are a few interesting anomalies to point out though. On a calendar year basis DJIA in January is slightly better than the S&P. 2011 is a perfect example of how the DJIA just edges out for the year while the S&P does not. For NASDAQ April, September and November stick out as well on a calendar year basis, but these months are well into the year, and the point is to know how the year might pan out following January, not April, September or November. Plus, no other month has a stronger basis for being a barometer. January is loaded with reasons.
Being the first month of the year it is the time when people readjust their portfolios, rethink their outlook for the coming year and try to make a fresh start. There is also an increase in cash that flows into the market in January, making market direction even more important. Then there is all the information Wall Street has to digest: White House and Congress agendas and policy initiatives, FOMC meetings, 4th quarter GDP data, earnings, and a plethora of other economic data.
Myths Dispelled
In recent years new myths and/or areas of confusion have come to light. One of the biggest errors is the notion that our January Barometer is a stand-alone indicator that could be used to base all your investment decisions for the coming year on. This is simply not true, and we have never claimed that our January Barometer should or could be used in this manner. Our January Barometer is intended to be used in conjunction with all available data deemed relevant to either confirm or call into question your assessment of the market. No single indicator is 100% accurate so no single indicator should ever be considered in a vacuum. Our January Barometer is not an exception to this.
Another myth is that the January Barometer is completely useless. Those that believe this like to point out that simply expecting the market to be higher by the end of the year is just as accurate as the January Barometer. Statistically, they are just about right. In the 88-year history examined in this article, there were 25 full-year declines. So yes, the S&P 500 has posted annual gains 71.6% of the time since 1938. What is missing from this argument is the fact that when January was positive, the full year was positive 86.5% of the time and when January was down the year was up just 44.1% of the time. These are not the outcomes that pure statisticians prefer, but once again, our January Barometer was not intended to be used in a vacuum.
|
Stock Portfolio & Free Lunch Updates: Some Chop, Still Above Average
|
|
By:
Christopher Mistal
|
January 15, 2026
|
|
|
|
As of today’s close, Russell 2000 is leading the charge higher this January, up an impressive 7.76% with half the month still remaining. Compared to a Russell 1000 gain of 1.64%, small caps are outperforming by a solid 6.12% for a healthy “January Effect” (pages 112 & 144 of STA). In addition to the appearance of this seasonal tendency, it is also encouraging to see all major indexes logging above average gains compared to the recent 21-year average as a positive January Barometer would reinforce our currently bullish outlook for the year.
Due to the sizable gains thus far this month, January 2026 has been plotted on the right vertical axis in the chart above. Given the pace and magnitude of gains this month, the possibility of a bout of weakness and/or choppiness after mid-month cannot be ruled out entirely. However, should any weakness manifest between now and the end of the month, it is likely to be a buying opportunity, as long as January remains positive.
Free Lunch Stocks Picking Up
After a bumpy, mixed start,
Free Lunch stocks have begun to show signs of life this week. All 21 stocks have been added to the
Almanac Investor Stock Portfolio using a modest hypothetical allocation of $500. Four positions have been stopped out in total (three were noted in last week’s update).
Doximity Inc (DOCS) is the most recent position to be stopped out. Per our suggested guidelines, an 8% trailing stop based upon daily closing price is being used in the portfolio for the Free Lunch stocks.
The open position average return has climbed to 3.4%. Of the remaining 17 stocks, 12 were positive, 4 were negative and Getty Images Holdings Inc (GETY) was unchanged as of the market’s on January14. The top performing stock was National Storage Affiliates Trust (NSA), up 17.1% (up today an additional 2.35%). At the opposite end of the performance spectrum, the worst loser, Empire State Realty Trust Inc (ESRT), is down 7.1% but up nearly 4% today. The recent decline in mortgage interest rates and resulting pickup in real estate activity has aided many of the Free Lunch stocks.
As a reminder, Free Lunch stocks are not intended to be held for long, and we will be looking to exit them no later than around mid-February. Should a sizable profit present itself, do not hesitate to lock it in. The exact definition of a sizable profit is yours to decide. We will continue to hold the seventeen remaining positions.
Stock Portfolio Updates
Over the past four weeks, through the close on January 14, the Almanac Investor Stock Portfolio climbed a modest 1.2% higher, excluding dividends and any potential interest generated by the cash position, compared to a 3.1% advance by S&P 500 and a 6.4% gain by Russell 2000. Across the portfolio, large-cap positions were best on average, advancing 5.5%. Small- and mid-cap positions also contributed with smaller average gains.
HealWell AI (HWAIF) remains on Hold. Its shares are still struggling but it appears to have found some support around current prices. There also appears to be a corresponding decline in trading volume which suggests tax-loss selling pressures have or are abating. HWAIF remains a highly speculative trade in a sector that has been struggling recently. The next major catalyst will likely be its fourth quarter and year end 2025 earnings release sometime later in Q1.
The other significant blemish in the portfolio is Encompass Health (EHC). It has been essentially in freefall since releasing its earnings in late October of last year even though it did at least meet or slightly beat estimates depending upon data source then. Shares did rebound today after hitting their lowest levels since last April earlier this week. EHC is on Hold. EHC has announced it will release earnings after the market closes on February 5 with an investor call on the following day for discussion.
After surging to over $400 per share in late October, InterDigital (IDCC) has been in retreat and closed below its stop loss on December 31. Per standard trading guidelines, detailed at the bottom of the portfolio table below, IDCC was closed out of the portfolio the following day for a total gain of 184.9% after accounting for the sale of half the original position when it first doubled. We are going to keep an eye on IDCC for signs of improvement and positive momentum. Should conditions warrant, we may consider establishing a new position.
The previously mentioned decline in mortgage interest rates has also given a boost to Jones Lang LaSalle (JLL) and CBRE Group (CBRE). JLL was up over 4% in today’s trading while CBRE was up over 3.5%. Both positions are now positive and could easily continue to advance as housing sector activity picks up. JLL and CBRE can both still be considered on dips.
Please see table below for most recent advice. Note some stop losses and buy limits have been updated to account for recent market moves.
Disclosure note: Officers of Hirsch Holdings Inc. held positions in APH, AROC, BOOT, CBRE, COLL, EHC, ENSG, HWAIF, JLL, PAHC, RMBS, SMCI, and SNEX in personal accounts.
|
January Trifecta Update: First Five Days Positive – Tune Out the Noise
|
|
By:
Jeffrey A. Hirsch & Christopher Mistal
|
January 08, 2026
|
|
|
|
“Hope it’s worth all the noise” is a running joke around the Hirsch house when a family member (usually Jeff) knocks, drops or bangs something loudly. In our market analysis discussions lately, we have been coming back to a recurring theme of tuning out the noise from the news, market data scrutiny, Wall Street punditry and Fed jawboning.
President Trump’s operation in Venezuela, the subsequent changing story lines and rhetoric about other strategic moves in Greenland and elsewhere are a case in point for tuning out the noise. These sort of actions and commentary are all part of President Trump’s now well-known style, which the market has become desensitized to and less likely to be shocked by.
A couple of months ago the AI stock trade was dead. Sure, Mag 7 stock are struggling, but now memory chip stocks and copper are rallying on the AI buildout trade, plus rotation into many other sectors including small caps. Russell 2000 hit a new all-time high (ATH) today. DJIA hit two new ATHs in December and two earlier this week. S&P 500 hit two ATHs in December and one Wednesday. NASDAQ has not hit an ATH since October 29. So, we have some healthy bull market rotation. We are good with that.
In our view the market overweighs Fed commentary versus actual bond market action, and the Fed talks too much. We long for the old days, when Paul Volcker chaired the FOMC, and the Fed listened to the bond market and put up some guardrails on interest rates when the market and fiscal policy dictated such and refrained from the speaking tours the members currently seem so fond of.
Back in March 2023 during Wall Street’s fearmongering of a pending broad banking crisis on the news of the historic yield curve inversion we quoted this excerpt from the end of the Minutes of the FOMC Meeting (under Chairman Paul Volcker) on August 18, 1981, the meeting just before the previous historic yield curve inversion in September 1981 to shed some light. (
https://www.federalreserve.gov/monetarypolicy/fomchistorical1981.htm)
“The Chairman may call for Committee consultation if it appears to the Manager for Domestic Operations that pursuit of the monetary objectives and related reserve paths during the period before the next meeting is likely to be associated with a federal funds rate persistently outside a range of 15 to 21 percent.”
It seems relevant again as the prospects for more extensive rate cuts grow thin and the end of the Powell-Fed nears. Perhaps the new Fed chair coming this May will herald in a new era, a rebirth, of neutral stewardship versus dictating policy. The Fed Funds Rate is effectively near neutral. With the 10-year treasury virtually flat since September and the 30-year trending slightly higher since Halloween, meaningful rate cuts are unlikely without a crisis. The likely floor for Fed Funds is around 3.0–3.25% give or take. CME Futures imply no cuts until possibly June. Inflation is largely flatlining around 2.5–3% in line with historical averages, resembling a more “normal” pre-2008 regime rather than a crisis backdrop.
While there is a plethora of bullish forecasts for 2026 (present company included), many from respected colleagues, there is also a good deal of market negativity out there, at least for some sort of meaningful correction in the near term. Valuations are high. Red lights flashing. Etc. Current market negativity seems overstated. Economic growth is holding up, inflation is stable, interest rates are accommodative and the AI Super Boom rolls on.
Up First Five Days Great, Positive January Barometer Even Better
On the heels of the
Santa Claus Rally coming up a hair short the second leg of our January Indicator Trifecta, January’s First Five Days “Early Warning System” came in positive today. On the close of the market today, January 8, S&P is up 1.1% year-to-date and therefore our First Five Days (FFD) indicator is positive. Since 1949, the previous 50 positive (up) FFD were followed by 42 up full years and 8 down years with an average gain in all years of 14.2%. Of the 8 down full years, losses were double digit in just three; 1966 (–13.1%), 1973 (–17.4%), and 2002 (–23.4%). Conversely, 27 down First Five Days were followed by 15 up years and 12 down (44.4% accurate), with a paltry average gain of 1.1%. So, a positive FFD is meaningful.
![[Up FFD]](/UploadedImage/AIN_0226_20260108_Up_FFD_table.jpg)
This is constructive news as our Santa Claus Rally (SCR) indicator was a near miss on Monday. Down SCRs are highlighted in the big table above. With SCR negative and the FFD positive there are two possible outcomes remaining for our January Indicator Trifecta. Our January Barometer (JB) can either be positive or negative. Because there has only been one year since 1949 when the SCR and JB were negative with a positive FFD (2015), we have combined both outcomes into a single table.
Removing 2015 and its negative JB from the limited data set above, yields an 11-month average gain of 9.8% and full-year average of 14.2% which is similar to historical average performance following all past positive FFDs in the table above.
JB Predictive in Both Directions
Devised by Yale Hirsch in 1972, our January Barometer states that as the S&P 500 goes in January, so goes the year. The indicator has registered twelve major errors since 1950 for an 84.2% accuracy ratio. Including the eight flat-year errors (less than +/- 5%) yields a 73.7% accuracy ratio. For the record, in midterm election years FFD has a poor record. In the last 19 midterm election years, only 9 full years followed the direction of the First Five Days. However, full years followed January’s direction in 11 of the last 19 midterm election years. See page 16, 18, 20 and 24 of the 2026 Stock Trader’s Almanac for more.
Our base case bullish scenario outlined in our
2026 Annual Forecast for 8-12% gain in 2026 remains intact at least for now, until we get the full month January Barometer on the close of the market on Friday January 30, 2026. A positive FFD eases some of our negative SCR concerns. How the market trades for the rest of January and the result of our JB will weigh heavily on out outlook for full-year 2026. We will also be tracking the December Low Indicator (2026 STA, page 36) with its line in the sand at the Dow’s December closing low of 47289.33 from 12/1/2025.
|
ETF Portfolios & Free Lunch Updates: Gains Build in New Year
|
|
By:
Christopher Mistal
|
January 08, 2026
|
|
|
|
Free Lunch stocks have gotten off to a mixed start with the entire basket up a modest 0.1% as of the close today, January 8. All 21 stocks selected traded within a range of -3% to +3% of their respective December 19 closing prices on Monday, December 22 and will appear in the
Almanac Investor Stock Portfolio in the next update scheduled for January 15. Using the suggested 8% trailing stop loss based upon daily closing price, AMC, GO, and HPK have been stopped out already. Of the 18 remaining, 8 are higher and 10 are lower. The best performing stock is
Gogo Inc (GOGO), which is up 8.8% overall with nearly all of its gain produced today. Second best is National Storage Affiliates Trust with an 8.1% advance.
![[Free Lunch Table]](/UploadedImage/AIN_0226_20260108_Free_Lunch_table.jpg)
As a reminder, Free Lunch stocks are not intended to be held for long, and we will be looking to exit them no later than around mid-February. Should a sizable profit present itself, do not hesitate to lock it in. The exact definition of a sizable profit is yours to decide. We will continue to hold the eighteen remaining positions with the suggested 8% trailing stop loss based on closing prices.
Sector Rotation ETF Portfolio Updates
No new long sector seasonality trades start in January. There is a short trade associated with Computer Tech that begins in January and runs until early March, but this trade has been hit or miss in recent years, so we are going to pass on it this time around. The long seasonality in Computer Tech would end now and begin again in April. SPDR Technology (XLK), the corresponding position to the long Computer Tech seasonality, will be held and can be considered on dips.
Three other sectors end seasonally favorable periods in January: Info Tech, Broker/Dealer, and Pharmaceutical. iShares US Technology (IYW) was added to trade Info Tech’s seasonality. Similar to Computer Tech, Info Tech starts a new bullish seasonality in March. Rather than sell IYW at a minimal gain now and buy it again in March, we will continue to hold it. IYW can be considered on dips.
Broker/Dealer and Pharmaceutical exposure was bundled with Banking and Healthcare in October due to overlap in corresponding ETF holdings. With Banking and Healthcare sector strength running until May, SPDR Financial (XLF) and SPDR Healthcare (XLV) can still be considered on dips below their buy limits.
In accordance with the
December 4, email Issue,
SPDR Gold (GLD) was sold and closed out of the portfolio when it first traded above $390.00 on December 5, 2025 for a 27.4% gain. GLD did continue higher to fresh new all-time highs in late December, but its momentum appears to be fading. If GLD has not already been closed out, consider implementing a tight trailing stop loss or an outright sale or partial sale to lock in profits as seasonal strength in gold has historically ended in December.
Last month’s new trade ideas, SPDR Energy (XLE) and S&P Oil & Gas Equipment & Services (XES), aimed at taking advantage of historical seasonal strength in the oil sector beginning around mid-December and lasting until around July have been added to the portfolio. XES was added on December 16 and was up 7.5% as of its close on January 7. XLE, was added two days later on December 18 and was up 2.5% yesterday. Buy limits and stop losses for XLE and XES have been updated and both can still be considered on dips.
Broad based demand for copper has pushed it back to new all-time highs earlier this week and corresponding positions in United States Copper (CPER) and Global X Copper Miners (COPX) have risen to gains of 13.9% and 23.6% respectively. CPER and COPX can also be considered on dips below their respective updated buy limits. Demand for copper is wide ranging from traditional uses in developing nations to AI, robotics and electric cars while new supply is lagging.
Bitcoin failed to rally during its historically favorable period during Q4, and iShares Bitcoin (IBIT) was stopped out on December 5 when it closed below its stop loss of $52.00. Since then, IBIT has gone essentially nowhere and is currently still below $52. Historically, bitcoin has struggled in midterm years, and its recent performance has done little to reduce concerns about another potentially challenging midterm year in 2026.
Seasonal strength in the telecom sector has historically ended in late December and iShares DJ US Telecom (IYZ) appears to be losing momentum. Sell IYZ above $34.00 or if it closes below its stop loss at $33.25.
iShares Semiconductor (SOXX) is on Hold. Seasonal strength in the semiconductor sector has generally come to an end in February and despite breaking out to new highs earlier this week it has already begun to stumble.
Invesco DB Agriculture (DBA) is on Hold. As noted in the last update, DBA holds a basket of various agricultural commodities that can move in different directions resulting in no net gains. However, its two largest holdings have tended to exhibit strength during Q1.
All other positions in the Sector Rotation portfolio can still be considered on dips below their respective buy limits or at current levels. Buy limits and stop losses have been adjusted, where applicable, for recent gains in the table below.
Tactical Seasonal Switching Strategy ETF Portfolio Updates
Although the final four trading days of December were weak, the major indexes did close out 2025 with solid gains and the turning of the calendar to 2026 has seen a pickup in buying with respectable gains over the first five trading days of the New Year. Boosted by this New Year strength, the Tactical Seasonal Switching Portfolio was up 3.7% on average as of the close on January 7. SPDR DJIA (DIA) is the best performing position, up 5.0%. iShares Russell 2000 (IWM) is second best, up 4.1% while SPDR S&P 500 (SPY) and Invescos QQQ (QQQ) are both up 2.9%.
This January has gotten off to a solid start but January’s have historically been
weaker in midterm years since 1950. Should any typical mid-January weakness materialize this year, it could be an opportunity to add to existing positions. “Best Months” positions,
QQQ, IWM, DIA and SPY can still be considered near current levels up to their respective buy limits.
Disclosure note: Officers of Hirsch Holdings Inc held positions in COPX, DBA, DIA, EFAV, EFV, EZU, IDV, IWM, IYT, QQQ, SPY, XES and XLE in personal accounts.
|
Santa Claus Rally Comes Up Hair Short, Focus on January Barometer
|
|
By:
Jeffrey A. Hirsch & Christopher Mistal
|
January 05, 2026
|
|
|
|
For several hours today it looked like the Santa Claus Rally was going to materialize but Santa was a no-show for the third year in a row despite solid market gains today. From its close of 6909.79 on December 23, 2025, through today’s close of 6902.05, S&P 500 declined 0.11% thus the Santa Claus Rally is now officially negative. For what it’s worth the Dow was up 1.1% over the Santa Claus Rally period and logged a new all-time high today to ring in the year with across-the-board strength.
Defined in the Stock Trader’s Almanac, the Santa Claus Rally (SCR) is the propensity for the S&P 500 to rally the last five trading days of December and the first two of January with an average gain of 1.3% since 1950. This indicator was discovered and first published by Yale Hirsch in the 1973 edition of the Almanac.
The lack of a rally can be a preliminary indicator of tough times to come. This was certainly the case in 2008 and 2000. A 4.0% decline in 2000 foreshadowed the bursting of the tech bubble and a 2.5% loss in 2008 preceded the second worst bear market in history. Down SCRs were followed by flat years in 1994, 2005 and 2015, and a mild bear that ended in February 2016. In 2024, New Years jitters were quickly shrugged off, and the S&P 500 logged its second straight yearly gain in excess of 20%. However, last year, in 2025, the absence of Santa preceded the brisk tariff induced selloff that knocked S&P 500 down 18.9% from its February closing high to its April 8 closing low. Of the 17 down SCRs since 1950, 12 years have been up and 5 down, but the average gain is a tepid 6.7%. As Yale Hirsch’s now famous line states, “If Santa Claus should fail to call, bears may come to Broad and Wall.”
With the Santa Claus Rally a no show we will be watching for a positive First Five Days (FFD) and January Barometer (JB), the second and third legs of our January Indicator Trifecta. With two more January indicators remaining, we will reserve final judgement until the end of January when the JB result is officially known. However, should the January Barometer be negative, it will weigh heavily on the outlook for full-year 2026.