|
Market at a Glance - February 26, 2026
|
|
By:
Christopher Mistal
|
February 26, 2026
|
|
|
|
Please take a moment and register for our members’ only webinar, March 2026 Outlook & Update on Wednesday March 4, 2026, at 4:00 PM EDT here:
Please join us for an Almanac Investor Member’s Only discussion of recent market action with time for Q & A at the end. Jeff and Chris will cover their outlook for March 2026, review the Tactical Seasonal Switching Strategy ETF, Sector Rotation ETF, and Stock Portfolio holdings and trades. We will also share assessments of the economy, the Fed, inflation, geopolitical events, gold, silver, copper, energy as well as relevant updates to seasonals now in play.
If you are unable to attend the live event, please still register. Within a day of completion, we will send out an email with links to access the recording and the slides to everyone that registers.
After registering, you will receive a confirmation email containing information about joining the webinar and a reminder message.
Market at a Glance
2/26/2026: Dow 49499.20 | S&P 6908.86 | NASDAQ 22878.38 | Russell 2K 2677.29 | NYSE 23524.84 | Value Line Arith 13057.46
Seasonal: Improving. March has historically been a respectable month for DJIA, S&P 500, NASDAQ, and Russell 2000 with average gains ranging from 0.6% from Russell 2000 to 1.0% by S&P 500 in all years. In midterm years, March has generally been even stronger with average gains expanding to 1.1% by DJIA to an impressive 2.5% from Russell 2000. DJIA and S&P 500 have been positive in six of the last seven midterm Marchs.
Fundamental: Mixed. After a messy Q4 forecast due to the Federal government shutdown, the Atlanta Fed’s GDPNow model currently estimates Q1 growth at 3.1%. Inflation continues to run at a stubbornly elevated level but did hint at some degree of cooling with consumer prices (CPI) coming in below expectations in January at 2.4% year-over-year. Nonfarm employment was also better than anticipated in January with 130,000 job gains. All reasonably fair numbers yet room for improvement remains. Corporate earnings were generally better than expected, but that result has essentially become the norm leaving traders and investors generally wanting for more.
Technical: Rotation. DJIA closed at new all-time highs, above 50,000 for the first time, in February, but S&P 500, NASDAQ, and Russell 2000 did not. DJIA did close below its 50-day moving average once this month while NASDAQ spent most of the month below its 50-day moving average. Money has moved out of technology but not completely out of the market. Key levels to watch are December’s closing lows for DJIA and S&P 500 at 47289 and 6721 respectively. For NASDAQ, its November closing low at 22078.
Monetary: 3.50 – 3.75%. Based upon the CME Group’s FedWatch Tool, the Fed is not likely to make any changes to interest rates until sometime later in the second half of the year with just a 67.4% chance for a rate reduction in July. It seems reasonable to believe that this tool is also taking into consideration a change of leadership at the Fed as well. If this is the case, the Fed and its board members will likely remain busy giving speeches and media interviews as they continue to await new economic data. This lack of a unified message from the Fed likely does more harm than good.
Sentiment: Elevated. According to
Investor’s Intelligence Advisors Sentiment survey Bullish advisors stand at 55.6%. Correction advisors are at 29.6% and Bearish advisors were just 14.8% as of their February 25 release. Compared to last month, overall sentiment has eased slightly. Some bullish advisors have shifted to correction, but outright bearish advisors remain subdued. Based upon sentiment, caution is still in order. Stick with sectors and/or stocks that have been working while avoiding highly speculative areas that have been struggling lately.
|
March Outlook: Beware the Ides - Prepare for Midterm Weak-Spot Volatility
|
|
By:
Jeffrey A. Hirsch & Christopher Mistal
|
February 26, 2026
|
|
|
|
Last month we warned you about the market’s propensity to take a
break in February, especially after a run-up like we had and a positive January. February played out rather close to its history as the weak link in the “Best Six Month” and delivered typical choppy market action. S&P 500, NASDAQ and Russell 1000 remain in the red for the month at today’s close while DJIA and Russell 2000 are positive with the small cap benchmark in the lead, up 2.4%.
Seasonal softness, elevated volatility, and lost momentum near the top of the current trading range do not necessarily indicate a structural breakdown. There does not appear to be any major reason for this pullback. This seems like a classic combination of market consolidation, typical midterm election year seasonal weakness and some sector rotation. Beneath the surface, technical support remains intact, seasonal patterns remain aligned with expectations, and economic fundamentals—particularly jobless claims—continue to signal resilience. Today’s initial jobless claims number was lower than estimates and remains historically supportive, even as headlines continue to lean negative.
We’ve covered significant ground off last year’s lows, and it’s natural to see some toppy behavior in leading indexes. Some technicians are noting Hindenburg omens and other cautionary signals floating around. But we’ve heard these false alarms before. Nothing in our observations suggests a major breakdown—rather, a market nearing the ceiling of its recent range and preparing for the next rotation.
Our seasonal charts continue to indicate the potential for additional upside into the end of the Best Six Months, though gains from here are likely to be modest. Notice in the updated S&P 500 Midterm Election Year Seasonal Pattern chart how the market begins to flatten out around the Ides of March (mid-month) in the midterm year. This is a good reminder that we are approaching the window where the market often settles into the classic midterm election year Q2-Q3 weak spot.
Elevated Sentiment Concerns
Our favorite sentiment indicator has now become concerning. The difference between
Investors Intelligence Bullish Advisors % less Bearish Advisors % has been elevated for some time now. The bull-bear spread tracked in the chart below has been above +40 six times in the last seven weeks and it’s the second push above this danger zone level in the past four months. As you can see in the yellow shades it was last at these levels in October/November 2025.
This looks like the pattern we traced out in 2024 ahead of the early 2025 tariff-induced correction. We are not anticipating as severe a correction as the tariff tumble but highlighting that a third push above +40 bulls is likely to lead to a more sustained pullback, which would align well with our seasonal “Worst Six Months” May-October and the Midterm Year Q2-Q3 Weak Spot.
Technical Levels to Watch
Our outlook for the full year remains bullish with our base case scenario of 8-12% annual gains on track. The
positive January Barometer reading has affirmed our bullish stance. And while the January Barometer rules, there are some technical levels we are watching. Number one is the Dow’s December Closing Low indicator (page 36 STA 2026), which we detailed in the
February Outlook. The December Low Indicator is based on the Dow closing below its December Closing Low in the first quarter of the New Year. DJIA’s December closing low was 47289.33 on 12/1/2025. DJIA is currently 2210 points higher than that level today. But it is still a line in the sand to watch.
As you can see from the chart below, this December low level also lines up with support for the S&P 500 in the black line around 6700. Near term support sits at about 6800 as indicated in the short horizontal blue line right at the February 5 low which has encouragingly held so far this month with one day to go. Should we break this 6700-6800 support area the next level of support sits at about 6500 near the October and November lows and the late August/early September consolidation area. Below that is 6200 around the end-of-July/first day-of August four-day correction and the bottom of the early July consolidation. Below that is the 6000 area near the June gap higher, but that is unlikely at this juncture.
![[S&P 500 Technical Chart]](/UploadedImage/AIN_0326_20260226_SPX_TA_Support.jpg)
Sentiment remains elevated, momentum is slowing, and we are increasingly seeing a sideways range develop. This transition is right on seasonal schedule. Any number of catalysts can trigger the soft patch: more AI disruptions, tariff and trade tensions, geopolitical flare-ups, shifting Fed and interest rate expectations and midterm election-year politicking. Whatever the case, the market environment is clearly ripening for some seasonal weakness. After one more push higher to perhaps marginal new highs the market is likely to begin a more sustained pullback and move sideways from mid-March through the end of April. Stick with the data, lean on seasonality, and avoid overreacting to short-term narratives and tune out the negative noise.
Pulse of the Market
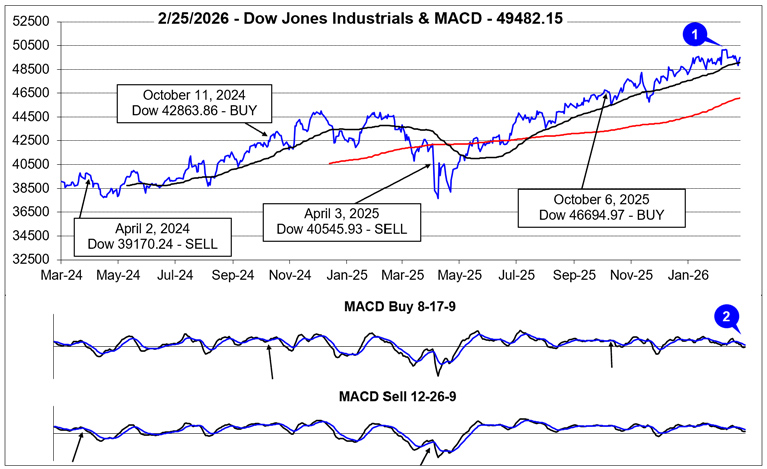
Although it may feel like it has been a painfully long time since everyone was last talking about new all-time closing highs, it will be just three weeks since DJIA first closed above 50,000 on Friday, February 6. DJIA went on to close above this key psychological level three additional days in a row (1) before succumbing to the drag of AI everything concerns. Nonetheless, DJIA has proven its resilience, holding onto a 1.2% February gain. With one trading day left in February it is on the verge of extending its historic monthly winning streak to 10 in a row.
DJIA’s loss of positive momentum around mid-February is confirmed by both the faster and slower moving MACD indicators being negative and trending lower (2) as of the close on February 25. Bullishly, DJIA’s dip below its 50-day moving average was limited with just a single close below and its uptrend from last spring still remains intact.
For all the chop and volatility, the market has been exhibiting, trader and investor sentiment appears to be holding up. Aside from the single Down Friday/Down Monday (DF/DM) occurrence in January and three modest DJIA weekly declines (3) performance on Fridays and Mondays (or first trading day of the week) has not been overly negative. If traders and investors are comfortable enough to hold positions over the weekend and then buy again on Mondays, it would seem expectations for additional gains are still holding up. Should market performance significantly deteriorate on Fridays and/or Mondays, this could be a sign that market expectations are shifting negatively.
Given all the red weekly losses for DJIA (3), S&P 500 (4), and NASDAQ (5) since the start of 2026, it may come as a surprise that only NASDAQ is down year-to-date as of today’s close (February 26). Also of note is NASDAQ’s five week losing streak that ended last week on February 20, was its longest consecutive weekly losing streak since May of 2022 when it was down seven straight and 10 out of 11. Cumulative losses during this year’s weekly losing streak have been relatively mild compared to similar past streaks. This would appear to suggest rotation and repositioning rather than an outright exit.
Market breadth over the last three weeks has been positive with Weekly Advancers outnumbering Weekly Decliners (6) despite S&P 500 and NASDAQ weekly declines in two of the three weeks. This also appears bullish and supportive of a rotation/reposition theme rather than broad-based selling. Technology shares have had an impressive run and some of those profits appear to be moving to other potentially more attractive corners of the market.
Another positive and bullish indication is that the number of new 52-week Highs (7) hit a high of 653 during the week ending February 13. However, new 52-week Lows also briefly expanded before declining in each of the last two weeks. This also appears to support a rotation theme rather than an outright exit. A steady trend higher in the number of new 52-week Highs accompanied by an opposite trajectory for new 52-week Lows would be ideal. Any meaningful deviation from the ideal scenario would warrant additional caution especially as the “Weak Spot” of the 4-Year Presidential Election Cycle draws near (page 46 of STA 2026).
Short-term and long-term Treasury bond yields appear to be settling into a range (8) now that Fed interest rate cuts appear to be on hold for the near-term. Lingering disruptions due to last fall’s Federal government shutdown are also likely weighing on rates as economic data has become increasingly mixed recently. Rate stability combined with relatively low rates has historically benefited the stock market. Any dramatic change in interest rates would likely be disruptive no matter if it was lower or higher.
Click for larger graphic…
Seasonally Speaking!
On March 11 Jeff is joining Fausto Pugliese’s
Cyber Trading University with a host of other top traders for
March’s Cyber Expo Trading Summit for two intensive days of cutting-edge strategies, market analysis, and tools to help you trade. March 11-12 | Live Online – Reserve Your Free Spot Here:
https://cybertradingexpo.com/march-2026-traders-almanac
Then in April he will be presenting at The 2026 MoneyShow Masters Symposium Hollywood Florida which will run from April 9-11 at the exclusive Diplomat Beach Resort. Over three days at the oceanfront venue, you’ll learn about the greatest investing and trading opportunities in 2026 – from dozens of the nation’s leading financial experts.
Here are my two sessions at the Expo on Thursday, April 9, 2026:
Should you Sell in May in the Midterm Election Year 2026?
Stock Panel: The NEW Leaders: A Case for Small Caps, Out-of-Favor Sectors, and “Forgotten” Stocks
|
March 2026 Almanac & Vital Stats: A Solid Month in Midterm Years
|
|
By:
Jeffrey A. Hirsch & Christopher Mistal
|
February 19, 2026
|
|
|
|
As part of the Best Six/Eight Months, March has historically been a satisfactory month with DJIA, S&P 500, NASDAQ, Russell 1000 & 2000, advancing more than 63% of the time with average gains ranging from 0.6% by Russell 2000 to 1.0% by S&P 500. Over the recent 21-year period (2005-2025), March has tended to open positively with modest average gains accumulating over the first three trading days. A bout of weakness has followed (solid arrow below) before all indexes begin moving higher around mid-month through month’s end.
In midterm election years since 1950, March has also tended to open strongly, but strength has generally persisted until around the first day of Spring (dashed arrow below). At which point, the major indexes lost momentum and closed out March with some choppy trading. One possible reason for stronger performance in midterm-election-year Marchs is the tough time the market has had in historically tepid February.
![[Recent 21-Year & Midterm Year March Seasonal Pattern Chart]](/UploadedImage/AIN_0326_20260219_March_2026_Seasonal_Chart.jpg)
March packs a rather busy docket. It is the end of the first quarter, which brings with it quarterly Triple Witching and an abundance of portfolio maneuvers from The Street. March Triple-Witching Weeks have been quite bullish in recent years. But the week after has been nearly the exact opposite, DJIA down 23 of the last 38 years—and often down sharply. In 2018, DJIA lost 1413 points (–5.67%) Notable gains during the week after for DJIA of 4.88% in 2000, 3.06% in 2007, 6.84% in 2009, 3.05% in 2011, and a staggering 12.84% in 2020, are the rare exceptions to this historically poor performing timeframe.
Historically a consistently performing market month, March improves in midterm-election years (see Vital Statistics table below). In midterm years March ranks: 4th best for DJIA and S&P 500 and 3rd best for NASDAQ, Russell 1000, and Russell 2000. DJIA, S&P 500, Russell 1000 and 2000 have been positive in six of the last seven midterm Marchs. NASDAQ has been slightly softer, with gains in five of the last seven.
Saint Patrick’s Day is March’s sole recurring cultural event. Gains on Saint Patrick’s Day have been greater than the day before and the day after. Perhaps it’s the anticipation of the patron saint’s holiday that boosts the market and the distraction from the parade down Fifth Avenue that causes equity markets to languish. Or maybe it’s the fact that Saint Pat’s often falls in historically bullish Triple-Witching Week.
Whatever the case, since 1950, the S&P 500 posts an average gain of +0.27% on Saint Patrick’s Day (or the next trading day when it falls on a weekend), a gain of +0.05% the day after and the day before averages a +0.14% advance. S&P 500 median values are +0.18% on the day before, +0.25% on Saint Patrick’s Day and 0.05% on the day after. In the eleven years when St. Patrick’s Day fell on a Tuesday, like this year, since 1950, the day before (Monday) produced an average loss of –1.02%, while Tuesday averaged +1.14% and the following Wednesday declined on average –0.12%. March 2020 does heavily influence average performance with S&P 500 dropping 12% on Tuesday, March 16, 2020.
|
March 2026 Strategy Calendar
|
|
By:
Christopher Mistal
|
February 19, 2026
|
|
|
|
|
Stock Portfolio & Free Lunch Updates: AI Takeover Fear & Heading for Exit
|
|
By:
Christopher Mistal
|
February 12, 2026
|
|
|
|
February is historically no stranger to market volatility. This year the market has been taking shots from AI concerns ranging from its cost to develop to the fear it could steal business from existing companies or displace numerous humans from the labor force. Some of the selling does look overdone as many of AI’s concerns are still rather speculative. Mass layoffs have yet to appear and spending plans are just that, plans that could change. There is little doubt AI will have a major and significant impact on the economy, but like many of the technological advances of the past, AI is likely to also create vast new opportunities. When conversation and discussion finally turn away from fear and loss to the new opportunities, we suspect many of the names getting hit today will be thriving again.
Volatility has returned after its brief hiatus, but thus far February’s lows have held, and the current pullback looks like a retest. As of today’s close, February 12, DJIA and Russell 2000 are still positive this month, up 1.1% and 0.08% respectively. S&P 500, NASDAQ and Russell 1000 are in the red. Compared to the patterns of past midterm year Februarys this year is not far off course. The magnitude of this year’s moves has been larger compared to the averages but there are similarities in the trend. DJIA and Russell 2000 are leading while the rest are lagging. Provided last week’s low closes hold, the major indexes could begin to choppily trade higher through the end of the month. Typical, longer-term Presidents’ Day weakness could delay a rebound while DJIA’s December 1, 2025, closing low of 47289.33 remains a line in the sand (page 36 STA 2026). At today’s close of 49451.98 DJIA stands 4.6% above its December closing low.
Free Lunch Stocks – That’s A Wrap
This year’s go around with
Free Lunch stocks was at best another mixed bag despite a solid year-to-date performance by many small-cap stocks and indexes. As of the market’s close yesterday, February 11, just 7 of the original 21 stocks remained. Of these 7 stocks, 6 were positive and one was modestly negative. Collectively, the 7 remaining stocks were up 10.4% on average. However, when the other 14 stocks that were previously stopped out, are considered overall average performance for the entire basket slips to just 0.7%.
The best performing position in the basket was National Storage Affiliates Trust (NSA), up 19.5%. Second place honors go to EOG Resources (EOG) with a 15.5% gain. Lamb Weston Holdings (LW) rounds out the top three with a 15.4% gain. The suggested 8% trailing stop using daily closing prices appears to have worked reasonably well with just a few whip-saw events while still providing some protection from larger drops like what occurred with Doximity (DOCS). DOCS was nearly cut in half since December.
Now that mid-February has arrived, it is time to close out the remaining Free Lunch stock positions. Sell AMT, ESRT, EOG, LW, NSA, NXRT, and TU. For tracking purposes, they will be closed out of the Almanac Investor Stock Portfolio using their respective average prices on February 13, 2026.
Stock Portfolio Updates
Over the past four weeks, through the close on February 11, the Almanac Investor Stock Portfolio climbed 2.0% higher, excluding dividends and any potential interest generated by the cash position, compared to just a 0.2% advance by S&P 500 and a 0.7% gain by Russell 2000. Across the portfolio, mid-cap positions were best on average, advancing 9.2%. Small- and large-cap positions also contributed with smaller average gains. Overall portfolio gains were held in check by a sizable cash balance. This growth in cash is the result of closing some Free Lunch stocks, the closure of stopped-out positions, and from taking profits when a stock position first doubles. The cash balance is not a targeted allocation percentage.
HealWell AI (HWAIF) remains on Hold. This was and still is a highly speculative trade in a sector/industry that continues to struggle. Having its primary listing outside of the U.S. has not been helpful either. HWAIF’s overall performance is disappointing but there have been some potentially encouraging signs recently. HWAIF did post a gain today during a sea of red. We await their next quarterly earnings release later this quarter.
Encompass Health (EHC) was stopped out of the portfolio on January 20 when it closed below its stop loss at $99.55. This was also disappointing as EHC did beat when it released earnings on February 5 and it did jump higher. However, it does remain to be seen if the current move higher will persist. As of today, positive momentum appears to be fading, and EHC is still below its intra-day high from February 6.
In the last Stock Portfolio update we noted improvements in Jones Lang LaSalle (JLL) and CBRE Group (CBRE). Unfortunately, AI takeover fears have now spread into real estate stocks. The magnitude of the sell-off does seem excessive, especially considering it is still largely hypothetical. Plus, CBRE just released earnings for its strong Q4. Revenues reached a record high while revenue growth was 12% and earnings per share grew 18%. CBRE’s guidance was solid as well.
Nonetheless, CBRE and JLL did close below their stop losses today. Both will be closed out of the portfolio on February 13 and will appear in the next portfolio update. Is the AI-takeover rout over in real estate? Probably not just yet but a significant amount of damage has been done and valuations are being reset.
On a brighter note, OSI Systems (OSIS) did trade at new all-time highs in January and above twice its original purchase price. As a result, half of the position was sold on January 21. OSIS has since retreated modestly but its uptrend does still appear to be intact. OSIS is on Hold.
Archrock (AROC) also deserves some attention. It is essentially a small-cap energy sector stock with a current market capitalization of approximately $5.5 billion. As of today’s close, it is up 22.9% year-to-date and 29.4% since addition to the portfolio. Energy is one sector that has remained firm bucking AI-takeover fears and broader tech troubles. AROC can be considered on dips below $31.55.
Right alongside AROC in the table below, StoneX Group (SNEX) has also been on a tear, closing at a new all-time high yesterday and trading to a new intra-day high today before pulling back. SNEX can be considered on dips below $119.35.
Please see the table below for most recent advice. Note some stop losses and buy limits have been updated to account for recent market moves.
Disclosure note: Officers of Hirsch Holdings Inc. held positions in APH, AROC, BOOT, CBRE, COLL, , ENSG, HWAIF, JLL, PAHC, RMBS, SMCI, and SNEX in personal accounts.
|
ETF Trades & Updates: Natural Gas Pullback Setup
|
|
By:
Christopher Mistal
|
February 05, 2026
|
|
|
|
If you missed the member’s only webinar on Wednesday, the slides and video recording are available
here (or copy and paste in a new browser window:
https://www.stocktradersalmanac.com/LandingPages/webinar-archive.aspx). In the webinar, Jeff reviewed the importance and significance of a full-month January gain and a positive January Barometer. He also covered the current economic backdrop, interest rates, and Bitcoin’s horrific midterm year track record along with the current slump in gold and silver.
Despite generous quantities of “noise,” the market does appear to be tracking seasonal patterns reasonably well. Headwinds remain plentiful but there are also numerous tailwinds that may not get as much attention. In consideration of it all and a positive January Barometer, Jeff affirmed our bullish Base Case scenario for full year gains of 8-12% is still in play. Along the way, some typical midterm-year weakness likely during Q2-Q3 is likely before the “Sweet Spot” of the 4-year cycles arrives later in the year most likely in early Q4.
New Fed Chair — Not so bearish
After much speculation, Kevin Warsh has been nominated to be the next Chairman of the Federal Reserve. This change in leadership at the Fed is actually not all that common as there have only been 12 different individuals to lead the Fed going back to 1930. Naturally this does create some uncertainty and generally the market does not respond well to uncertainty. However, contrary to some research we have seen, a change of Fed leadership does not appear to be all that bad for the market.
Drawdowns are a worst-case scenario and are generally one of the more bearish datapoints to present. To give you a general idea, the average S&P 500 drawdown in a calendar year going back to 1930 is 16.1%. The flip side of the worst drawdown would be the best rally, a bullish number. S&P 500 has averaged an impressive 25.9% best rally in a calendar year since 1930. Over the same 96-year span, S&P 500’s average annual performance has been 8.0%.
Above we present the S&P 500’s performance following a change in leadership at the Fed. Historically, performance is not all that bearish. Aside from the 3 months later interval, all other interval’s frequency of advance (% Higher) are above our standard 60% bullish threshold and average performance is positive.
Going one additional step, let’s say Eugene Meyer was not responsible for the Great Depression and Alan Greenspan probably did not cause the market’s crash in 1987. Bad timing, perhaps? Removing them from the data essentially removes the most bearish data. Average performance across all intervals goes up and is positive while frequency of gains also improves noticeably and performance 1-year later jumps to an average gain of 12.7%, with the S&P 500 higher 90% of the time.
New February Sector Seasonality
Based upon the NYSE ARCA Natural Gas Index (XNG), there is a seasonal tendency for natural gas companies to enjoy gains from the end of February through the beginning of June. Detailed in the Stock Trader’s Almanac 2026 on page 94, this trade has returned 16.19%, 17.82%, and 22.56% on average over the past 25, 10, and 5 years respectively. This seasonal strength can be seen in the accompanying seasonal chart of XNG highlighted in yellow below weekly price bars.
![[NYSE ARCA Natural Gas Weekly Bars (XNG) and 1-Year Seasonal Pattern since 1990]](/UploadedImage/AIN_0326_20260205_XNG_Seasonal.jpg)
One of the factors for this seasonal price gain is consumption driven by demand for heating homes and businesses in the cold weather northern areas in the United States. In particular, when December and January are colder than normal, we can see drawdowns in inventories through late March and occasionally into early April. This can result in price spikes lasting through mid-April and beyond. Crude oil also tends to rise during this timeframe in anticipation of the summer driving season and many of the companies that produce and supply natural gas also have exposure to crude oil.
There is no doubt that the last few weeks have been bitterly cold across parts of the central U.S. and along the east coast this winter. Freezing temperatures have extended deep into Florida and snow blankets much of the Northeast. Here, just north of New York City, it has been below freezing for longer than I can quickly recall. The frigid weather has increased demand for natural gas but according to today’s
Weekly Natural Gas Storage report, inventories have only modestly declined as of the week ending January 30, 2026.
First Trust Natural Gas (FCG) is our top choice to gain exposure to the company side of the natural gas sector. FCG could be considered on dips below a buy limit of $24.75. If purchased, consider taking profits at the auto-sell price, $34.51. In consideration of recent volatility, there is no suggested initial stop loss. As a reminder the auto sell price is based upon FCG’s buy limit plus the sector’s average price return over the last 25 years with an additional 20% added. Additionally, should FCG reach the auto-sell price, a tight trailing stop could be used in lieu of an outright sale.
The top five holdings by weightings as of yesterday’s close are: ConocoPhillips, Occidental Petroleum, Diamondback Energy, Devon Energy and Hess Midstream. The net expense ratio is reasonable at 0.57% and the fund has approximately $530.4 million in assets. For tracking purposes, we will add FCG to the Sector Rotation ETF portfolio if it trades below its buy limit.
A second choice to consider is United States Natural Gas (UNG). Instead of holding stocks, UNG holds natural gas futures and swaps. It is designed to track the daily price movements of natural gas. Its total expense ratio is high compared to FCG at 1.24% and it has assets of approximately $482.9 million. UNG can be considered on dips below a buy limit of $13.20. If purchased, profits can be taken at the auto-sell price of $18.40. Also, there is no initial stop loss suggested for UNG due to recent volatility and the possibility of getting quickly whipsawed out of the position.
Sector Rotation ETF Portfolio Updates
One sector seasonality comes to an end in February, Semiconductors. iShares Semiconductor (SOXX) has pulled back since closing above $360 on January 29 but it did display strength today closing with a modest gain. Sell SOX at $340 or higher. Should it fail to reach that level, its stop loss at $325 is the level to watch. Should it close below its stop or trade above $340 it will be closed out of the portfolio.
Biotech’s seasonally strong period has historically come to an end in early March. In preparation of this, iShares Biotech (IBB) and SPDR S&P Biotech (XBI) are now on Hold. As of the close on February 4, IBB and XBI were up 15.8% and 21.3% respectively for an average gain of 18.5%. This performance is solidly above the sector’s long-term 25-year average performance of 11.2% during its seasonally favorable period. Stop losses for IBB and XBI have also been increased.
Per last month’s update, iShares DJ US Telecom (IYZ) was sold and closed out of the portfolio on January 15 when it first traded above its sell price of $34.00 producing a humble 4.6% gain excluding dividends and trading costs. This sale was early as IYZ has since briefly traded above $37.00. Part of the recent surge in IYZ can be attributed to strength in Verizon shares but that momentum appears to be fading now.
Following a sluggish start in December, SPDR Energy (XLE) and S&P Oil & Gas Equipment & Services (XES) have risen briskly this year. XES traded above its auto-sell price of $97.90 on January 23 and per standard trading guidelines (found at the bottom of the portfolio table below) was sold and closed out of the portfolio for a 21.8% gain. XLE remains and is on Hold. In response to its impressive gains thus far, its stop loss and suggested auto-sell price have been increased.
Copper trades in United States Copper (CPER) and Global X Copper Miners (COPX) are on Hold. CPER and COPX both benefited from strength in copper and precious metals gold and silver, but the precious metals’ rally has likely come to end. This has put pressure on COPX and to a lesser extent CPER. Copper’s trend remains positive, but its momentum has slowed. Suggested stop losses have been raised to protect some profit and allow for potential additional upside.
Invesco DB Agriculture (DBA) is still on Hold. Shares remain stuck in a narrow range. Today’s modest gain is encouraging but additional follow-through is needed to warrant putting any additional capital to work here.
In anticipation of seasonal weakness possibly persisting a bit longer this month, all remaining positions not previously mentioned in the Sector Rotation portfolio can be considered on dips below their respective buy limits in the table below. This applies if you do not have an existing position(s) or if you are looking to add to an existing position(s).
Please note some stop losses have been adjusted to account for recent gains.
Tactical Seasonal Switching Strategy ETF Portfolio Updates
Positions in the Tactical Seasonal Switching Strategy portfolio were up 3.6% on average as of the close on February 4 compared to 3.7% in the January update. The tech slump has hit QQQ the hardest followed by SPY. However, DIA and IWM were both up over 6% which was a modest gain compared to last month. At a little more than halfway through the Best Six Months for DJIA and S&P 500 and not even halfway through NASDAQ’s Best Eight Months, performance is mixed. All positions in the Tactical Seasonal Switching portfolio can be considered on dips if you do not have a position or are looking to add to an existing position. Please see the table below for suggested buy limits.
Disclosure note: Officers of Hirsch Holdings Inc hold positions in COPX, DBA, DIA, EFAV, EFV, EZU, IDV, IWM, IYT, QQQ, SPY, and XLE in personal accounts.
|
January Barometer Positive: Base Case Forecast In Play
|
|
By:
Jeffrey A. Hirsch & Christopher Mistal
|
January 30, 2026
|
|
|
|
S&P 500 gained 1.4% in January and thus our January Barometer is positive for 2026. Devised by Yale Hirsch in 1972, the
January Barometer has registered 12 major errors since 1950 (with full-year 2025 included) for an 84.2% accuracy ratio. This indicator adheres to propensity that
as the S&P 500 goes in January, so goes the year. Of the 12 major errors, nine have occurred since 2001. Including the eight flat years yields a .737 batting average.
Our January Indicator Trifecta combines the Santa Claus Rally (SCR), the First Five Days Early Warning System (FFD) and our full-month January Barometer (JB). The predictive power of the three is considerably greater than any of them alone. It was certainly on the mark in 2023 when all three were positive and S&P 500 gained 24.2%. However, this year is just the sixth time (including 1949) that the SCR was down, while the FFD and the JB were positive.
Focusing on just the positive JB alone has a solid track record. Up Januarys are followed by up years, 89.1% of the time (41/46 years) with an average S&P 500 gain of 16.9%. 11 of 19 of the last midterm years followed January’s direction. When January is positive in midterm years (shaded in grey in table below), 6 of 9 full years were up with an average gain of 15.4%. Full-year declines occurred in 1966, 1994, and 2018. The worst was a 13.1% full-year loss in 1966. (See STA 2026 page 18 for more.)
With our January indicators complete, we are affirming our
2026 Base Case scenario for average full-year gains of around 8-12% with some chop and volatility most likely sometime during late Q2 through Q3, or the “Weak Spot” of the 4-year election cycle. Seasonals continue to track, economic growth and the labor market are holding up, but trade policy, monetary policy and geopolitical events remain concerns.
Vegas Baby!
Later this month Jeff will be speaking at the Las Vegas MoneyShow at Paris Las Vegas (Feb 23–25, 2026) — and he’ll be sharing his updated Midterm Year 2026 Outlook, including what our January Barometer 2026 signal, the 4-Year Cycle, and the AI Tech Super Boom are telling us next.
This is shaping up to be a pivotal market year—and potentially a major opportunity for prepared investors and traders.
He’ll be hosting two in-depth workshops:
• Midterm Election Years: The Sweet Spot of the 4-Year Cycle
Why 2026 could set up the next major buying opportunity—and why he expects as much as a 50% market move from the 2026 low to the 2027 high. He’ll break down key 4-Year Cycle trends, seasonal trades, and timely sector opportunities.
• AI Tech Super Boom: Hot Stocks & Seasonal Sector Trades
The AI race isn’t slowing down. he’ll zero in on off-the-radar, undervalued AI stocks, hot sector plays, and seasonal trades positioned to benefit as the global AI arms race accelerates.
If you want three days of high-impact market education, expert analysis, and actionable ideas, he’d love to see you there.
Click here to register:
See you in Vegas!