|
Market at a Glance - 11/22/2022
|
|
By:
Christopher Mistal
|
November 22, 2022
|
|
|
|
11/22/2022: Dow 34098.10 | S&P 4003.58 | NASDAQ 11174.41 | Russell 2K 1860.44 | NYSE 15481.76 | Value Line Arith 8856.85
Seasonal: Bullish. December is the #3 month of the year for DJIA and S&P 500 since 1950, #4 NASDAQ month (since 1971). Small-cap outperformance historically begins around mid-December. Wall Street’s only “Free Lunch” will be served before the market opens on December 19. Watch for the Santa Claus Rally to begin when the market opens on December 22.
Fundamental: Improving? Retail earnings have been better than anticipated, suggesting the consumer is still on reasonably firm ground and breathes life into the hope that holiday sales could also be better than expected. Unemployment remains low with another month of solid payroll gains. Energy prices have eased slightly which is likely giving a modest bump to consumer confidence. Corporate earnings are forecast to slow, but not retreat. Midterm elections are over and gridlock in Washington has historically been favorable for the market.
Technical: New Bull Market? Confirmation remains elusive. Bullishly DJIA has reclaimed its 50- and 200-day moving averages and is less than 60 points from its August closing high of 34152.01. S&P 500 and NASDAQ have reclaimed their respective 50-day moving averages but continue to lag. Both NASDAQ and tech-heavy S&P 500 could continue to lag until the Fed becomes a bit clearer with rates. Nonetheless, all three indexes remain in uptrends and the Q4 rally is intact.
Monetary: 3.25 – 4.00%. The Fed has yet to signal when at and what level rates may ultimately climb to, but they did appear to take a softer stance at their November meeting by acknowledging the cumulative and lagging effects of monetary policy changes. Softer than expected CPI and PPI have lifted hopes that the Fed’s pace of increases will slow in December. When that meeting arrives, there will be new CPI and PPI figures for the Fed to consider. Based upon most recently available projections, the Fed is getting close to the end of hikes. The sooner the end arrives, the happier the market is likely to be.
Sentiment: Neutral. According to
Investor’s Intelligence Advisors Sentiment survey Bullish advisors stand at 38.6%. Correction advisors are at 28.6% while Bearish advisors numbered 32.8% as of their November 16 release. This is the first time since mid-September that bulls outnumber bears. The margin is slim which suggests plenty of skepticism remains. This is not surprising considering how many market observers called a new bull market in early August only to be greatly disappointed with lower lows in September and October. The market appears to be slowing climbing the proverbial “wall of worry.”
|
December Outlook: Yearend Rally Climbs Wall of Worry
|
|
By:
Jeffrey A. Hirsch & Christopher Mistal
|
November 22, 2022
|
|
|
|
Today’s rally was encouraging with the S&P 500 closing above the big round 4000 number. And the across-the-board gains in the major averages and sectors were also constructive. We remain bullish on the yearend rally and the prospect for continuing gains into 2023, but not without concerns for the headwinds the market faces from inflation, Fed rate hikes, geopolitics and perhaps some fallout from the crypto crumble.
We have entered the most bullish time of the year, the Best Six Months (November-April) and the most bullish time of the 4-Year Cycle, “Sweet Spot” from Q4 midterm year to Q2 pre-election year. We are encouraged by the prototypical midterm election year bear market we have already suffered and what looks like a classic October bottom.
The market is still trying to recover from the technical damage while the economy recovers from some structural damage. So, while we expect further upside in December and next year, we suspect it will come with ups, downs and sideways along the way as it climbs the proverbial Wall of Worry.
Tempered Yearend Gains When S&P Down YTD Thanksgiving
Last year at this time on the Tuesday before Thanksgiving S&P 500 was up 24.9% year-to-date. November 2021 gave back a fractional loss, but December and the Santa Claus Rally delivered solid gains. But then the stuff hit the fan. Inflation became non-transitory, the Fed began tapering asset purchases and telegraphing imminent rate hikes, Russia invaded Ukraine and the
bear came out of hibernation.
This year on the Tuesday before Thanksgiving the market is in an entirely different situation with S&P down -16.0% YTD. The table here shows how the market claws its way back in most years with fewer but sizable losses bringing the averages down. The fact that November 2022 is up so far is supportive for continued upside. What stands out to us in this table is the rather solid performance for the Tuesday before Thanksgiving-Santa Claus Rally trade as well as solid gains for the Santa Claus Rally itself.
If Santa Claus Should Fail to Call…
And that brings us to the rather full seasonal docket for December. It is important to remember that while it is the most bullish time of the year there are weak spots and early December is one of them.
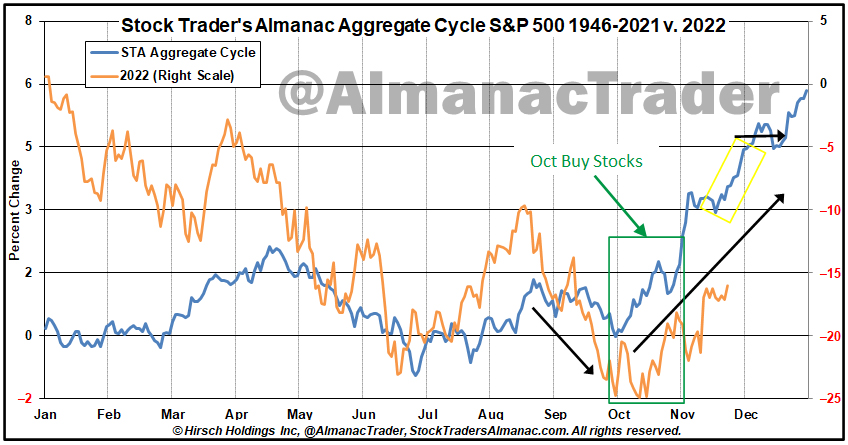
In the updated STA Aggregate Cycle graph, it is encouraging to see the S&P 500 in 2022 (orange line) continue to track the trend of this cycle which is an aggregate since 1946 of all years, midterm years and years ending in “2”. At this juncture we remain on track for a rally into the end of November and the first few days of December before tax-loss selling ramps up, of which there should be plenty this year, driving stocks lower into mid-December.
Then the “January Effect” (small caps outperforming large caps in the month of January) kicks in. These days most of the so-called January Effect takes place in the last half of December (2023 Almanac pages 112 & 114). The January Effect is not to be confused with the January Barometer (2023 Almanac page 18), which states as the S&P 500 goes in January, so goes the year. January’s gains in general for all the major averages have been pulled forward into December, but the Russell 2000 takes the lead as you can see in the typical December chart in last week’s
December Almanac.
Just before Chanukah and Christmas we give our “Free Lunch” stock picks from the lists of stocks making new 52-week lows on December Triple-Witching Friday which lands on December 16 this year and present the basket to subscribers over the weekend before the open the following Monday (see 2022 Almanac page 116). This strategy is built to capitalize on the January Effect and the Santa Claus Rally.
The Santa Claus Rally was defined by Yale Hirsch in 1972 as the last five trading days of the year and the first two trading days of the New Year. This short, sweet rally is usually good for about 1.3% on the S&P 500, but the real significance of the SCR is as an indicator.
It is our first seasonal indicator of the year ahead. Years when there was no Santa Claus Rally (SCR) tended to precede bear markets or times when stocks hit significantly lower prices later in the year. We get an even better indication of the New Year when we combine SCR with the First Five Days (FFD) Early Warning System (2023 Almanac page 16) and the full-month January Barometer (JB) reading. We call this the “January Indicator Trifecta.”
When all three are up the S&P 500 has been up 90% of the time, 28 of 31 years, with an average gain of 17.5%. When any of them are down the year’s results are reduced and when all three are down the S&P was down 3 of 8 years with an average loss of -3.6% with bear markets in 1969 (-11.4%), 2000 (-10.1%) and 2008 (-38.5%), flat years in 1956 (2.6%), 1978 (1.1%) and 2005 (3.0%). Down Trifectas were followed by gains in 1982 (14.8%) and 2016 (9.5%). This year SCR was up but the FFD and full month JB were down, and it was a valuable bearish indication for this year.
In the absence of a major systemic event in the market from crypto or somewhere else, or a serious escalation in the Ukraine war, or some extremely hawkish shift from the Fed or an economic surprise, we expect stocks to continue to move higher with some down and sideways moves mixed in as it climbs the Wall of Worry in this nascent bull market. We will want to see more progress in reclaiming the down trend. Having the S&P 500 reclaim its 200-day moving average would be a good start. Then some improvement in market internals.
For now, it appears to us that inflation may have peaked and is trending lower with three consecutive lower readings. According to the Atlanta Fed’s reliable GDPNow Q4 GDP is estimated to be over 4%. And with the Fed Funds Target Rate Upper Limit at 4% and the latest FOMC dot plot upper range at 5% we can surmise the Fed is near the end of the tightening cycle. So, we remain cautiously bullish. Happy Thanksgiving! We are thankful for all of you, our faithful and loyal subscribers.
Pulse of the Market
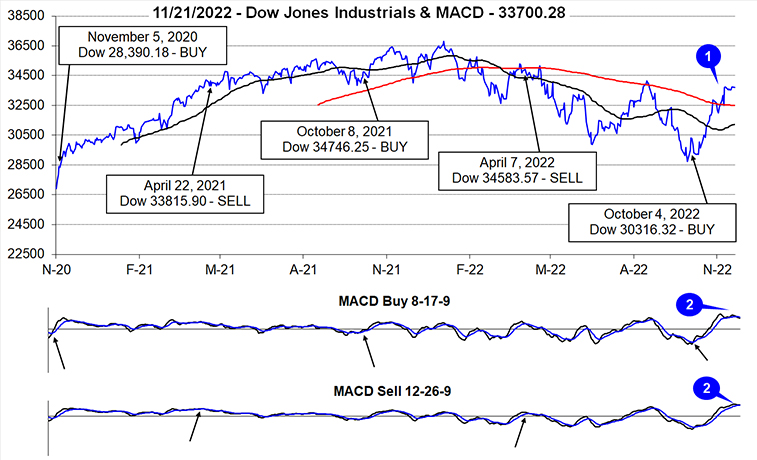
With five trading days remaining in midterm- year November, DJIA is on track to easily exceed its historical average performance. As of today’s close (11/22), DJIA is up 4.2% compared to 2.5% average in the last 18 midterm Novembers. Bullishly DJIA has spent the majority of this month above its 200-day moving average and the 50-day moving average has turned higher (1). The pace of gains has slowed since the surge higher in October but appears to be picking up once again today. Faster and slower MACD indicators applies to DJIA have turned mixed (2). The slower moving MACD remains positive while the faster moving MACD is modestly negative. Today’s DJIA gain has begun to reverse the faster MACD’s negative reading.
Even though midterm elections have come and gone, volatility has persisted. Despite this, DJIA has been up on Friday for five straight weeks now (3), and three of the gains were over 1%. Prior to the current streak, DJIA declined eight out of nine Fridays. Historically, strength on Fridays (or the last trading day of the week) has been generally bullish as it has tended to coincide with the return of confidence in the market and a corresponding bullish trend.
Last week’s declines by DJIA (3), S&P 500 (4) and NASDAQ (5) were in line with the recent 21-year seasonal trend in November. Provided no significant surprises occur in data or geopolitically between now and the end of the month, the historical trend suggests further gains through the end of the month. Last year, news of the Omicron Covid variant broke and wreaked havoc starting the day after Thanksgiving.
NYSE Weekly Advancers and Weekly Decliners (6) have been consistent with the market’s overall moves. Weekly Decliners easily outnumbered Weekly Advancers during down weeks while the opposite was true in advancing weeks. Bullishly it appears that fewer and fewer stocks are participating in down weeks. Recent down weeks have had far more Advancing issues in November when compared to similar down weeks in September.
Weekly New Highs (7) had been gaining momentum growing in number up until last week when they retreated slightly. New Weekly Lows have continued to decline and on the verge of falling below 100. The last time that happened was during the first week of November 2021. The resumption of expanding New Weekly Highs would be a welcome confirmation.
For the first time since April 2007, the 30-year Treasury bond yield has fallen below the 90-day Treasury yield (8). That was also the last time when the Fed was anyway near its present level with the Fed funds rate. Better than expected CPI and PPI readings this month combined with persistently hawkish comments from Fed members appear to be the main catalyst for the deepening inversion of the Treasury yield curve. It would appear the Treasury bond market believes the Fed has tightened sufficiently already. Whether or not the Fed listens remains up for debate.
|
December Almanac & Vital Stats: Tepid Start, But Solid Finish
|
|
By:
Jeffrey A. Hirsch & Christopher Mistal
|
November 17, 2022
|
|
|
|
December is the number three S&P 500 and Dow Jones Industrials month since 1950, averaging gains of 1.5% and 1.6% respectively. It’s the second-best Russell 2000 (1979) month and fourth best for NASDAQ (1971). It is also the third best month for Russell 1000 (1979). In 2018, DJIA suffered its worst December performance since 1931 and its fourth worst December going all the way back to 1901. However, the market rarely falls precipitously in December and a repeat of 2018 does not seem highly likely this year. When December is down it is usually a turning point in the market—near a top or bottom. If the market has experienced fantastic gains leading up to December, stocks can pullback in the first half of the month.
![[Midterm Year December Performance Table]](/UploadedImage/AIN_1222_20221117_Midterm_December_2022_mini_table.jpg)
In the last eighteen midterm years, December’s rankings slip modestly to #5 DJIA (0.9%), #3 S&P 500 (1.2%) and #7 NASDAQ (–0.3% since 1974). Small caps, measured by the Russell 2000, also tend to soften in midterm Decembers. Since 1982, the Russell 2000 has lost ground just three times in ten midterm years in December. The average small cap gain in all ten years is 0.3%. Midterm December performance had been stronger prior to previously mentioned December 2018.
![[December Seasonal Pattern Chart]](/UploadedImage/AIN_1222_20221117_December_2022_Seasonal_Chart.jpg)
Trading in December is holiday-inspired and fueled by a buying bias throughout the month. However, the first part of the month tends to be weaker as tax-loss selling and yearend portfolio restructuring begins. December’s first trading day has been bearish for S&P 500 and Russell 1000 over the last 21 years. A modest rally through the fifth or sixth trading day also has fizzled going into mid-month. It is around this point that holiday cheer tends to kick in and propel the indexes higher with a pause near month-end. Regardless, December is laden with market seasonality and important events.
Small caps tend to start to outperform larger caps near the middle of the month (early January Effect) and our “Free Lunch” strategy is served from the offerings of stocks making new 52-week lows on Triple-Witching Friday. An Almanac Investor Alert will be sent prior to the open on December 19 containing “Free Lunch” stock selections. The “Santa Claus Rally” begins on the open on December 23 and lasts until the second trading day of 2023. Average S&P 500 gains over this seven trading-day range since 1969 are a respectable 1.3%.
This is our first indicator for the market in the New Year. Years when the Santa Claus Rally (SCR) has failed to materialize are often flat or down. The last six times SCR (the last five trading days of the year and the first two trading days of the New Year) has not occurred were followed by three flat years (1994, 2004 and 2015) and two nasty bear markets (2000 and 2008) and a mild bear that ended in February 2016. As Yale Hirsch’s now famous line states, “If Santa Claus should fail to call, bears may come to Broad and Wall.”
December Triple Witching Week is more favorable to the S&P 500 with Monday up thirteen of the last twenty-two years while Triple-Witching Friday is up twenty-six of the last forty years with an average 0.21% gain. The entire week has logged gains twenty-eight times in the last thirty-eight years. The week after December Triple Witching is the best of all weeks after Triple Witching for DJIA and is the only one with a clearly bullish bias, advancing in thirty of the last forty years. Small caps shine especially bright with a string of bullish days that runs from December 21 to 27.
Trading the day before and the day after Christmas is generally bullish across the board with the greatest gains coming from the day before (NASDAQ up eleven of the last fifteen). On the last trading day of the year, NASDAQ has been down in fifteen of the last twenty-two years after having been up twenty-nine years in a row from 1971 to 1999. DJIA, S&P 500, and Russell 1000 have also been struggling recently and exhibit a bearish bias over the last twenty-one years. Russell 2000’s record very closely resembles NASDAQ, gains every year from 1979 to 1999 and only six advances since.
|
December 2022 Strategy Calendar
|
|
By:
Christopher Mistal
|
November 17, 2022
|
|
|
|
|
November Stock Basket & Stock Portfolio Update: Cash Back to Work
|
|
By:
Christopher Mistal
|
November 10, 2022
|
|
|
|
Evidence had been building that year-over-year CPI likely peaked in June of this year at 9.1% even before today’s CPI release. Energy and numerous commodity prices had eased from their peaks earlier in the year, housing and rents have been slowing, and prices for many items at the local market seemed to be plateauing. The lighter than anticipated headline CPI, 7.7% reported versus 7.9% forecast, was exactly what the market has been looking for and DJIA, S&P 500, NASDAQ and Russell 2000 responded with their best daily moves in over two years.
Headline inflation essentially took a rocket ride higher and is now in the process of drifting lower like a feather. Today’s reading is encouraging, but inflation is still running well above the Fed’s official target of 2% and it will likely take much longer to retreat to around the 2% level than it did to rise to it peak. Inflation’s current drift lower is likely to have a few bumps higher which are likely to keep the Fed and the market on edge. We do maintain our bullish outlook for the “Best Months” and the “Sweet Spot” of the four-year cycle but do anticipate volatile trading along the way.
Rebuilding the Portfolio
Today we present a second basket of stocks for your consideration. This basket was compiled with a focus on mid-cap and large-cap stocks as the October basket was mostly small-caps. For us any company with a market value of $50 million to $1 billion is a small-cap. Mid-caps fall in a range from $1 billion to $5 billion. Any market value exceeding $5 billion is a large-cap. Generally, the larger the company’s valuation the less volatile it tends to trade as there is normally broader analyst coverage and thus typically fewer surprises.
We will look to add these 16 stocks, in the table below, near current levels or on minor dips. Many of the positions did jump today and could just as quickly retreat or consolidate tomorrow. We will allocate a hypothetical $3000 from the cash position in the Stock Portfolio to each mid-cap position and a hypothetical $4000 to each large-cap position. For tracking purposes, all sixteen will be added to the portfolio using their average trading price tomorrow, November 11.
Following in the tradition of the last stock basket, for each company we have provided the ticker, name, sector, general business description, PE, price-to-sales ratio, market value and a suggested buy limit and stop loss. We arrived at this basket
using similar selection criteria to the October Stock Basket.
At the end of the screening process this time around, we were left with a reasonably diversified basket of companies. Aside from additional energy sector exposure, there is a handful of technology companies, semiconductors, metals, and healthcare.
Stock Portfolio Updates
Over the last four weeks since last update through yesterday’s close, S&P 500 advanced 4.8% while Russell 2000 climbed 4.3%. Over the same period the entire stock portfolio was 1.4% higher, excluding dividends and any fees. Overall performance was restrained by the sizable balance of cash in the portfolio even after adding the eleven new positions from October’s Stock Basket.
Energy’s recent weakness was also a drag on performance as many of the new additions retreated from recent highs. We see energy’s recent weakness as temporary. OPEC is curtailing supply, China’s Covid-19 lockdowns are most likely going to be a short-term hit to demand while the weakening U.S. dollar is likely to support energy prices. Warmer than usual weather here in the Northeast also appears to be coming to an end with more seasonal temperatures arriving soon. And regardless of the eventual outcome of midterm elections, the current administration is not likely to reverse course on its aggressive support for renewables. All these factors appear to support continued supply constraints while demand remains reasonably firm.
New small-cap positions have performed respectably over the last four weeks, up on average 4.3%. NACCO Industries (NC) was initially positive but appears to have succumbed to some portfolio taking and it currently is the poorest performing position in the Small-Cap portfolio. NC did bounce back today, gaining 6.24%. W&T Offshore (WTI) was also down at the start of trading today but finished with a 4.10% gain. Quest Resource Holding (QRHC) was the top performing new small cap at the start of the day, up 11.6%. However, QRHC was one of only two positions to decline modestly today.
New mid-cap positions are a mixed bag. At today’s close, Comstock Resources (CRK) and Permian Resources (PR) are positive while CONSOL Energy (CEIX) lags, down around 10% since addition. CEIX can be considered at current levels while CRK and PR can still be considered on dips below their buy limits.
Even prior to today, AT&T (T) had finally found some support and was trending higher. The catalyst for the rebound appears to have been better than expected Q3 results which would seem to signal that management may finally be turning the company around. Continue to Hold T.
Positions in the today’s stock basket will be added to the portfolio table in the next update. All positions from the October Basket and today’s basket can be considered on dips or at current levels.
Disclosure note: Officers of Hirsch Holdings Inc hold positions in CEIX, CRK, EPSN, MUR, PR, QRHC & WTI in personal accounts.
|
ETF Trades: Volatility Persists, Election Uncertainty Ending Soon
|
|
By:
|
November 03, 2022
|
|
|
|
Soon it will be Election Day and hopefully not long after we will have the results. Once the outcome is known, it will likely alleviate some of the uncertainty that has been contributing to the market’s volatile trading which could help the market snap out of the current Fed-induced funk. In the following chart the 30 trading days before and 60 trading days after the last 18 midterm-year elections appear (NASDAQ since 1974). Prior to 1969 the market was closed on Election Day so the close on the day before was used. By 60 trading days after the election (approximately three months), DJIA, S&P 500 and NASDAQ were all higher on average from 6.4% to 9.2%.
![[30 trading days before & 60 trading days after chart]](/UploadedImage/AIN_1222_20221103_Midterm_Election_B4-After_Chart.jpg)
Digging deeper into the data, the following table shows S&P 500 performance 1-, 3-, 6- and 12-months after the election. 1- and 3-months after the election S&P 500 was higher 77.8% and 88.9% of the time respectively. By 6-months and 1-year after, S&P 500 was always higher, although gains did slow after 6-months. Years when the President’s party lost its majority in Congress are shaded in gray.
![[S&P 500 Performance Table]](/UploadedImage/AIN_1222_20221103_Midterm_Election_Forward_Table.jpg)
As we pointed out last week, the Sweet Spot of the 4-year cycle is now. The headwinds that abound this time around are not entirely unlike past midterm years that have historically been mired by bear markets and uncertain economic and political times. Many of the current concerns do appear to be accounted for by the market’s declines coming into Q4. Inflation does remain stubbornly high despite the Fed aggressively raising rates this year. The Fed’s most recent statement may not have been as dovish as some had hoped for, but it did contain language that suggested the time to slow the pace of increases and possibly even pause hikes is closer now than it was six months ago. The market is likely to remain volatile as it awaits more clarity from the Fed and more signs that inflation is easing. Any back and fill periods by the market are likely an opportunity to consider adding to existing long positions or establishing new longs.
Sector Rotation ETF Portfolio Updates
All twelve new ETF trade ideas presented on the first Thursday of October were added to the Sector Rotation portfolio on October 7. All were added using their respective average price on that day. As of yesterday’s close, SPDR Industrials (XLI) was the top performing position, up 8.4%. Not far behind was SPDR Financial (XLF), up 8.2%. Rising interest rates are likely the key driver for financials. Sizable gains from aerospace and defense lifted the broader industrials sector in October. XLI and XLF can still be considered on dips.
At the opposite end of the performance spectrum, we find iShares US Technology (IYW) and SPDR Consumer Discretionary (XLY), down 3.7% and 3.3% respectively. Mega-cap tech has had of tough year and its struggles persist while the consumer sector is being weighted down by Amazon’s recent performance. Historically both sectors have been sensitive to interest rates. Continued choppy trading is likely in order as interest rates continue to creep higher. IYW and XLY can be considered at current levels.
Other honorable mentions go to SPDR Consumer Staples (XLP), SPDR Healthcare (XLV) and iShares DJ US Telecom (IYZ), all were up around 6% or slightly better at yesterday’s close. XLP and XLV were flat today while IYZ was off 2.19%. Companies held by XLP and XLV are likely to have above average success at passing price increases out to their customers. All three can be considered on dips below their buy limits.
iShares NASDAQ Biotech (IBB) was also added to the portfolio on October 7. IBB was added using its average price from that day as it opened the day trading less than the suggested buy limit. IBB also bucked the trend of broad weakness today. IBB can be considered on dips below its buy limit.
The short trade in iShares Semiconductors (SOXX) was covered on October 7 for a 17.4% gain excluding any trading costs. On the same day a new long position was established in SOXX. The new long position was then promptly stopped out on October 11 with a 7.2% loss. We will look to re-enter SOXX on dips below $315.00.
Please see the following table for current advice and updated stop losses, auto-sell prices and buy limits.
Tactical Seasonal Switching Strategy ETF Portfolio Updates
As of October 19, all three partial positions in bond ETFs have been stopped out of the portfolio. Their poor performance is not surprising, and we noted in early April that the
risk to bond ETFs was higher this year. For those reasons we elected partial positions in them and an allocation to cash and/or money market fund.
Results from SPDR DJIA (DIA), SPDR S&P 500 (SPY), Invesco QQQ (QQQ), and iShares Russell 2000 (IWM) are mixed thus far. DIA and IWM are positive while SPY and QQQ are in the red. Patiently accumulating on dips is our preferred approach this year as uncertainty remains elevated. Officially, the strategy does not employ stop losses on these positions. If this risk exceeds one own personal level, a stop loss could be utilized.